| For the fiscal year ended October 31, 2025 | Commission File Number 001-13928 |
Canada (Province or other jurisdiction of incorporation or organization) |
6029 (Primary Standard Industrial Classification Code Number) |
Not Applicable (I.R.S. Employer Identification Number (if applicable)) |
Josie Caldas Royal Bank of Canada 200 Bay Street Toronto, Ontario Canada M5J 2J5 Tel: (437) 533-9180 |
Benjamin H. Weiner Sullivan & Cromwell LLP 1700 New York Avenue, N.W. Suite 700 Washington, D.C. USA 20006-5215 Tel: (202) 956-7500 |
Title of each class |
Trading Symbol(s) |
Name of each exchange on which registered | ||
Common Shares |
RY |
New York Stock Exchange | ||
Not Applicable |
||||
| (Title of Class) |
Not Applicable |
||||
| (Title of Class) |
| Common Shares | 1,400,635,338 |
|||
| First Preferred Shares 1 |
||||
| Series BF | 12,000,000 2 |
|||
| Series BH | 6,000,000 3 |
|||
| Series BI | 6,000,000 3 |
|||
| Series BO | 14,000,000 |
|||
| Series BR | 1,250,000 4 |
|||
| Series BS | 1,000,000 4 |
|||
| Series BT | 750,000 5 |
|||
| Series BU | 750,000 5 |
|||
| Series BV | 1,000,000 4 |
|||
| Series BW | 600,000 5 |
|||
| Series BX | 1,000,000 4 |
|||
| Series BY | 1,250,000 4 |
|||
| Series BZ | 1,350,000 4 |
| If an emerging growth company that prepares its financial statements in accordance with U.S. GAAP, indicate by check mark if the registrant has elected not to use the extended transition period for complying with any new or revised financial accounting standards† provided pursuant to Section 13(a) of the Exchange Act. | ☐ | |
† The term “new or revised financial accounting standard” refers to any update issued by the Financial Accounting Standards Board to its Accounting Standards Codification after April 5, 2012. |
||
| Indicate by check mark whether the registrant has filed a report on and attestation to its management’s assessment of the effectiveness of its internal control over financial reporting under Section 404(b) of the Sarbanes-Oxley Act (15 U.S.C. 7262(b)) by the registered public accounting firm that prepared or issued its audit report. | ☒ | |
| If securities are registered pursuant to Section 12(b) of the Act, indicate by check mark whether the financial statements of the registrant included in the filing reflect the correction of an error to previously issued financial statements. | ☒ | |
| Indicate by check mark whether any of those error corrections are restatements that required a recovery analysis of incentive-based compensation received by any of the registrant’s executive officers during the relevant recovery period pursuant to § 240.10D-1(b). |
☐ | |
| ROYAL BANK OF CANADA | ||
| By: | /s/ David McKay | |
| Name: | David McKay | |
| Title: | President and Chief Executive Officer | |
| Date: | December 3, 2025 | |
Exhibit |
Exhibit No. | |
Royal Bank of Canada Annual Information Form dated December 2, 2025 |
1 | |
Financial Review |
2 | |
• Management’s Discussion and Analysis |
||
• Caution Regarding Forward-Looking Statements |
||
• Management’s Responsibility for Financial Reporting |
||
• Management’s Report on Internal Control over Financial Reporting |
||
• Report of Independent Registered Public Accounting Firm |
||
• Consolidated Financial Statements |
||
Consent of Independent Registered Public Accounting Firm |
3 | |
Code of Conduct |
4 | |
Return on Equity and Assets Ratios |
5 | |
Rule 13a-14(a)/15d-14(a) |
31 | |
• Certification of the Registrant’s Chief Executive Officer • Certification of the Registrant’s Chief Financial Officer |
||
Section 1350 Certifications |
32 | |
• Certification of the Registrant’s Chief Executive Officer • Certification of the Registrant’s Chief Financial Officer |
||
Royal Bank of Canada Policy for the Recovery of Erroneously Awarded Incentive-based Compensation from Executive Officers |
97 | |
Interactive Data File (formatted as Inline XBRL) |
101 | |
Cover Page Interactive Data File (formatted as Inline XBRL and contained in Exhibit 101) |
104 | |
Exhibit 1

ROYAL BANK OF CANADA
ANNUAL
INFORMATION
FORM
December 2, 2025
CAUTION REGARDING FORWARD-LOOKING STATEMENTS
From time to time, we make written or oral forward-looking statements within the meaning of certain securities laws, including the “safe harbour” provisions of the United States Private Securities Litigation Reform Act of 1995 and any applicable Canadian securities legislation. We may make forward-looking statements in this 2025 Annual Information Form and in the documents incorporated by reference herein, in other filings with Canadian regulators or the United States (U.S.) Securities and Exchange Commission (SEC), in reports to shareholders, and in other communications. In addition, our representatives may communicate forward-looking statements orally to analysts, investors, the media and others. Forward-looking statements in this document and in the documents incorporated by reference herein include, but are not limited to, statements relating to our financial performance objectives, priorities, vision and strategic goals, the economic, market, and regulatory review and outlook for Canadian, U.S., United Kingdom (U.K.), Euro area and global economies, the regulatory environment in which we operate, the Strategic priorities and Outlook sections for each of our business segments as discussed in our 2025 Annual Report for the fiscal year ended October 31, 2025 (2025 Annual Report), the risk environment including our credit risk, market risk, liquidity and funding risk as set out in our 2025 Management’s Discussion and Analysis for the fiscal year ended October 31, 2025 (2025 Management’s Discussion and Analysis) as well as the effectiveness of our risk monitoring, our climate- and sustainability-related beliefs, targets and goals and related legal and regulatory developments as set out in our 2025 Management’s Discussion and Analysis, and include statements made by our President and Chief Executive Officer and other members of management. The forward-looking statements contained in this 2025 Annual Information Form and in the documents incorporated by reference represent the views of management and are presented for the purpose of assisting the holders of our securities and financial analysts in understanding our financial position and results of operations as at and for the periods ended on the dates presented, as well as our financial performance objectives, vision, strategic goals and priorities and anticipated financial performance, and may not be appropriate for other purposes. Forward-looking statements are typically identified by words such as “believe”, “expect”, “suggest”, “seek”, “foresee”, “forecast”, “schedule”, “anticipate”, “intend”, “estimate”, “goal”, “commit”, “target”, “objective”, “plan”, “outlook”, “timeline” and “project” and similar expressions of future or conditional verbs such as “will”, “may”, “might”, “should”, “could”, “can” or “would” or negative or grammatical variations thereof.
By their very nature, forward-looking statements require us to make assumptions and are subject to inherent risks and uncertainties, both general and specific in nature, which give rise to the possibility that our predictions, forecasts, projections, expectations or conclusions will not prove to be accurate, that our assumptions may not be correct, that our financial performance, environmental & social or other objectives, vision and strategic goals will not be achieved, and that our actual results may differ materially from such predictions, forecasts, projections, expectations or conclusions.
We caution readers not to place undue reliance on our forward-looking statements as a number of risk factors could cause our actual results to differ materially from the expectations expressed in such forward-looking statements. These factors – many of which are beyond our control and the effects of which can be difficult to predict – include, but are not limited to: business and economic conditions in the geographic regions in which we operate, Canadian housing and household indebtedness, information technology, cyber and third-party risks, geopolitical uncertainty, environmental and social (E&S) risk, digital disruption and innovation, privacy and data related risks, regulatory changes, culture and conduct risks, credit, market, liquidity and funding, insurance, operational, compliance, reputation and strategic risks, other risks discussed in the risk sections of our 2025 Annual Report, including legal and regulatory environment risk, the effects of changes in government fiscal, monetary and other policies and tax risk and transparency, risks associated with escalating trade tensions, including protectionist trade policies such as the imposition of tariffs, risks associated with the adoption of emerging technologies, such as cloud computing, artificial intelligence (AI), including generative AI (GenAI), and robotics, fraud risk and our ability to anticipate and successfully manage risks arising from all of the foregoing factors. Additional factors that could cause actual results to differ materially from the expectations in such forward-looking statements can be found in the risk sections of our 2025 Annual Report, as may be updated by subsequent quarterly reports.
We caution that the foregoing list of risk factors is not exhaustive and other factors could also adversely affect our results. When relying on our forward-looking statements to make decisions with respect to us, investors and others should carefully consider the foregoing factors and other uncertainties and potential events, as well as the inherent uncertainty of forward-looking statements. Material economic assumptions underlying the forward-looking statements contained in this 2025 Annual Information Form are set out in the Economic, market and regulatory review and outlook section and for each business segment under the Strategic priorities and Outlook headings, as such sections may be updated by subsequent quarterly reports. Any forward-looking statements contained in this document represent the views of management only as of the date hereof, and except as required by law, we do not undertake to update any forward-looking statement, whether written or oral, that may be made from time to time by us or on our behalf. Additional information about these and other factors can be found in the risk sections of our 2025 Management’s Discussion and Analysis contained in our 2025 Annual Report, as may be updated by subsequent quarterly reports.
TABLE OF CONTENTS
| MD&A Incorporated by Reference |
||||||
| CORPORATE STRUCTURE |
1 | |||||
| Name, Address and Incorporation |
1 | |||||
| Intercorporate Relationships |
1 | |||||
| GENERAL DEVELOPMENT OF THE BUSINESS |
1 | |||||
| Three Year History |
1 | 23-26, 187-188* | ||||
| DESCRIPTION OF THE BUSINESS |
3 | |||||
| General Summary |
3 | 23-26, 32-59 | ||||
| Seasonality |
3 | 60-61 | ||||
| Competition |
3 | 32-59 | ||||
| Government Regulation and Supervision – Canada |
4 | |||||
| Government Regulation and Supervision – United States |
7 | |||||
| Risk Factors |
10 | 65-110 | ||||
| Environmental and Social Policies |
10 | 109-110 | ||||
| DESCRIPTION OF CAPITAL STRUCTURE |
10 | |||||
| General Description |
10 | 110-121, 220-223* | ||||
| Prior Sales |
13 | |
110-121, 219-220, 220-223* |
| ||
| Constraints |
13 | |||||
| Ratings |
14 | 95 | ||||
| MARKET FOR SECURITIES |
15 | |||||
| Trading Price and Volume |
15 | |||||
| DIVIDENDS |
17 | 117-119, 220-223* | ||||
| SECURITIES SUBJECT TO CONTRACTUAL RESTRICTION ON TRANSFER |
17 | |||||
| DIRECTORS AND EXECUTIVE OFFICERS |
18 | |||||
| Directors |
18 | |||||
| Committees of the Board |
19 | |||||
| Executive Officers |
20 | |||||
| Ownership of Securities |
21 | |||||
| Cease Trade Orders, Bankruptcies, Penalties or Sanctions |
21 | |||||
| Conflicts of Interest |
22 | |||||
| LEGAL PROCEEDINGS AND REGULATORY ACTIONS |
22 | 230-231* | ||||
| INTEREST OF MANAGEMENT AND OTHERS IN MATERIAL TRANSACTIONS |
22 | |||||
| TRANSFER AGENT AND REGISTRAR |
22 | |||||
| EXPERTS |
23 | |||||
| AUDIT COMMITTEE |
23 | |||||
| Audit Committee Mandate |
23 | |||||
| Composition of Audit Committee |
23 | |||||
| Relevant Education and Experience of Audit Committee Members |
23 | |||||
| Pre-Approval Policies and Procedures |
24 | |||||
| Independent Registered Public Accounting Firm Fees |
24 | |||||
| ADDITIONAL INFORMATION |
25 | |||||
| TRADEMARKS |
26 | |||||
| APPENDIX A – PRINCIPAL SUBSIDIARIES |
27 | |||||
| APPENDIX B – EXPLANATION OF RATINGS AND OUTLOOK |
28 | |||||
| APPENDIX C – AUDIT COMMITTEE MANDATE |
31 | |||||
| APPENDIX D – PRE-APPROVAL POLICIES AND PROCEDURES |
37 | |||||
*Notes 6, 18, 19 and 24 to the 2025 Annual Consolidated Financial Statements for the fiscal year ended October 31, 2025 (2025 Annual Consolidated Financial Statements) for Royal Bank of Canada are incorporated by reference herein.
INFORMATION IS AT OCTOBER 31, 2025, UNLESS OTHERWISE NOTED.
CORPORATE STRUCTURE
Name, Address and Incorporation1
Royal Bank of Canada is a Schedule I bank under the Bank Act (Canada), which constitutes its charter. The Bank was created as Merchants Bank in 1864 and was incorporated under the “Act to Incorporate the Merchants’ Bank of Halifax” assented to June 22, 1869. The Bank changed its name to The Royal Bank of Canada in 1901 and to Royal Bank of Canada in 1990.
The Bank’s corporate headquarters are located at Royal Bank Plaza, 200 Bay Street, Toronto, Ontario, Canada and its head office is located at 1 Place Ville-Marie, Montreal, Quebec, Canada.
Intercorporate Relationships
Information about intercorporate relationships with principal subsidiaries, including place of incorporation and percentage of securities owned by the Bank, is provided in Appendix A.
GENERAL DEVELOPMENT OF THE BUSINESS
Three Year History
Our business strategies and actions are guided by our vision, “To be among the world’s most trusted and successful financial institutions.” Our three strategic goals are:
| • | In Canada, to be the undisputed leader in financial services; |
| • | In the U.S., to be the preferred partner to institutional, corporate, commercial and high-net-worth clients and their businesses; and |
| • | In select global financial centres, to be a leading financial services partner valued for our expertise. |
In 2023, GDP growth slowed across most advanced economies as headwinds from higher interest rates continued to have a lagged impact. Canadian output in early calendar 2023 was supported by strength in consumer spending and an unexpectedly strong rebound in housing market activity in the spring. The U.S. economy remained resilient with strong consumer spending despite rising interest rates, and employment continued to increase. Bond yields increased substantially as markets demanded higher term premiums and expected central banks to hold policy interest rates higher for longer.
Effective the first quarter of 2023, we simplified our reporting structure by eliminating the Investor & Treasury Services segment and moving our Investor Services business to our Wealth Management segment and our Treasury Services and Transaction Banking businesses to our Capital Markets segment. Effective the fourth quarter of 2023, we moved the Investor Services lending business from our Wealth Management segment to our Capital Markets segment.
In 2023, RBC reported net income of $14.6 billion down 8% from the prior year, reflecting lower earnings in Wealth Management, Personal & Commercial Banking and Insurance, which were partially offset by higher results in Capital Markets, and the impact of the Canada recovery dividend and other tax related adjustments in 2023. 2023 also reflected higher provisions on credit losses.
1 When we say “we”, “us”, “our”, or “RBC”, we mean Royal Bank of Canada and its subsidiaries, as applicable. References to “the Bank” mean Royal Bank of Canada without its subsidiaries.
In 2024, central banks began reducing interest rates from elevated levels as inflation slowed. In Canada, while GDP continued to increase, in aggregate, it declined on a per-capita basis for six consecutive quarters as of the third calendar quarter of 2024. Unemployment rates remained low across most advanced economies but increased more substantially in Canada. The U.S. economy remained resilient with strong GDP growth, robust consumer spending despite high interest rates and a low unemployment rate. Government bond yields increased after declining into the summer of 2024 as markets awaited the extent to which central banks would cut interest rates in the year ahead and equity markets increased to record highs.
During 2024, RBC made several key executive changes and appointments and effective the fourth quarter of 2024, the Personal & Commercial Banking segment became two standalone business segments: Personal Banking and Commercial Banking. With this change, RBC Direct Investing moved to the Wealth Management segment.
RBC reported net income of $16.2 billion in 2024, up 11% from the prior year, reflecting growth across each of our business segments. 2024 results also reflected the inclusion of HSBC Bank Canada results, which increased net income by $453 million, and include higher provisions on impaired loans, largely in Commercial Banking and Personal Banking.
Canadian GDP contracted in the second calendar quarter of 2025, impacted by reduced foreign demand for Canadian exports after U.S. tariffs were imposed, but increased in the third calendar quarter of 2025. The unemployment rate declined to 6.9% in October 2025 after rising to 7.1% in August and September 2025 but was up 0.3% from a year earlier. The end of the consumer carbon tax on energy products in most provinces lowered the Canadian headline inflation rate, but excluding those changes, core inflation measures trended closer to the top of the 1% to 3% inflation target range for the Bank of Canada (BoC). The BoC cut the overnight rate by 275 basis points since June 2024.
In the U.S. GDP continued to grow. Consumer spending was robust but employment growth stalled, impacted by rising trade uncertainty, reduced immigration and slower hiring in the industrial sector as tariffs increased. The unemployment rate edged higher but remained low as of the last reported rate in September 2025. Slower job growth in the U.S. prompted the Federal Reserve to restart interest rate reductions in September 2025. Unemployment rates remained very low across countries in the Euro area while the unemployment rate in the U.K. increased. Inflation in the Euro area remained low while U.K. inflation moderated, allowing the Bank of England to begin gradually lowering interest rates. Government bond yields edged lower in Canada since the summer and declined in the U.K., but were little changed in the Euro area. U.S. Equity markets remained close to record highs.
RBC reported net income of $20.4 billion in 2025, up $4.1 billion or 25% from the prior year, primarily driven by higher results across all of our business segments. Prior year results also reflected higher transaction and integration costs and the impact of management of closing capital volatility related to the acquisition of HSBC Bank Canada, both of which were treated as specified items and reported in Corporate Support. Earnings also reflected an increase due to the impact of foreign exchange translation.
We continue to monitor and prepare for regulatory developments and changes in a manner that seeks to ensure compliance with new requirements, while mitigating adverse business or financial impacts. Such impacts could result from new or amended laws or regulations and the expectations of those who enforce them. A high level summary of the key regulatory changes that have the potential to increase or decrease our costs and the complexity of our operations is included in the Legal and regulatory environment risk section of our 2025 Annual Report. For a discussion on risk factors resulting from these and other developments which may affect our business and financial results, refer to the risk sections of our 2025 Annual Report. For further details on our framework and activities to manage risks, refer to the risk and Capital management sections of our 2025 Annual Report.
2
Our acquisitions and dispositions that have influenced the general development of our business over the past three years are summarized in the following table:
| Acquisition/Disposition | Key Characteristics | |
| Disposition of RBC Investor Services® operations (2023) | Divests RBC Investor Services operations in Europe, Jersey and the U.K to CACEIS, the asset servicing banking group of Crédit Agricole S.A. and Banco Santander, S.A. | |
| Acquisition of HSBC Bank Canada (2024) | Provides the opportunity to enhance our existing businesses in line with our strategic goals and to better position us to be the bank of choice for commercial clients with international needs, newcomers to Canada and globally connected clients |
Additional information can also be found under “Overview and outlook” beginning on page 23 and in Note 6 “Significant acquisition” beginning on page 187 of our 2025 Annual Consolidated Financial Statements, which sections and note are incorporated by reference herein.
DESCRIPTION OF THE BUSINESS
General Summary
Royal Bank of Canada is a global financial institution with a purpose-driven, principles-led approach to delivering leading performance. Our success comes from the 100,000+ employees who leverage their imaginations and insights to bring our vision, values and strategy to life so we can help our clients thrive and communities prosper. As Canada’s biggest bank and one of the largest in the world, based on market capitalization, we have a diversified business model with a focus on innovation and providing exceptional experiences to our more than 19 million clients in Canada, the U.S. and 27 other countries.
Our business segments are Personal Banking, Commercial Banking, Wealth Management, Insurance and Capital Markets. Our business segments are supported by Corporate Support.
Additional information about our business and each segment (including segment results) can be found under “Overview and outlook” beginning on page 23 and under “Business segment results” beginning on page 32 of our 2025 Management’s Discussion and Analysis, which sections are incorporated by reference herein.
Seasonality
Information about seasonality is provided under “Quarterly results and trend analysis” beginning on page 60 of our 2025 Management’s Discussion and Analysis, which section is incorporated by reference herein.
Competition
Personal Banking competes with other Schedule 1 banks, independent trust companies, foreign banks, credit unions, caisses populaires and auto financing companies, as well as emerging entrants to the financial services industry, in Canada; other banks, emerging digital banks, trust companies and investment management companies serving retail and corporate clients, as well as public institutions, in the Caribbean; and other Canadian banking institutions that have U.S. operations, in the U.S.
Commercial Banking competes with other Schedule 1 banks, foreign banks, credit unions, specialized financing companies, as well as emerging non-traditional entrants to the financial services industry, in Canada.
3
Our Canadian Wealth Management business competes with domestic banks and trust companies, investment counselling firms, bank-owned full-service brokerages and boutique brokerages, mutual fund companies and global private banks. In Canada, bank-owned wealth managers continue to be the major players for the high-net-worth (HNW) and ultra-high-net-worth (UHNW) client segments. Our U.S. Wealth Management business (including City National Bank (CNB)) specializes in strategic solutions for unique industry needs, including in the fields of entertainment, sports, real estate, food and beverage, healthcare, technology, legal, nonprofit and property management, and competitors include other broker-dealers, commercial banks and other financial institutions that service HNW and UHNW individuals, entrepreneurs and their businesses. Our Global Asset Management business faces competition in Canada from banks, insurance companies and asset management organizations; in the U.S. from independent asset management firms, as well as those that are part of national and international banks and insurance companies; and internationally from asset managers that are owned by international banks, as well as national and regional asset managers in the geographies where we serve clients. Competitors to our International Wealth Management business include global wealth managers, traditional private banks and domestic wealth managers. Competitors to our Investor Services business include domestic and international custodians with Canadian-based entities and operations.
In our Canadian Insurance business, many of our competitors specialize in life and health, wealth or property and casualty products. In our International Insurance business, we compete in the global reinsurance market.
Our Capital Markets business is a market leader in Canada with a strategic presence in all lines of capital markets businesses. In North America, competitors include large global investment banks. Outside North America, we have a targeted strategic presence in the U.K. & Europe, Australia, Asia and other markets aligned with our global expertise and compete with global and regional investment banks.
Additional information about our competition can be found under “Business segment results” beginning on page 32 of our 2025 Management’s Discussion and Analysis, which section is incorporated by reference herein.
Government Regulation and Supervision – Canada
The Bank is a “Schedule I” bank under the Bank Act (Canada) (Bank Act), and, as such, is a federally regulated financial institution. It has Canadian insurance and trust and loan company subsidiaries that are also federally regulated financial institutions (FRFI Subsidiaries and, together with the Bank, FRFIs) governed by (respectively) the Insurance Companies Act (Canada) (Insurance Companies Act) and the Trust and Loan Companies Act (Canada) (Trust and Loan Companies Act). The activities of the FRFI Subsidiaries are also regulated under provincial and territorial laws in respect of their activities in the provinces and territories. In certain provinces, some of the Bank’s capital markets and wealth management activities are regulated under provincial securities laws (which are administered and enforced by securities regulatory authorities).
The Office of the Superintendent of Financial Institutions (OSFI), an independent agency of the Government of Canada, is responsible for administering the Bank Act, Trust and Loan Companies Act and Insurance Companies Act and reports to the Minister of Finance (the Minister) for the supervision of the FRFIs. OSFI is required, at least once a year, to examine the affairs and business of each FRFI for the purpose of determining whether the FRFI is complying with the provisions of its governing statute and it is in sound financial condition, and report to the Minister. The FRFIs are also required to make periodic filings and reports to OSFI.
The FRFIs are also subject to regulation under the Financial Consumer Agency of Canada Act (FCAC Act).2 The Financial Consumer Agency of Canada (Agency), among other things, enforces consumer-related provisions of the federal statutes which govern these financial institutions. The Commissioner of the Agency must report to the Minister on all matters connected with the administration of the FCAC Act and consumer provisions of other federal statutes, including the Bank Act, Trust and Loan Companies Act and Insurance Companies Act. The FRFIs are also subject to provincial and territorial laws of general application.
2 For the Bank’s trust subsidiaries, only their retail deposit taking activities are subject to regulation under the FCAC Act.
4
The Bank and the following subsidiaries are member institutions of the Canada Deposit Insurance Corporation (CDIC): Royal Trust Corporation of Canada, The Royal Trust Company, Royal Bank Mortgage Corporation and RBC Investor Services Trust. CDIC insures eligible deposits held at its member institutions. Under the Bank Act, the Bank is prohibited from engaging in or carrying on any business other than the business of banking, except as permitted under that statute. The business of banking includes providing any financial services; acting as a financial agent; providing investment counselling services and portfolio management services; issuing payment, credit or charge cards; and operating payment, credit or charge card plans.
The Bank has broad powers to invest in securities of other corporations and entities but is limited in making “substantial investments” in or in controlling certain types of entities. A “substantial investment” will arise through direct or indirect beneficial ownership of voting shares carrying more than 10 per cent of the voting rights attached to all outstanding voting shares of a corporation, shares representing more than 25 per cent of the shareholders’ equity in a corporation or interests representing more than 25 per cent of the ownership interests in any unincorporated entity. The Bank can make controlling, and in certain circumstances, non-controlling substantial investments in certain entities in accordance with the investment provisions under the Bank Act. Some substantial investments may be made only with the prior approval of the Minister or the Superintendent of Financial Institutions (the Superintendent).
Each FRFI is also required to maintain, in relation to its operations, adequate capital and liquidity, and OSFI may direct financial institutions to increase capital and/or to provide additional liquidity.
The Proceeds of Crime (Money Laundering) and Terrorist Financing Act (the PCMLTFA) is applicable to all of our businesses in Canada. The PCMLTFA implements specific measures designed to detect and deter money laundering and the financing of terrorist activities. Further, the PCMLTFA sets out obligations related to deterring and detecting money laundering and terrorist financing from a global perspective, in order to minimize the possibility that RBC could become a party to these activities. RBC has enterprise-wide anti-money laundering policies and procedures which assist in reducing the risk of facilitating money laundering and terrorist financing activities.
Bail-in Regime
Canada has a bank recapitalization regime (the Bail-in Regime) for domestic systemically important banks, including the Bank. Under the Canada Deposit Insurance Corporation Act, in circumstances where the Superintendent is of the opinion that the Bank has ceased, or is about to cease, to be viable, he or she will report this to CDIC. CDIC may then request the Minister to recommend that the Governor in Council (GIC) make one or more resolution-related orders. The Minister will make the recommendation if he or she is of the opinion that it is in the public interest to do so. The GIC may then, by order:
| • | vest in CDIC the shares and subordinated debt of the Bank specified in the order (a vesting order); |
| • | appoint CDIC as receiver in respect of the Bank (a receivership order); |
| • | if a receivership order has been made, direct the Minister to incorporate a federal institution designated in the order as a bridge institution wholly-owned by CDIC and specifying the date and time as of which the Bank’s deposit liabilities are assumed (a bridge bank order); or |
| • | if a vesting order or receivership order has been made, direct CDIC to carry out a conversion, by converting or causing the Bank to convert, in whole or in part – by means of a transaction or series of transactions and in one or more steps – the shares and liabilities of the Bank that are subject to the Bail-in Regime into common shares of the Bank or any of its affiliates (a conversion order). |
5
Upon the making of a conversion order, prescribed shares and liabilities under the Bail-in Regime that are subject to that conversion order will, to the extent converted, be converted into common shares of the Bank or any of its affiliates, as determined by CDIC. Subject to certain exceptions, senior debt issued on or after September 23, 2018, with an initial or amended term to maturity (including explicit or embedded options) greater than 400 days, that is unsecured or partially secured and that has been assigned a CUSIP or ISIN or similar identification number is subject to a bail-in conversion. For a description of Canadian bank resolution powers and the consequent risk factors attaching to certain liabilities of the Bank reference is made to rbc.com/investor-relations/_assets-custom/pdf/bail-in-overview.pdf.
Broker-Dealer/Advisory/Investment Fund Management Subsidiaries
The activities of certain of the Bank’s subsidiaries, such as RBC Dominion Securities Inc., RBC Direct Investing Inc., Royal Mutual Funds Inc., RBC Global Asset Management Inc., Phillips, Hager & North Investment Funds Ltd., RBC Phillips, Hager & North Investment Counsel Inc. and RBC InvestEase Inc., which act as securities dealers (including investment dealers, mutual fund dealers and exempt market dealers), advisers (portfolio managers) and/or investment fund managers are regulated in Canada under provincial and territorial securities/commodity futures/derivatives laws (which are administered and enforced by the applicable securities regulatory authorities) and, for investment dealers and mutual fund dealers, by the rules of the Canadian Investment Regulatory Organization (CIRO). The Bank’s subsidiaries that are CIRO dealer members are also members of the Canadian Investor Protection Fund, which protects, within specified limits, customers’ accounts against certain losses of customer property held by CIRO dealer members that become insolvent.
Insurance
The activities of the Bank’s regulated Canadian insurance subsidiaries, RBC Life Insurance Company (RBC Life) and RBC Insurance Company of Canada (RICC), are federally governed by the Insurance Companies Act and by provincial legislation in each province and territory in which they carry on business. In addition, the Bank Act sets out a framework for insurance activities that the Bank may or may not carry out. The Bank may administer, promote and provide advice in relation to certain authorized types of insurance and may conduct any aspect of the business of insurance, other than the underwriting of insurance, outside of Canada and in respect of risks outside Canada. However, in Canada, the Bank may not act as agent for any person in the placing of insurance. The Bank can promote an insurance company, agent or broker or non-authorized types of insurance (e.g. life and home and automobile insurance) to certain prescribed groups where the promotion takes place outside of physical bank branches. Additionally, and subject to applicable restrictions under the Bank Act, RBC Wealth Management Financial Services Inc., a wholly owned indirect subsidiary of the Bank, is licensed under applicable provincial and territorial laws to sell insurance products, including individual and group life and living benefits insurance along with money products such as annuities and segregated funds, for both related and independent insurance companies in Canada.
RBC Life is a member of Assuris, which is a not-for-profit organization that protects Canadian life insurance policyholders against loss of benefits due to the financial failure of a member company. RICC is a member of the Property and Casualty Insurance Compensation Corporation, which is the corporation protecting Canadian property and casualty policyholders against loss of benefits due to the financial failure of a member company.
RBC Insurance Agency Ltd. and RBC Commercial Insurance Agency Inc., wholly owned indirect Bank subsidiaries, are licensed insurance agencies that distribute insurance products underwritten by non-RBC entities. These products include home and auto insurance and commercial insurance that are underwritten by an unaffiliated insurance company.
6
Government Regulation and Supervision – United States
Banking
In the U.S., the Bank is characterized as a foreign banking organization (FBO). Generally, the operations of an FBO and its U.S. subsidiaries and offices are subject to the same comprehensive regulatory regime that governs the operations of U.S. domestic banking organizations. The Bank’s U.S. businesses are subject to supervision and oversight by various U.S. authorities, including federal and state regulators, as well as self-regulatory organizations.
Under the International Banking Act of 1978, as amended (IBA) and the Bank Holding Company Act of 1956, as amended (BHCA), all of the Bank’s U.S. banking operations are subject to supervision and regulation by the Board of Governors of the Federal Reserve System (Federal Reserve). Under the IBA, the BHCA, and related regulations of the Federal Reserve, the Bank generally may not open a branch, agency or representative office in the U.S., nor acquire five per cent or more of the voting stock of any U.S. bank or BHC, without notice to or prior approval of the Federal Reserve. The Federal Reserve is the U.S. “umbrella regulator” responsible for supervision and oversight of the Bank’s consolidated U.S. activities. The Federal Reserve consults with and obtains information from other prudential and functional U.S. regulators that exercise supervisory authority over the Bank’s various U.S. operations. Reports of financial condition and other information relevant to the Bank’s U.S. businesses are regularly filed with the Federal Reserve.
In 2000, the Bank became a U.S. FHC, as authorized by the Federal Reserve. Pursuant to the Gramm-Leach-Bliley Act of 1999, as amended, an FHC may engage in, or acquire companies engaged in, a broader range of financial and related activities than are permitted to banking organizations that do not maintain FHC status. To qualify as an FHC, the Bank, as an FBO and BHC, must meet certain capital requirements and must be deemed to be “well managed” for U.S. bank regulatory purposes. In addition, any U.S. depository institution subsidiaries of the FBO or BHC must also meet certain capital requirements and be deemed to be “well managed” and must have at least a “satisfactory” rating under the Community Reinvestment Act of 1977, as amended. An FBO must meet several conditions in order to maintain “well managed” status for U.S. bank regulatory purposes: (i) the FBO must have received a composite regulatory rating of “satisfactory” or better for its U.S. branch, agency and commercial lending company operations following its last regulatory examination, (ii) the FBO’s home country supervisor must consent to it expanding its activities in the U.S. to include activities permissible for a financial holding company (FHC), (iii) the FBO’s management must meet standards comparable to those required for a U.S. bank subsidiary of an FHC and (iv) each U.S. depository institution subsidiary of the FBO and/or bank holding company (BHC) must be deemed to be “well managed”, which is based on regulatory examination ratings.
The Federal Reserve, however, has the authority to limit an FHC’s ability to conduct activities that would otherwise be permissible if the FHC or any of its U.S. depositary institution subsidiaries does not satisfactorily meet certain capital requirements or is not deemed to be “well managed”. In such cases, the Federal Reserve may impose corrective capital and/or managerial requirements, as well as additional limitations or conditions. If the deficiencies persist, the FHC may be required to divest its U.S. depository institution subsidiaries or to cease engaging in activities other than the business of banking and certain closely related activities. If any insured depository institution subsidiary of an FHC fails to maintain at least a “satisfactory” rating under the Community Reinvestment Act of 1977, as amended, the FHC would be subject to restrictions on certain new activities and acquisitions.
On July 21, 2010, the Dodd-Frank Wall Street Reform and Consumer Protection Act (Dodd-Frank Act) was enacted. The statute effected significant changes to U.S. financial regulations and required rulemaking by the U.S. financial regulators, with material cross-border implications. Section 165 of the Dodd-Frank Act required the Federal Reserve to establish Enhanced Prudential Standards for Foreign Banking Organizations (Regulation YY). Amongst other regulatory requirements, Regulation YY required the Bank to establish an intermediate holding company (IHC) organized under U.S. law. The IHC is required to hold, directly or indirectly, the Bank’s entire ownership interest in its U.S. insured depository institution subsidiaries and other U.S. subsidiaries (excluding so called section 2(h)(2) companies and branch subsidiaries acquired by debt previously contracted). The Bank has established a two-tier BHC structure in the U.S., consisting of RBC US Group Holdings LLC (RBCUS), its top-tier BHC, as the Bank’s IHC and the parent of RBC USA Holdco Corporation, the parent of most of the Bank’s U.S. subsidiaries. Both RBCUS and RBC USA Holdco Corporation are BHCs and FHCs. The Bank fulfills its Regulation YY regulatory requirements through RBCUS, which include capital adequacy, capital planning and stress testing, risk management and governance, liquidity and liquidity stress testing, financial regulatory reporting and other requirements that are similar to, or the same as, those applicable to U.S. domestic BHCs that are similarly categorized under the rules that tailor enhanced prudential standards for FBOs and large U.S. banking organizations. In addition, the Bank is registered as a “Swap Dealer” with the U.S. Commodity Futures Trading Commission (CFTC) and the National Futures Association (NFA) and as a “Security-Based Swap Dealer” with the SEC.
7
The USA PATRIOT Act of 2001, as amended, which amended the Bank Secrecy Act (BSA) of 1970, as amended (the Act), requires U.S. banks and certain other financial institutions with U.S. operations to maintain appropriate policies, procedures and controls reasonably designed to comply with the Act, including, as applicable, anti-money laundering compliance programs, suspicious activity and currency transaction reporting and other obligations including due diligence on customers to prevent, detect and report individuals and entities involved in money laundering and the financing of terrorism. In January 2021, the Anti-Money Laundering Act of 2020 (AMLA), which also amended the Act, was enacted. The AMLA was intended to comprehensively reform and modernize U.S. anti-money laundering laws. In September 2022, the U.S. Department of Treasury’s Financial Crimes Enforcement Network (FinCEN) issued a final rule implementing the beneficial ownership information (BOI) reporting requirements under the Corporate Transparency Act, which was part of the AMLA. The BOI rule, which went into effect January 1, 2024, implemented sweeping beneficial owner disclosure requirements applicable to U.S. companies and foreign companies doing business in the U.S., subject to certain exceptions. The BOI rule is the first of three related rulemakings. On December 21, 2023, FinCEN issued a final rule regarding authorized access to the BOI system (access rule) which provides the circumstances when the BOI may be disclosed to federal agencies, regulators and financial institutions and how that BOI must be protected. To date, Financial Institutions have not been provided access to BOI information. On August 28, 2024, the FinCEN issued a final rule that will impose new anti-money laundering and countering terrorism financing (AML/CFT) program requirements on registered investment advisers and exempt reporting advisers (collectively, Covered IAs) by, among other things, including Covered IAs within the definition of “financial institution” under the BSA. The new AML/CFT rule takes effect on January 1, 2026. In addition, FinCEN proposed a Rule to Strengthen and Modernize Financial Institution Programs Designed to Fight Money Laundering and Terrorist Financing. Its purpose is to strengthen and modernize financial institutions’ anti-money laundering and countering the financing of terrorism (AML/CFT) programs. A final remaining rulemaking is expected to address required revisions to FinCEN’s Customer Due Diligence rule. Several other provisions of the AMLA require additional rulemakings, reports and other measures.
The Bank maintains two branches in New York that are licensed and supervised as full federal branches with fiduciary licenses by the Office of the Comptroller of the Currency (OCC), the U.S. supervisor of national banks. In general, the Bank’s branches may exercise the same rights and privileges, and are subject to the same restrictions, as would apply to a U.S. national bank at the same location(s). The Bank’s branches may accept wholesale deposits, but may not take U.S. domestic retail deposits outside of an available exemption. Deposits in the Bank’s branches are not insured by the Federal Deposit Insurance Corporation (FDIC). The Bank also maintains a limited federal branch in Jersey City, New Jersey which may exercise the same rights and privileges as the Bank’s New York federal branches except that it generally can only take deposits from non-U.S. sources.
The OCC examines and supervises the Bank’s U.S. branch offices’ activities and operations. In addition, the Bank’s U.S. branches are required to maintain a capital equivalency deposit in their state(s) of residence, which deposits are pledged to the OCC. Furthermore, the Bank’s U.S. branch offices are subject to supervisory guidance based on the examiners’ assessment of risk management, operational controls, compliance and asset quality.
The Bank also maintains a state-licensed agency in Texas and state-licensed representative offices in California, Delaware and Texas. In general, the activities conducted at the Bank’s agency include a broad range of banking powers, including lending and maintaining credit balances, but agencies are limited in their ability to accept deposits from citizens or residents of the U.S. Further limitations may be placed on such agencies’ activities based on state laws. The activities conducted at the representative offices are limited to representational and administrative functions; such representative offices do not have authority to make credit decisions and may not solicit (depending on state laws) or contract for any deposit or deposit-like liability. The agency and representative offices are examined and assessed by both the Federal Reserve and state regulators and are required to adhere to applicable federal and state regulations.
8
Banking activities are also conducted at CNB and RBC Bank (Georgia), National Association (RBC Bank), both of which are national banking associations chartered by the OCC. CNB and RBC Bank are members of the Federal Reserve. The OCC serves as the primary federal prudential regulator of CNB and RBC Bank. As U.S. banks, CNB and RBC Bank are allowed to take retail deposits, and they offer retail and commercial banking services, including deposit and credit services, such as consumer lending products (including credit card and mortgage loans), and business and commercial loans. CNB and RBC Bank are subject to capital requirements, dividend restrictions, limitations on investments and subsidiaries, limitations on transactions with affiliates (including the Bank and its branches), deposit reserve requirements and other requirements administered by the OCC and the Federal Reserve. Deposits at CNB and RBC Bank are FDIC-insured to the extent applicable. CNB and RBC Bank are also required to comply with applicable consumer protection laws and regulations such as those promulgated by the Consumer Financial Protection Bureau, an independent agency created under the Dodd-Frank Act. As an OCC chartered U.S. national bank, CNB also has fiduciary powers and offers trust and investment management services.
CNB also conducts trust and investment management activities through CNB’s wholly-owned subsidiary, RBC Trust Company (Delaware) Limited (RBC Trust). RBC Trust is a Delaware trust company chartered and supervised by the Delaware State Bank Commissioner and, as a BHC subsidiary, is subject to oversight by the Federal Reserve. RBC Trust is subject to dividend restrictions, limitations on investments and other applicable state banking law requirements.
Broker-Dealer Activities and Broker-Dealer Subsidiaries
The securities brokerage, trading and investment banking activities are conducted by and through the following U.S.-registered broker-dealer subsidiaries:
| • | RBC Capital Markets, LLC (RBC CM LLC); |
| • | RBC CMA LTD.; |
| • | City National Securities, Inc.; and |
| • | CNR Securities, LLC. |
The SEC, state securities regulators, the Financial Industry Regulatory Authority and other self-regulatory organizations regulate these broker-dealer subsidiaries. Certain activities of RBC CM LLC and RBC CMA LTD. are also subject to regulation by the CFTC and the NFA. Pursuant to the Dodd-Frank Act, RBC CM LLC is registered as a “Swaps Firm” with the NFA. Certain activities of RBC CM LLC are subject to regulation by the Municipal Securities Rulemaking Board.
Investment Management and Other Fiduciary Activities
The Bank’s New York branches have fiduciary powers, under which these branches conduct investment management and custody activities for certain customers. In addition, other affiliates are involved in the business of investment management. In many cases, these activities require that the affiliates be registered with the SEC as investment advisers under the U.S. Investment Advisers Act of 1940, as amended (Advisers Act). The Advisers Act and related rules regulate the registration and activities of investment advisers. Although the regulatory regime for investment advisers is similar in some ways to that for broker-dealers, the standard of conduct is higher due to the advisers’ status as fiduciaries.
9
The following entities are the Bank’s subsidiaries that are registered as “investment advisers” with the SEC:
| • | RBC CM LLC; |
| • | RBC Global Asset Management (U.S.) Inc. (GAM US); |
| • | RBC Global Asset Management (UK) Limited (GAM UK); |
| • | RBC Private Counsel (USA) Inc.; |
| • | City National Rochdale, LLC (CNR); and |
| • | City National Securities, Inc. |
GAM US and CNR also each sponsor and act as the adviser to U.S. mutual funds. The U.S. Investment Company Act of 1940, as amended, and related rules regulate the registration and operation of mutual funds and certain activities of the funds’ advisers and other affiliates and certain of the funds’ other service providers. Certain activities of GAM UK and GAM US are also subject to regulation by the CFTC and the NFA.
ERISA and the Internal Revenue Code
The U.S. Employee Retirement Income Security Act of 1974, as amended (ERISA), and its related rules regulate, among other things, the activities of the financial services industry with respect to pension plan clients. Similarly, the U.S. Internal Revenue Code of 1986, as amended, and the regulations implemented thereunder impose requirements with respect to such clients and also individual retirement accounts (IRAs). Brokers, dealers and investment advisers to pension plans and IRAs must conduct their business in compliance with both ERISA and applicable tax regulations.
Risk Factors
A discussion of risks affecting us and our businesses appears under the headings “Risk management”, “Principal risks” and “Overview of other risks” from pages 65-110 of our 2025 Management’s Discussion and Analysis, which discussions are incorporated by reference herein.
Environmental and Social Policies
The Bank’s sustainability reporting outlines how we approach sustainability ambitions and other sustainability matters. Information about our sustainability reporting is available on the Bank’s website at rbc.com/sustainability-reporting. Additional information about our environmental and social risk policies can be found under “Overview of other risks – Environmental and social risk” beginning on page 109 of our 2025 Management’s Discussion and Analysis, which section is incorporated by reference herein.
DESCRIPTION OF CAPITAL STRUCTURE
General Description
The Bank’s authorized share capital consists of an unlimited number of common shares without nominal or par value; an unlimited number of first preferred shares without nominal or par value, provided that the first preferred shares outstanding at any time shall have been issued for a maximum aggregate consideration of $30 billion; and an unlimited number of second preferred shares, without nominal or par value, which may be issued for a maximum aggregation consideration of $5 billion.
The Bank may also issue an unlimited amount of Limited Resource Capital Notes (LRCNs), which are compound instruments with both equity and liability features. The following summary of share capital and LRCNs is qualified in its entirety by the Bank’s by-laws and the actual terms and conditions of such shares and LRCNs.
10
Common Shares
The holders of the Bank’s common shares are entitled to vote at all meetings of shareholders, except meetings at which only holders of a specified class, other than common shares, or series of shares are entitled to vote. The holders of common shares are entitled to receive dividends as and when declared by the board of directors, subject to the preference of the preferred shares. After payment to the holders of the preferred shares of the amount or amounts to which they may be entitled, and after payment of all outstanding debts, the holders of the common shares will be entitled to receive any remaining property upon liquidation, dissolution or winding-up.
Preferred Shares
First preferred shares may be issued, from time to time, in one or more series with such rights, privileges, restrictions and conditions as the board of directors may determine, subject to the Bank Act and to the Bank’s by-laws. The first preferred shares are entitled to preference over any second preferred shares (discussed below) and common shares and over any other shares ranking junior to the first preferred shares with respect to the payment of dividends and in the distribution of property in the event of liquidation, dissolution or winding-up.
As at December 2, 2025, Non-Cumulative First Preferred Shares Series BH, BI, BO, BR, BS, BT, BU, BV, BW, BX, BY and BZ are outstanding. The Non-Cumulative First Preferred Shares Series BH, BI and BO are listed on the Toronto Stock Exchange. The Non-Cumulative First Preferred Shares Series BR, BS, BT, BU, BV, BW, BX, BY and BZ are not listed on an exchange. On May 24, 2025, we redeemed all of our issued and outstanding Non-Cumulative 5-Year Rate Reset First Preferred Shares Series BD. On October 24, 2025, we redeemed all of our issued and outstanding Non-Cumulative 5-Year Fixed Rate Reset First Preferred Shares Series BQ (Series BQ Shares). As a result of the redemption of the Series BQ Shares, all of our outstanding LRCN Series 1 due November 24, 2080 were automatically redeemed on the same date. On November 24, 2025, we redeemed all of our issued and outstanding Non-Cumulative 5-Year Rate Reset First Preferred Shares Series BF.
Effective January 1, 2013, in accordance with capital adequacy requirements adopted by OSFI, non-common capital instruments issued after January 1, 2013, including first preferred shares, must include terms providing for the full and permanent conversion of such securities into common shares upon the occurrence of certain trigger events relating to financial viability (the Non-Viability Contingent Capital requirements) in order to qualify as regulatory capital. All outstanding capital instruments that do not meet the Non-Viability Contingent Capital requirements are considered non-qualifying capital instruments and have been phased out. The Non-Cumulative First Preferred Shares Series BH, BI, BO, BR, BS, BT, BU, BV, BW BX, BY and BZ contain non-viability contingent capital provisions necessary to qualify as Tier 1 regulatory capital under Basel III and are therefore convertible into common shares upon the occurrence of a non-viability contingent capital trigger event.
We are prohibited by the Bank Act from declaring or paying any dividends on our preferred or common shares when we are, or would be placed as a result of the declaration, in contravention of the capital adequacy and liquidity regulations or any regulatory directives issued under the Bank Act. We may not pay dividends on our common shares or redeem, purchase or otherwise retire common shares or preferred shares at any time without the approval of the holders of outstanding first preferred shares unless all dividends to which first preferred shareholders are then entitled have been declared and paid or set apart for payment.
The Non-Cumulative First Preferred Shares Series BT, BU and BW were respectively issued on November 5, 2021, January 25, 2024 and July 24, 2024 to certain institutional investors.
The Non-Cumulative First Preferred Shares Series BR, BS, BV, BX, BY and BZ (the LRCN Preferred Shares) were respectively issued on November 2, 2020, June 8, 2021, April 24, 2024, November 1, 2024, June 11, 2025 and September 23, 2025 in connection with the Bank’s concurrent issuances of LRCNs. The LRCN Preferred Shares are held by Computershare Trust Company of Canada as trustee (the Trustee) for Leo LRCN Limited Recourse Trust® (the Limited Recourse Trust). In certain circumstances, including non-payment of interest on, principal of or redemption price for the LRCNs when due, or the occurrence of an event of default or a non-viability contingent capital trigger event, the Trustee of the Limited Recourse Trust will deliver to holders of LRCNs their proportionate share of the Limited Recourse Trust’s assets, which will consist of the LRCN Preferred Shares except in limited circumstances, in full satisfaction of the Bank’s obligations under the LRCNs.
11
For so long as the LRCN Preferred Shares are held by the Trustee on behalf of the Limited Recourse Trust, such shares will not be entitled to receive dividends.
Second preferred shares may be issued, from time to time, in one or more series with such rights, privileges, restrictions and conditions as the board of directors may determine, subject to the Bank Act and to the Bank’s by-laws. There are no second preferred shares currently outstanding. Second preferred shares would rank junior to the first preferred shares. Second preferred shares would be entitled to preference over the common shares and over any other shares ranking junior to the second preferred shares with respect to the payment of dividends and in the distribution of property in the event of our liquidation, dissolution or winding-up.
Holders of the first and second preferred shares are not entitled to any voting rights as a class except as provided under the Bank Act or the Bank’s by-laws. Under the Bank Act, the Bank may not create any other class of shares ranking equal with or superior to a particular class of preferred shares, increase the authorized number of, or amend the rights, privileges, restrictions or conditions attaching to such class of preferred shares, without the approval of the holders of that class of preferred shares.
Any approval to be given by the holders of the first and second preferred shares may be given in writing by the holders of not less than all of the outstanding preferred shares of each class or by a resolution carried by the affirmative vote of not less than 662⁄3 per cent of the votes cast at a meeting of holders of each class of preferred shares at which a quorum is represented. A quorum at any meeting of holders of each class of preferred shares is 51 per cent of the shares entitled to vote at such meeting, except that at an adjourned meeting there is no quorum requirement.
Limited Recourse Capital Notes
LRCNs are the Bank’s direct unsecured obligations constituting subordinated indebtedness for the purpose of the Bank Act and are intended to qualify as our additional Tier 1 capital within the meaning of the regulatory capital adequacy requirements to which we are subject. The LRCNs are not deposits insured under the Canada Deposit Insurance Corporation Act or any other deposit insurance regime designed to ensure the payment of all or a portion of a deposit upon the insolvency of a deposit taking institution.
In the event of a non-payment by the Bank of the principal amount of, interest on or redemption price for the LRCNs when due, the sole remedy of holders of LRCNs shall be the delivery of the LRCN Preferred Shares held by the Trustee for the Limited Recourse Trust.
If the Bank becomes insolvent or is wound-up, the LRCNs will rank (i) subordinate in right of payment to the prior payment in full of all outstanding deposit liabilities of the Bank including certain subordinated indebtedness (within the meaning of the Bank Act); and (ii) in right of payment equally with and not prior to the Bank’s indebtedness which by its terms ranks equally in right of payment with, or is subordinate to, the LRCNs (other than the Bank’s indebtedness which by its terms ranks subordinate to the LRCNs) and will be subordinate in right of payment to the claims of our depositors and other unsubordinated creditors, provided that in any such case and in case of the Bank’s non-payment of the principal amount of, interest on or redemption price for the LRCNs when due, the sole remedy of the holders of the LRCNs shall be the delivery of the LRCN Preferred Shares held by the Trustee for the Limited Recourse Trust.
Holders of LRCNs are not entitled to any voting rights, other than in certain limited circumstances.
Additional information about the Bank’s share capital can be found under “Capital management” beginning on page 110 of our 2025 Management’s Discussion and Analysis and in Note 19 “Equity” beginning on page 220 of our 2025 Annual Consolidated Financial Statements, which section and note are incorporated by reference herein.
12
Prior Sales
From time to time, the Bank issues principal at risk notes, securities for which the amount payable at maturity is determined by reference to the price, value or level of an underlying interest such as a stock index, an exchange traded fund or a notional portfolio of equities or other securities. In addition, the Bank periodically issues subordinated debt, preferred shares and other equity instruments which are not listed or quoted on a marketplace.
For information about the Bank’s issuances of subordinated debentures, Limited Recourse Capital Notes and other equity instruments since October 31, 2024, see the “Capital management” section beginning on page 110 of our 2025 Management’s Discussion and Analysis, Note 18 “Subordinated debentures” beginning on page 219 and Note 19 “Equity” beginning on page 220 of our 2025 Annual Consolidated Financial Statements, which section and notes are incorporated by reference herein.
Constraints
The Bank Act contains restrictions on the issue, transfer, acquisition, beneficial ownership and voting of shares of a chartered bank. The following is a summary of several key restrictions.
No person may be a major shareholder of a bank having equity of $12 billion or more (which includes the Bank). A person is a major shareholder if:
| (a) | the aggregate of the shares of any class of voting shares of the Bank beneficially owned by that person, by entities controlled by that person and by any person associated or acting jointly or in concert with that person is more than 20 per cent of the outstanding shares of that class of voting shares, or |
| (b) | the aggregate of shares of any class of non-voting shares of the Bank beneficially owned by that person, by entities controlled by that person and by any person associated or acting jointly or in concert with that person is more than 30 per cent of the outstanding share of that class of non-voting shares. |
Additionally, no person may have a significant interest in any class of shares of a bank (including the Bank) unless the person first receives the approval of the Minister. For purposes of the Bank Act, a person has a significant interest in a class of shares of a bank where the aggregate of any shares of the class beneficially owned by that person, by entities controlled by that person and by any person associated or acting jointly or in concert with that person exceeds 10 per cent of all of the outstanding shares of that class of shares of such bank.
The Bank Act also prohibits a bank from purchasing or redeeming any of its shares or paying any dividends if there are reasonable grounds for believing the bank is, or the payment would cause the bank to be, in contravention of the Bank Act requirement to maintain, in relation to its operations, adequate capital and appropriate forms of liquidity and to comply with any regulations or directions of the Superintendent in relation thereto. Under the Bank Act, the Bank cannot redeem or purchase any shares for cancellation unless the prior consent of the Superintendent has been obtained.
Subject to certain exceptions, the Bank Act also prohibits the registration of a transfer or issue of any shares of a Canadian bank to any government or government agency of Canada or any province of Canada, or to any government of any foreign country, or any political subdivision, or agency of any foreign country.
13
Ratings
Our ability to access unsecured funding markets and to engage in certain collateralized business activities on a cost-effective basis is primarily dependent upon maintaining competitive credit ratings. Credit ratings and outlooks provided by rating agencies reflect their views and methodologies. Our credit ratings are largely determined by the rating agencies’ assessment of the quality of our earnings, the adequacy of our capital and the effectiveness of our risk management programs. Ratings are subject to change, based on a number of factors including, but not limited to, our financial strength, competitive position, liquidity and other factors not completely within our control. There can be no assurance that our credit ratings and rating outlooks will not be lowered or that rating agencies will not issue adverse commentaries about us, potentially resulting in adverse consequences for our funding capacity or access to capital markets.
A lowering of our credit ratings may also affect our ability, and the cost, to enter into normal course derivative or hedging transactions and may require us to post additional collateral under certain contracts. However, we estimate, based on periodic reviews of ratings triggers embedded in our existing businesses and of our funding capacity sensitivity, that a minor downgrade would not materially influence our liability composition, funding access, collateral usage and associated costs.
As at December 2, 2025, RBC had the following ratings from the rating agencies listed below:
| RATING CLASS* | RATING | RANK** | ||||
| Moody’s Investors Service, Inc. ǂ |
Legacy Senior Long-term Debt1 | Aa1 |
2 of 21 | |||
| Senior Long-term Debt2 | A1 |
5 of 21 | ||||
| Short-term Debt | P-1 |
1 of 4 | ||||
| Subordinated Debt | A3 |
7 of 21 | ||||
| NVCC Subordinated Debt | A3 (hyb) |
7 of 21 | ||||
| NVCC Preferred Shares | Baa2 (hyb) |
9 of 21 | ||||
| NVCC Limited Recourse Capital Notes | Baa2 (hyb) |
9 of 21 | ||||
| Outlook – Stable | ||||||
| S&P Global Ratings ǂ |
Legacy Senior Long-term Debt1 | AA- |
4 of 22 | |||
| Senior Long-term Debt2 | A |
6 of 22 | ||||
| Short-term Debt | A-1+ |
1 of 7 | ||||
| Subordinated Debt | A |
6 of 22 | ||||
| NVCC Subordinated Debt | A- |
7 of 22 | ||||
| NVCC Preferred Shares | BBB |
9 of 22 | ||||
| NVCC Limited Recourse Capital Notes | BBB |
9 of 22 | ||||
| Outlook – Stable | ||||||
| Fitch Ratings ǂ |
Legacy Senior Long-term Debt1 | AA |
3 of 23 | |||
| Senior Long-term Debt2 | AA- |
4 of 23 | ||||
| Short-term Debt | F1+ |
1 of 8 | ||||
| Subordinated Debt | A |
6 of 23 | ||||
| NVCC Subordinated Debt | A |
6 of 23 | ||||
| NVCC Preferred Shares | BBB+ |
8 of 23 | ||||
| NVCC Limited Recourse Capital Notes | BBB+ |
8 of 23 | ||||
| Outlook – Stable | ||||||
| Morningstar DBRS ǂ |
Legacy Senior Long-term Debt1 | AA (high) |
2 of 22 | |||
| Senior Long-term Debt2 | AA |
3 of 22 | ||||
| Short-term Debt | R-1 (high) |
1 of 10 | ||||
| Subordinated Debt | AA (low) |
4 of 22 | ||||
| NVCC Subordinated Debt | A |
6 of 22 | ||||
| NVCC Preferred Shares | Pfd-2 (high) |
4 of 16 | ||||
| NVCC Limited Recourse Capital Notes | A (low) |
7 of 22 | ||||
| Outlook – Stable |
| * | Our rating classes may differ from the rating category nomenclatures used by the rating agencies. |
| ** | Relative rank of each rating within the organization’s overall classification system. |
| 1 | Includes senior long-term debt issued prior to September 23, 2018 and senior long-term debt issued on or after September 23, 2018, which is excluded from the Bail-in Regime. |
| 2 | Includes senior long-term debt issued on or after September 23, 2018, which is subject to conversion under the Bail-in Regime. |
A definition of the categories of each rating as at December 2, 2025 has been obtained from the respective rating agency’s website and is outlined in Appendix B, and a more detailed explanation may be obtained from the applicable rating agency.
On June 3, 2025, Fitch Ratings affirmed our ratings with a stable outlook.
On May 9, 2025, Morningstar DBRS affirmed our ratings with a stable outlook.
14
On June 25, 2024, S&P Global Ratings affirmed our ratings with a stable outlook.
On October 9, 2025, Moody’s announced completion of a periodic review of our ratings. There were no changes to our ratings.
Credit ratings, including stability or provisional ratings (collectively, Ratings) are not recommendations to purchase, sell or hold a financial obligation inasmuch as they do not comment on market price or suitability for a particular investor. Ratings may not reflect the potential impact of all risks on the value of securities. In addition, real or anticipated changes in the rating assigned to a security will generally affect the market value of that security. Ratings are determined by the rating agencies based on criteria established from time to time by them and are subject to revision or withdrawal at any time by the rating organization. Each Rating listed in the table above should be evaluated independently of any other Rating applicable to our debt and preferred shares. As is customary, RBC pays rating agencies to assign Ratings for the parent company as well as our subsidiaries, and for certain other services.
Additional information about Ratings is provided under “Principal risks – Liquidity and funding risk – Credit ratings” on page 95 of our 2025 Management’s Discussion and Analysis, which section is incorporated by reference herein.
MARKET FOR SECURITIES
Trading Price and Volume
The Bank’s common shares are listed on the Toronto Stock Exchange (TSX) in Canada and the New York Stock Exchange (NYSE) in the U.S. The Bank’s Non-Cumulative First Preferred Shares Series BH, BI and BO are currently listed on the TSX, and the Bank’s Non-Cumulative First Preferred Shares Series BD and BF were listed on the TSX prior to being redeemed on May 24, 2025 and November 24, 2025, respectively.
The following table sets out the price range and trading volumes of the common shares on the TSX and the NYSE for the periods indicated. Prices are based on the reported amounts from Stockwatch.
| Common Shares (TSX) | Common Shares (NYSE) | |||||||||||||||||||||||
| Month | High ($) | Low ($) | Volume (Millions) | High (US$) | Low (US$) | Volume | ||||||||||||||||||
|
November 2024 |
176.27 | 168.38 | 74.02 | 125.82 | 120.26 | 23,441,369 | ||||||||||||||||||
|
December 2024 |
180.45 | 170.79 | 64.06 | 128.05 | 118.73 | 16,626,737 | ||||||||||||||||||
|
January 2025 |
179.30 | 169.07 | 116.74 | 124.35 | 117.63 | 26,055,542 | ||||||||||||||||||
|
February 2025 |
175.00 | 164.06 | 70.84 | 121.43 | 113.73 | 23,690,766 | ||||||||||||||||||
|
March 2025 |
172.13 | 156.93 | 74.31 | 119.46 | 108.76 | 22,038,954 | ||||||||||||||||||
|
April 2025 |
165.93 | 151.25 | 156.07 | 120.11 | 106.10 | 37,510,132 | ||||||||||||||||||
|
May 2025 |
179.06 | 164.82 | 90.95 | 129.46 | 119.50 | 27,520,236 | ||||||||||||||||||
|
June 2025 |
179.49 | 172.98 | 56.16 | 131.69 | 126.02 | 17,803,412 | ||||||||||||||||||
|
July 2025 |
183.11 | 177.48 | 102.59 | 134.26 | 128.14 | 27,324,964 | ||||||||||||||||||
|
August 2025 |
204.60 | 175.50 | 65.62 | 147.64 | 127.38 | 23,968,203 | ||||||||||||||||||
|
September 2025 |
206.90 | 197.58 | 53.33 | 149.26 | 143.20 | 17,663,012 | ||||||||||||||||||
|
October 2025 |
208.34 | 200.82 | 90.47 | 149.44 | 143.13 | 26,550,925 | ||||||||||||||||||
15
The following tables provide the price range and trading volumes of the first preferred shares on the TSX for the periods indicated. Prices are based on the reported amounts from Stockwatch.
| Series BD3 | Series BF4 | Series BH | ||||||||||||||||||||||||||||||||||
| Month | High ($) | Low ($) | Volume | High ($) | Low ($) | Volume | High ($) | Low ($) | Volume | |||||||||||||||||||||||||||
|
November 2024 |
24.73 | 24.30 | 92,314 | 24.47 | 24.00 | 40,134 | 24.42 | 24.00 | 57,987 | |||||||||||||||||||||||||||
|
December 2024 |
24.90 | 24.37 | 137,515 | 24.64 | 24.10 | 52,431 | 24.84 | 24.25 | 48,652 | |||||||||||||||||||||||||||
|
January 2025 |
25.66 | 24.69 | 323,674 | 24.66 | 24.43 | 232,702 | 24.99 | 24.25 | 46,929 | |||||||||||||||||||||||||||
|
February 2025 |
24.85 | 24.51 | 347,976 | 24.60 | 24.33 | 152,342 | 24.75 | 24.36 | 40,450 | |||||||||||||||||||||||||||
|
March 2025 |
24.90 | 24.72 | 422,490 | 24.59 | 24.38 | 471,476 | 24.88 | 24.56 | 38,840 | |||||||||||||||||||||||||||
|
April 2025 |
25.13 | 24.00 | 2,302,846 | 24.65 | 23.77 | 133,688 | 24.75 | 23.80 | 96,484 | |||||||||||||||||||||||||||
|
May 2025 |
25.00 | 24.95 | 4,035,507 | 24.77 | 24.50 | 219,700 | 24.65 | 24.27 | 148,948 | |||||||||||||||||||||||||||
|
June 2025 |
-- | -- | -- | 25.00 | 24.70 | 345,198 | 25.00 | 24.56 | 57,437 | |||||||||||||||||||||||||||
|
July 2025 |
-- | -- | -- | 25.22 | 24.62 | 333,109 | 25.27 | 24.88 | 111,421 | |||||||||||||||||||||||||||
|
August 2025 |
-- | -- | -- | 24.98 | 24.86 | 1,021,194 | 25.15 | 24.91 | 117,471 | |||||||||||||||||||||||||||
|
September 2025 |
-- | -- | -- | 25.10 | 24.93 | 527,543 | 25.28 | 25.03 | 76,850 | |||||||||||||||||||||||||||
|
October 2025 |
-- | -- | -- | 25.14 | 24.95 | 1,391,094 | 25.30 | 24.96 | 36,642 | |||||||||||||||||||||||||||
3 On May 24, 2025, we redeemed all of our issued and outstanding Non-Cumulative 5-Year Rate Reset First Preferred Shares Series BD (Series BD).
4 On November 24, 2025, we redeemed all of our issued and outstanding Non-Cumulative 5-Year Rate First Preferred Shares Series BF (Series BF).
16
| Series BI | Series BO | |||||||||||||||||||||||
| Month | High ($) | Low ($) | Volume | High ($) | Low ($) | Volume | ||||||||||||||||||
|
November 2024 |
24.40 | 23.89 | 28,748 | 26.05 | 25.30 | 182,153 | ||||||||||||||||||
|
December 2024 |
24.91 | 24.21 | 41,371 | 25.85 | 25.41 | 93,502 | ||||||||||||||||||
|
January 2025 |
24.80 | 24.27 | 116,354 | 25.75 | 25.15 | 316,842 | ||||||||||||||||||
|
February 2025 |
24.75 | 24.41 | 38,657 | 26.05 | 25.47 | 352,206 | ||||||||||||||||||
|
March 2025 |
24.87 | 24.47 | 85,036 | 25.75 | 25.34 | 66,812 | ||||||||||||||||||
|
April 2025 |
24.69 | 23.75 | 78,096 | 25.85 | 24.61 | 151,829 | ||||||||||||||||||
|
May 2025 |
24.65 | 24.22 | 77,339 | 26.00 | 25.54 | 70,193 | ||||||||||||||||||
|
June 2025 |
24.98 | 24.55 | 113,113 | 26.00 | 25.66 | 105,881 | ||||||||||||||||||
|
July 2025 |
25.30 | 24.76 | 94,530 | 26.55 | 25.73 | 150,958 | ||||||||||||||||||
|
August 2025 |
25.18 | 24.90 | 20,031 | 26.50 | 26.12 | 211,827 | ||||||||||||||||||
|
September 2025 |
25.30 | 25.00 | 48,757 | 26.49 | 26.08 | 169,576 | ||||||||||||||||||
|
October 2025 |
25.39 | 24.96 | 55,371 | 26.65 | 26.10 | 88,105 | ||||||||||||||||||
DIVIDENDS
The Bank has had an uninterrupted history of paying dividends on its common shares and on each of its outstanding series of first preferred shares. Information about the Bank’s dividends paid or payable per share on the common shares and each outstanding series of first preferred shares in each of the two most recently completed years appears under the heading “Selected capital management activity” in the “Capital management” section beginning on page 117 of our 2025 Management’s Discussion and Analysis, which section is incorporated by reference herein. Information about restrictions on the payment of dividends appears under the heading “Restrictions on the payment of dividends” in Note 19 “Equity” beginning on page 220 of our 2025 Annual Consolidated Financial Statements, which note is incorporated by reference herein.
The declaration amount and payment of future dividends will be subject to the discretion of the Bank’s board of directors, and will be dependent upon the Bank’s results of operations, financial condition, cash requirements and future regulatory restrictions on the payment of dividends and other factors deemed relevant by the board of directors.
Information about our dividends and our dividend payout ratio (common share dividends as a percentage of net income less preferred share dividends) is provided under the heading “Selected capital management activity” in the “Capital management” section beginning on page 117 of our 2025 Management’s Discussion and Analysis and in Note 19 “Equity” beginning on page 220 of our 2025 Annual Consolidated Financial Statements, which section and note are incorporated by reference herein.
SECURITIES SUBJECT TO CONTRACTUAL RESTRICTION ON TRANSFER
In connection with each issuance of LRCNs, the Bank also concurrently issues first preferred shares. These LRCN Preferred Shares are held in the Limited Recourse Trust. Pursuant to the Amended and Restated Declaration of Trust for the Limited Recourse Trust and the share provisions for the LRCN Preferred Shares, the Trustee of the Limited Recourse Trust will only deliver the LRCN Preferred Shares to holders of LRCNs
17
under certain prescribed circumstances further described herein under Description of Capital Structure – Preferred Shares” and “Description of Capital Structure – Limited Recourse Capital Notes”.
Securities Subject to Contractual Restriction on Transfer as at December 2, 2025
|
Designation of Class |
Number of Securities that are Subject to a Contractual Restriction on Transfer |
Percentage of Class | ||
| First Preferred Shares | 1,250,000 Non-Cumulative First Preferred Shares Series BR
1,000,000 Non-Cumulative First Preferred Shares Series BS
1,000,000 Non-Cumulative First Preferred Shares Series BV
1,000,000 Non-Cumulative First Preferred Shares Series BX
1,250,000 Non-Cumulative First Preferred Shares Series BY
1,350,000 Non-Cumulative First Preferred Shares Series BZ |
19.6% | ||
DIRECTORS AND EXECUTIVE OFFICERS
Directors
The following are the Bank’s directors as at December 2, 2025:
| Name and Year Elected | Province/State and Country of Residence |
Occupation | ||
| Mirko Bibic (2022) | Ontario, CAN | President and Chief Executive Officer, BCE Inc. and Bell Canada | ||
| Andrew A. Chisholm (2016) | Ontario, CAN | Corporate Director | ||
| Jacynthe Côté (2014) | Quebec, CAN | Chair of the Board, Royal Bank of Canada | ||
| Toos N. Daruvala (2015) | New York, U.S. | Corporate Director | ||
| Cynthia Devine (2020) | Ontario, CAN | Corporate Director | ||
| Roberta L. Jamieson (2021) | Ontario, CAN | Corporate Director | ||
| David I. McKay (2014) | Ontario, CAN | President and Chief Executive Officer, Royal Bank of Canada | ||
| Amanda Norton (2024) | North Carolina, U.S. | Corporate Director | ||
18
| Name and Year Elected | Province/State and Country of Residence |
Occupation | ||
| Barry Perry (2023) | Newfoundland and Labrador, CAN | Corporate Director | ||
| Maryann Turcke (2020) | Ontario, CAN | Corporate Director | ||
| Thierry Vandal (2015) | New York, U.S. | President, Axium Infrastructure US Inc. | ||
| Frank Vettese (2019) | Ontario, CAN | Co-Founder, SummitNorth Advisory Corp. | ||
| Jeffery Yabuki (2017) | Wisconsin, U.S. | Chairman & Chief Executive Officer, InvestCloud Inc. Chairman, Sportradar Holding AG Chairman, Motive Partners GP, LLC | ||
Directors are elected annually and hold office until the next annual meeting of shareholders. Since November 1, 2020, the directors have held the principal occupations described above, except for the following:
Mr. Mirko Bibic served in a variety of leadership positions since joining BCE Inc. in 2004, including Chief Operating Officer from 2018 through 2020.
Mr. Toos N. Daruvala was Co-Chief Executive Officer, MIO Partners, Inc. from November 2016 through March 2021.
Ms. Cynthia Devine retired from her position as President and Chief Executive Officer of Maple Leaf Sports & Entertainment (MLSE) in April 2024 and was advisor to the board of MLSE until June 2024. She was Chief Financial Officer of MLSE from 2017 through 2022.
Ms. Roberta L. Jamieson was President and Chief Executive Officer of Indspire (a Canadian Indigenous charity that invests in the education of First Nations, Inuit and Métis people) from November 2004 through December 2020.
Ms. Amanda Norton was Chief Risk Officer at Wells Fargo from 2018 to 2022.
Mr. Barry Perry was President and Chief Executive Officer of Fortis Inc. from 2015 through 2020.
Ms. Maryann Turcke was Senior Advisor, Brookfield Infrastructure Partners L.P. from September 2020 through September 2022 and Senior Advisor, National Football League from September 2020 through 2021.
Mr. Jeffery Yabuki was Executive Chairman, Fiserv, Inc. from June through December 2020. He became Chairman and Chief Executive Officer of InvestCloud, Inc. in January 2024.
Committees of the Board
Audit Committee: Cynthia Devine (Chair), T.N. Daruvala, B. Perry, M. Turcke and F. Vettese.
Risk Committee: A.A. Chisholm (Chair), M. Bibic, R.L. Jamieson, A. Norton, T. Vandal and J. Yabuki.
Governance Committee: M. Turcke (Chair), M. Bibic, A.A. Chisholm, C. Devine and R.L. Jamieson.
Human Resources Committee: T. Vandal (Chair), T.N. Daruvala, A. Norton, B. Perry, F. Vettese and J. Yabuki.
19
Executive Officers
The following are the Bank’s executive officers as at December 2, 2025:
| Name | Province/State and Country of Residence |
Title | ||
| Sean Amato-Gauci | Ontario, CAN | Group Head, RBC Commercial Banking | ||
| Kelly Bradley | Ontario, CAN | Chief Human Resources Officer | ||
| Maria Douvas | New York, U.S. | Chief Legal and Administrative Officer | ||
| Katherine Gibson | Ontario, CAN | Chief Financial Officer | ||
| Graeme Hepworth | Ontario, CAN | Chief Risk Officer | ||
| David I. McKay | Ontario, CAN | President & Chief Executive Officer | ||
| Neil McLaughlin | Ontario, CAN | Group Head, RBC Wealth Management | ||
| Derek Neldner | Ontario, CAN | CEO and Group Head, RBC Capital Markets | ||
| Erica Nielsen | Ontario, CAN | Group Head, RBC Personal Banking | ||
| Jennifer Publicover | Ontario, CAN | Group Head, RBC Insurance | ||
| Bruce Ross | Ontario, CAN | Group Head, Technology and Operations | ||
Since November 1, 2020, the executive officers have held the positions described below:
Mr. Sean Amato-Gauci was appointed to Group Executive in his role as Group Head, RBC Commercial Banking effective September 1, 2024. Prior to his current role, Mr. Amato-Gauci was Executive Vice President & Head, Business Financial Services since November 2022 and Executive Vice President of Cards, Payments & Banking since August 2017.
Ms. Kelly Bradley was appointed to Group Executive in her role as Chief Human Resources Officer effective June 1, 2022. Prior to her current role, Ms. Bradley was Senior Vice President, Talent Strategy and Solutions since June 2020.
Ms. Maria Douvas was appointed Chief Legal and Administrative Officer effective March 20, 2024. Prior to her current role, Ms. Douvas was appointed to Group Executive in her role as Chief Legal Officer effective September 2021. She was Executive Vice President and General Counsel since February 2021 and Senior Vice President, U.S. General Counsel and Global Head of Litigation since September 2018.
Ms. Katherine Gibson was appointed to Group Executive in her role as Chief Financial Officer effective September 1, 2024. Prior to her current role, Ms. Gibson was Interim Chief Financial Officer since April 2024 and Senior Vice President, Enterprise Finance & Controller since September 2016.
Mr. Graeme Hepworth was appointed to Group Executive in his role as Chief Risk Officer effective April 9, 2018.
Mr. David I. McKay was appointed President effective in February 2014 and Chief Executive Officer effective in August 2014.
Mr. Neil McLaughlin was appointed Group Head, RBC Wealth Management effective September 1, 2024. Prior to his current role, Mr. McLaughlin was appointed to Group Executive in his role as Group Head, Personal & Commercial Banking effective May 2017 (also assuming responsibility for RBC Ventures in September 2021).
20
Mr. Derek Neldner was appointed to Group Executive in his role as Group Head and CEO, Capital Markets effective November 1, 2019.
Ms. Erica Nielsen was appointed to Group Executive in her role as Group Head, RBC Personal Banking effective September 1, 2024. Prior to her current role, Ms. Nielsen was Executive Vice President, Personal Financing Products since September 2023, Executive Vice President, Personal Banking and Investments since November 2022, Senior Vice President, Personal Savings and Investments since October 2021 and Senior Vice President, Everyday Banking and Client Growth since January 2020.
Ms. Jennifer Publicover was appointed to Group Executive in her role as Group Head, RBC Insurance effective September 1, 2024. Prior to her current role, Ms. Publicover was Executive Vice President and Chief Executive Officer, RBC Insurance since January 2023 and Senior Vice President, Wealth Management Products and Strategy since November 2019.
Mr. Bruce Ross was appointed to Group Executive in his role as Group Head, Technology and Operations effective in January 2014.
Ownership of Securities
To our knowledge, as at October 31, 2025, the directors and executive officers, as a group, beneficially own or exercise control or direction over less than one per cent (1%) of our common and preferred shares. None of our directors or executive officers holds shares of our subsidiaries except where required for qualification as a director of a subsidiary.
Cease Trade Orders, Bankruptcies, Penalties or Sanctions
To the best of our knowledge, no director or executive officer,
| (a) | is, as at December 2, 2025 or has been, within the 10 years before, a director, chief executive officer or chief financial officer of any company (including our company), that while that person was acting in that capacity, |
| (i) | was the subject of a cease trade or similar order or an order that denied the relevant company access to any exemption under Canadian securities legislation,5 for a period of more than 30 consecutive days, or |
| (ii) | was subject to an event that resulted, after the director or executive officer ceased to be a director, chief executive officer or chief financial officer, in the company being the subject of a cease trade or similar order or an order that denied the relevant company access to any exemption under Canadian securities legislation,5 for a period of more than 30 consecutive days, or |
| (b) | is, as at December 2, 2025 or has been, within the 10 years before, a director or executive officer of any company (including our company), that while that person was acting in that capacity or within a year of that person ceasing to act in that capacity, became bankrupt, made a proposal under any legislation relating to bankruptcy or insolvency or was subject to or instituted any proceedings, arrangement or compromise with creditors or had a receiver, receiver manager or trustee appointed to hold its assets, or |
5 National Instrument 14-101 restricts the meaning of “securities legislation” to Canadian provincial and territorial legislation and “securities regulatory authority” to Canadian provincial and territorial securities regulatory authorities.
21
| (c) | has, within the 10 years before December 2, 2025, become bankrupt, made a proposal under any legislation relating to bankruptcy or insolvency, or become subject to or instituted any proceedings, arrangement or compromise with creditors, or had a receiver, receiver manager or trustee appointed to hold the assets of the director or executive officer, |
Except for the following:
| Ms. Turcke is a director of Diamond Sports Group, LLC, which filed for Chapter 11 protection in the U.S. Bankruptcy Court for the Southern District of Texas on March 14, 2023. |
To the best of our knowledge, none of our directors or executive officers have been subject to (a) any penalties or sanctions imposed by a court relating to Canadian securities legislation6 or by a Canadian securities regulatory authority6 or has entered into a settlement agreement with a Canadian securities regulatory authority,6 or (b) any other penalties or sanctions imposed by a court or regulatory body that would likely be considered important to a reasonable investor in making an investment decision.
Conflicts of Interest
To the best of our knowledge, no director or executive officer has an existing or potential material conflict of interest with us or any of our subsidiaries.
LEGAL PROCEEDINGS AND REGULATORY ACTIONS
In the ordinary course of our business, we are routinely involved in or parties to various ongoing, pending and threatened legal actions and proceedings.
A description of certain legal proceedings to which we are a party appears in Note 24 “Legal and regulatory matters” beginning on page 230 of our 2025 Annual Consolidated Financial Statements, which note is incorporated by reference herein.
Except as otherwise described in Note 24 “Legal and regulatory matters”, since October 31, 2024, (a) there have been no penalties or sanctions imposed against us by a court relating to Canadian securities legislation6 or by a Canadian securities regulatory authority6, (b) there have been no other penalties or sanctions imposed by a court or regulatory body against us that would likely be considered important to a reasonable investor in making an investment decision, and (c) we have not entered into any settlement agreements with a court relating to Canadian securities legislation6 or with a Canadian securities regulatory authority6.
INTEREST OF MANAGEMENT AND OTHERS IN MATERIAL TRANSACTIONS
To the best of our knowledge, there were no directors or executive officers or any associate or affiliate of a director or executive officer with a material interest in any transaction within the three most recently completed financial years or during the current financial year that has materially affected us or is reasonably expected to materially affect us.
TRANSFER AGENT AND REGISTRAR
For Canada, Computershare Trust Company of Canada is the transfer agent and registrar for our common shares and our preferred shares. Their principal offices are in the cities of: Montreal, QC, Toronto, ON,
6 National Instrument 14-101 restricts the meaning of “securities legislation” to Canadian provincial and territorial legislation and “securities regulatory authority” to Canadian provincial and territorial securities regulatory authorities.
22
Calgary, AB and Vancouver, BC. In the U.S., Computershare Trust Company, N.A. is the co-transfer agent located in Canton, Massachusetts and Jersey City, New Jersey. In the U.K., Computershare Services PLC is the co-transfer agent located in Bristol, England.
EXPERTS
PricewaterhouseCoopers LLP (PwC), Chartered Professional Accountants, Licensed Public Accountants, audited our Annual Consolidated Financial Statements, which comprise the consolidated balance sheets as of October 31, 2025 and October 31, 2024 and the related consolidated statements of income, comprehensive income, changes in equity, and cash flows for the years then ended, including the related notes and the effectiveness of our internal control over financial reporting as of October 31, 2025. PwC has advised that they are independent with respect to the Bank within the meaning of the Rules of Professional Conduct of the Chartered Professional Accountants of Ontario and the rules and regulations adopted by the SEC and the Public Company Accounting Oversight Board (United States).
AUDIT COMMITTEE
Audit Committee Mandate
The mandate of the Audit Committee is attached as Appendix C to this Annual Information Form.
Composition of Audit Committee
The Audit Committee consists of Cynthia Devine (Chair), Toos N. Daruvala, Barry Perry, Maryann Turcke and Frank Vettese. The board has determined that each member of the Audit Committee is independent under our Director Independence Policy, which incorporates the independence standards under applicable Canadian and U.S. laws and regulations and none receives, directly or indirectly, any compensation from us other than ordinary course compensation for service as a member of the board of directors and its committees or of a board of directors of one or more of our subsidiaries. All members of the Audit Committee are financially literate within the meaning of National Instrument 52-110 – Audit Committees and of the Corporate Governance Standards of the NYSE. In considering the criteria for determining financial literacy, the board of directors looks at the ability of a director to read and understand a balance sheet, an income statement and a cash flow statement of a financial institution. The board has determined that each of Cynthia Devine, Barry Perry and Frank Vettese qualifies as an “audit committee financial expert” as defined by the SEC.
Relevant Education and Experience of Audit Committee Members
In addition to each member’s general business experience, the education and experience of each Audit Committee member that is relevant to the performance of their responsibilities as an Audit Committee member is as follows:
Cynthia Devine, FCPA, FCA, HBA, earned her Honours Business Administration degree from Western University. Ms. Devine became a Fellow of the Institute of Chartered Accountants of Ontario in 2011. Ms. Devine was the President and Chief Executive Officer of Maple Leaf Sports & Entertainment from 2022 to 2024. She was the Chief Financial Officer from 2017 to 2022. From 2003 to 2014, Ms. Devine served as Chief Financial Officer of Tim Hortons Inc., and from 2015 to 2017 served as Executive Vice President, Chief Financial Officer and Corporate Secretary of RioCan Real Estate Investment Trust. Ms. Devine serves as a director for Empire Company Limited/Sobeys Inc. Ms. Devine has been a member of the Audit Committee since August 2020.
23
Toos N. Daruvala earned his MBA from the University of Michigan and his Bachelor of Technology degree in electrical engineering from the Indian Institute of Technology. Mr. Daruvala was Co-Chief Executive Officer of MIO Partners, Inc. from 2016 to 2021, and held various senior positions at McKinsey & Company from 1983 to 2015, including Senior Partner, Risk Practice and Director, Banking and Securities Practice. He concluded his 33 year career at McKinsey & Company by serving as Senior Advisor and Director Emeritus in 2016. Mr. Daruvala has been a member of the Audit Committee since April 2022.
Barry Perry earned his Bachelor of Commerce degree (Honours) from Memorial University of Newfoundland and is a Chartered Professional Accountant. Mr. Perry was President and Chief Executive Officer of Fortis Inc. from 2015 to 2020 and served as Executive Vice President of Finance and Chief Financial Officer from 2004 to 2014. Mr. Perry is a member of the boards of Capital Power Corporation and Canada Pension Plan Investment Board. Mr. Perry has been a member of the Audit Committee since August 2023.
Maryann Turcke, B.S., M.S., M.B.A, earned her Bachelor of Science in Civil Engineering degree from Queen’s University, her Master of Science in Engineering degree from the University of Toronto and her Master of Business Administration from Queen’s University. Ms. Turcke was Chief Operating Officer of the National Football League from 2017 to 2020, President, NFL Networks from 2017 to 2021 and President of Bell Media from 2014 to 2017. Ms. Turcke has been a member of the Audit Committee since January 2020.
Frank Vettese, B.B.A., FCA, earned his Bachelor of Business Administration from the Schulich School of Business at York University and is a fellow of the Chartered Professional Accountants of Ontario and a fellow of the Canadian Institute of Chartered Business Valuators. Mr. Vettese was Managing Partner and Chief Executive of Deloitte Canada from 2012 to June 2019. Mr. Vettese has been a member of the Audit Committee since July 2019.
Pre-Approval Policies and Procedures
The Audit Committee has adopted a policy that requires pre-approval by the Audit Committee of audit services, audit-related services and other services within permissible categories of non-audit services. The policy prohibits us from engaging the Bank’s independent auditor for “prohibited” categories of non-audit services. A copy of our Pre-Approval Policies and Procedures can be found in Appendix D.
Independent Registered Public Accounting Firm Fees
Following a tender process, PwC was appointed our independent auditor by the Board of Directors on January 29, 2016, which appointment was approved by the Bank’s shareholders at the Annual and Special Meeting of Common Shareholders held on April 6, 2016. Fees relating to the years ended October 31, 2025 and October 31, 2024 to PwC and its affiliates, including the nature of each category of fees, are detailed below.
| |
Year ended October 31, 2025 ($Millions) |
|
|
Year ended October 31, 2024 ($Millions) |
| |||||||||||||||||||
| Bank and Subsidiaries |
Mutual Funds(1) |
Total | Bank and Subsidiaries |
Mutual Funds(1) |
Total | |||||||||||||||||||
|
Audit fees |
55.7 | 3.1 | 58.8 | 50.6 | 2.8 | 53.4 | ||||||||||||||||||
|
Audit-related fees |
10.4 | - | 10.4 | 9.9 | - | 9.9 | ||||||||||||||||||
|
Tax fees |
0.2 | 0.4 | 0.6 | 0.1 | 0.3 | 0.4 | ||||||||||||||||||
|
All other fees |
1.0 | 0.7 | 1.7 | 0.9 | 0.7 | 1.6 | ||||||||||||||||||
|
Total fees |
67.3 | 4.2 | 71.5 | 61.5 | 3.8 | 65.3 | ||||||||||||||||||
24
(1) The Mutual Funds category includes fees paid for professional services provided by PwC for certain mutual funds managed by subsidiaries of the Bank. In addition to other administrative costs, the subsidiaries are responsible for the auditors’ fees for professional services rendered in connection with the annual audit, statutory and regulatory filings and other services for the Mutual Funds in return for a fixed administration fee.
Audit Fees
Audit fees were paid for professional services rendered by the Bank’s independent auditor for the integrated audit of the 2025 Annual Consolidated Financial Statements of the Bank, including its audit of the effectiveness of our internal control over financial reporting, and any financial statement audits of our subsidiaries. In addition, audit fees were paid for services that generally only the Bank’s independent auditor reasonably can provide, which includes services provided in connection with statutory and regulatory filings, including those related to prospectuses and other offering documents.
Audit-Related Fees
Audit-related fees were paid for assurance and related services that are rendered by the Bank’s independent auditor and are not reported under the audit fees item above. These services consisted of:
| • | employee benefit plan audits; |
| • | due diligence related to mergers and acquisitions; |
| • | reports on control procedures at a service organization; |
| • | consultations and audits in connection with acquisitions, including evaluating the accounting treatment for proposed transactions; |
| • | attest services not required by statute or regulation; |
| • | reporting on the effectiveness of internal controls as required by contract or for business reasons; |
| • | the audits of various trusts and limited partnerships; and |
| • | consultations regarding financial and reporting standards. |
Tax Fees
Tax fees were paid for tax compliance services including preparation of tax returns for certain mutual funds managed by subsidiaries of the Bank and a subscription for services to provide specific tax data and information to complete routine tax schedules and calculations for clients.
All Other Fees
These services consist of translation of documents for us and certain of our subsidiaries, regulatory compliance services, as well as accounting and other research software subscriptions and publications.
ADDITIONAL INFORMATION
Additional information, including directors’ and officers’ remuneration and indebtedness, principal holders of our securities and securities authorized for issuance under equity compensation plans, where applicable, is contained in the Bank’s Management Proxy Circular for the most recent annual meeting of shareholders. Additional financial information is provided in our 2025 Annual Consolidated Financial Statements and 2025 Management’s Discussion and Analysis, which are included in our 2025 Annual Report.
Copies of this Annual Information Form, our 2025 Annual Report and Management Proxy Circular in respect of the most recent annual meeting of shareholders may be obtained from Investor Relations at 200 Bay Street, South Tower, Toronto, Ontario, M5J 2J5.
25
This Annual Information Form, the 2025 Annual Consolidated Financial Statements and 2025 Management’s Discussion and Analysis, as well as additional information about us may be found on our website at rbc.com, on SEDAR+, the Canadian Securities Administrators’ website, at sedarplus.com, and on the EDGAR section of the SEC’s website at sec.gov.
Information contained in or otherwise accessible through the websites mentioned in this Annual Information Form does not form a part of this Annual Information Form. All references in this Annual Information Form to websites are inactive textual references and are for your information only.
TRADEMARKS
® /™ Trademarks of Royal Bank of Canada. ǂ All other trademarks are the property of their respective owner(s).
26
APPENDIX A – PRINCIPAL SUBSIDIARIES
| (Millions of Canadian dollars) | As at October 31, 2025 | |||||
|
|
||||||
| Principal subsidiaries (1) | Principal office address (2) |
Carrying value of voting shares owned by the Bank (3) |
||||
|
|
||||||
| Royal Bank Holding Inc. |
Toronto, Ontario, Canada | $ | 103,027 | |||
| RBC Direct Investing Inc. |
Toronto, Ontario, Canada | |||||
| RBC Insurance Holdings Inc. |
Mississauga, Ontario, Canada | |||||
| RBC Life Insurance Company |
Mississauga, Ontario, Canada | |||||
| Investment Holdings (Cayman) Limited |
George Town, Grand Cayman, Cayman Islands | |||||
| RBC (Cayman) Funding Ltd. |
George Town, Grand Cayman, Cayman Islands | |||||
| Capital Funding Alberta Limited |
Calgary, Alberta, Canada | |||||
| RBC Global Asset Management Inc. |
Toronto, Ontario, Canada | |||||
| RBC Investor Services Trust |
Toronto. Ontario. Canada | |||||
| RBC (Barbados) Trading Bank Corporation |
St. James, Barbados | |||||
|
|
||||||
| RBC US Group Holdings LLC (2) |
Toronto, Ontario, Canada | 38,425 | ||||
| RBC USA Holdco Corporation |
New York, New York, U.S. | |||||
| RBC Capital Markets. LLC |
New York, New York, U.S. | |||||
| City National Bank |
Los Angeles, California, U.S. | |||||
|
|
||||||
| RBC Dominion Securities Limited |
Toronto, Ontario, Canada | 19,306 | ||||
| RBC Dominion Securities Inc. |
Toronto, Ontario, Canada | |||||
|
|
||||||
| Royal Bank Mortgage Corporation |
Toronto, Ontario, Canada | 7,420 | ||||
|
|
||||||
| RBC Europe Limited |
London, England | 5,822 | ||||
|
|
||||||
| The Royal Trust Company |
Montreal, Quebec, Canada | 1,782 | ||||
|
|
||||||
| Royal Trust Corporation of Canada |
Toronto, Ontario, Canada | 785 | ||||
|
|
||||||
(1) The Bank directly or indirectly controls each subsidiary.
(2) Each subsidiary is incorporated or organized under the laws of the state, province or country in which the principal office is situated, except for RBC US Group Holdings LLC and RBC USA Holdco Corporation which are incorporated under the laws of the State of Delaware, U.S., RBC Capital Markets, LLC, which is organized under the laws of the State of Minnesota, U.S., and City National Bank which is a national bank, chartered under the laws of the United States of America.
(3) The carrying value of voting shares is stated as the Bank’s equity in such investments.
27
APPENDIX B – EXPLANATION OF RATINGS AND OUTLOOK
| Institution | Rating | Outlook | ||||
| Moody’s Investors Service, Inc. | ● Obligations rated ‘Aa’ are judged to be of high quality and are subject to very low credit risk. ● Obligations rated ‘A’ are judged to be upper medium-grade and are subject to low credit risk. ● Obligations rated ‘Baa’ are judged to be medium-grade and subject to moderate credit risk and as such may possess certain speculative characteristics. ● Moody’s Investors Service, Inc. appends numerical modifiers 1, 2, and 3 to each generic rating classification from Aa through Caa. The modifier 1 indicates that the obligation ranks in the higher end of its generic rating category; the modifier 2 indicates a mid-range ranking; and the modifier 3 indicates a ranking in the lower end of that generic rating category. ● Additionally, a “(hyb)” indicator is appended to all ratings of hybrid securities issued by banks, insurers, finance companies, and securities firms. ● Ratings of ‘P-1’ reflect a superior ability to repay short-term obligations.
|
A Moody’s Investors Service, Inc. rating outlook is an opinion regarding the likely rating direction over the medium term. | ||||
| S&P Global Ratings | ● An obligation rated ‘AA’ differs from the highest-rated obligations only to a small degree. The obligor’s capacity to meet its financial commitment on the obligation is very strong. ● An obligation rated ‘A’ is somewhat more susceptible to the adverse effects of changes in circumstances and economic conditions than obligations in higher-rated categories. However, the obligor’s capacity to meet its financial commitments on the obligation is still strong. ● An obligation rated ‘BBB’ exhibits adequate protection parameters. However, adverse economic conditions or changing circumstances are more likely to weaken the obligor’s capacity to meet its financial commitments on the obligation. ● Ratings from ‘AA’ to ‘CCC’ may be modified by the addition of a plus (+) or minus (-) sign to show relative standing within the rating categories. ● A short-term obligation rated ‘A-1’ is rated in the highest category by S&P Global Ratings. The obligor’s capacity to meet its financial commitments on the obligation is strong. Within this category, certain obligations are designated with a plus sign (+). This indicates that the obligor’s capacity to meet its financial commitments on these obligations is extremely strong. A short term obligation rated ‘A-1+’ has extremely strong capacity to meet its financial commitments. |
An S&P Global Ratings outlook assesses the potential direction of a long-term credit rating over the intermediate term, which is generally up to two years for investment grade and generally up to one year for speculative grade. | ||||
28
| Institution | Rating | Outlook | ||||
| Fitch Ratings | ● ‘AA’ (Very High Credit Quality) ratings denote expectations of very low default risk. They indicate very strong capacity for payment of financial commitments. This capacity is not significantly vulnerable to foreseeable events. ● ‘A’ (High Credit Quality) ratings denote expectations of low default risk. The capacity for payment of financial commitments is considered strong. This capacity may, nevertheless, be more vulnerable to adverse business or economic conditions than is the case for higher ratings. ● ‘BBB’ (Good Credit Quality) ratings indicate that expectations of default risk are currently low. The capacity for payment of financial commitments is considered adequate, but adverse business or economic conditions are more likely to impair this capacity. ● The modifiers “+” or “-” may be appended to a rating to denote relative status within major rating categories. ● ‘F1’ (Highest Short-Term Credit Quality) ratings indicate the strongest intrinsic capacity for timely payment of financial commitments; may have an added “+” to denote any exceptionally strong credit feature.
|
Outlooks indicate the direction a rating is likely to move over a one- to two-year period. They reflect financial or other trends that have not yet reached or been sustained the level that would cause a rating action, but which may do so if such trends continue. | ||||
| Morningstar DBRS | ● An obligation rated ‘AA’ is of superior credit quality. The capacity for the payment of financial obligations is considered high. Credit quality differs from AAA only to a small degree. Unlikely to be significantly vulnerable to future events. ● An obligation rated ‘A’ is of good credit quality. The capacity for the payment of financial obligations is substantial, but of lesser credit quality than AA. May be vulnerable to future events, but qualifying negative factors are considered manageable. ● All rating categories from AA to CCC contain the subcategories (high) and (low). The absence of either a (high) or (low) designation indicates the credit rating is in the middle of the category. ● R-1 ratings indicate the highest credit quality. The capacity for the payment of short-term financial obligations as they fall due is exceptionally high. Unlikely to be adversely affected by future events. The R-1 and R-2 rating categories are further denoted by the subcategories “(high)”, “(middle)”, and “(low)”. ● Preferred shares rated Pfd-1 are generally of superior credit quality and are supported by entities with strong earnings and balance sheet characteristics. Pfd-1 ratings generally correspond with issuers with a AAA or AA category reference point. ● Preferred shares rated Pfd-2 are generally of good credit quality. Protection of dividends and principal is still substantial, but earnings, the balance sheet and coverage ratios are not as strong as Pfd-1 rated companies. Generally, Pfd-2 ratings correspond with issuers with an A category or higher reference point. ● Each rating category of the preferred shares may be denoted by the subcategories “high” and “low”. The absence of either a “high” or “low” designation indicates the rating is in the middle of the category. |
Rating Trends provide guidance in respect of Morningstar DBRS’ opinion regarding the outlook for a rating. Rating Trends have three categories: “Positive”, “Stable” or “Negative”. The Rating Trend indicates the direction in which Morningstar DBRS considers the credit rating may move if present circumstances continue, or in certain cases as it relates to the Corporate Finance sector, unless challenges are addressed by the issuer. | ||||
29
WHAT THE RATINGS ADDRESS:
Short-term and Long-term Senior Debt
Short-term and long-term senior debt credit ratings are the current opinion of the rating agency on creditworthiness of an obligor with respect to fixed-income obligations whose original maturity is of a short and medium to long-term nature, respectively. They address the possibility that a financial obligation will not be honoured as promised and reflect both the likelihood of default and any financial loss suffered in the event of default.
Subordinated Debt
Subordinated debt credit ratings are the current opinion of the rating agency on creditworthiness of an obligor with respect to a specific financial obligation and a specific class of financial obligation for a specific financial program. Ratings take into consideration the creditworthiness of guarantors, insurers, or other forms of credit enhancement on the obligation and takes into account the currency in which the obligation is denominated.
Preferred Shares
Preferred shares ratings address the issuer’s capacity and willingness to pay dividends and principal, in case of limited life, on a timely basis. They address the likelihood of timely payment of dividends, notwithstanding the legal ability to pass on or defer a dividend payment.
Rating Outlook
Rating Outlook assesses the potential direction of a credit rating over the intermediate to longer term. In determining a Rating Outlook consideration is given to any changes in the economic and fundamental business conditions. An Outlook is not necessarily a precursor of a rating change.
30
APPENDIX C – AUDIT COMMITTEE MANDATE
ROYAL BANK OF CANADA
(the Bank)
January 30, 2025
AUDIT COMMITTEE MANDATE
| A. | PURPOSE AND DUTIES OF THE COMMITTEE |
| 1. | General Purpose |
The Committee is responsible for assisting the Bank’s board of directors (the Board) in its oversight of (i) the integrity of the Bank’s financial statements; (ii) the qualifications, performance and independence of the external auditors; (iii) the performance of the Bank’s internal audit function; (iv) internal controls; and (v) compliance with legal and regulatory requirements.
| 2. | Financial Statements and other Documents |
The Committee will regularly review and discuss the following:
| a) | prior to review and approval by the Board, the Bank’s annual statement which includes its annual consolidated financial statements, its quarterly financial statements, and related management’s discussion and analysis; |
| b) | earnings releases on interim and annual results, the annual information form, the annual report and other financial information, earnings guidance and presentations provided to analysts, rating agencies and the public; |
| c) | the Bank’s annual environmental and social sustainability (collectively, sustainability) reporting; |
| d) | such other periodic disclosure documents as requested by regulators or that may be required by law; |
| e) | investments and transactions brought to the Committee’s attention that could adversely affect the Bank’s well-being; |
| f) | prospectuses relating to the issuance of securities of the Bank; |
| g) | representations provided by management to the auditors, where appropriate; |
| h) | reports on any litigation matters which could significantly affect the Bank; |
| i) | tax matters that are material to the financial statements; and |
| j) | other reports as required to be communicated by the auditors by the Canadian Public Accountability Board, the Office of the Superintendent of Financial Institutions, and the U.S. Public Company Accounting Oversight Board. |
Moreover, the Committee will ensure that adequate procedures are in place for the review of the Bank’s public disclosure of financial information derived from the Bank’s financial statements, and will periodically assess the adequacy of these procedures.
31
| 3. | External Auditor |
Subject to the shareholders’ powers conferred by the Bank Act, the Committee will recommend the appointment (or revocation thereof) of any registered public accounting firm (including the external auditor) engaged to prepare or issue an audit report or to perform other audit, review or attest services. The Committee will fix the remuneration and oversee the work of these accounting firms, including the resolution of disagreements with management regarding financial reporting. Such accounting firms will report directly to the Committee.
Moreover, as part of its oversight of the external auditor the Committee will:
| a) | meet with the external auditor to review and discuss the annual audit plan, the results of the audit, the auditor’s report with respect to the annual statement, and all other reports, returns and transactions as required by applicable laws; |
| b) | approve all audit engagement fees and terms, as well as the terms of any permitted non-audit services to be provided by the external auditor to the Bank, with such approvals to be given specifically or pursuant to preapproval policies and procedures adopted by the Committee in accordance with applicable laws; |
| c) | review any concerns that may be brought forward by the external auditor, including any difficulties they may encounter in conducting their audit, as well as management’s response to such concerns; |
| d) | review material correspondence between the external auditor and management relating to audit findings; |
| e) | taking into account the opinions of management and the Bank’s internal auditor, annually assess the external auditor’s qualifications and performance, including relevant experience, geographical reach, professional scepticism, quality of services and communications, and independence and objectivity; |
| f) | review formal written statements delineating all relationships between the external auditor and the Bank that may impact its independence and objectivity; |
| g) | annually assess the risk of the external auditor withdrawing from the audit; |
| h) | discuss with the external auditor and with management the annual audited financial statements and quarterly financial statements, as well as related management’s discussion and analysis; |
| i) | review hiring policies concerning partners, employees and former partners and employees of the present and former external auditors; |
| j) | review and evaluate the qualifications, performance and independence of the external auditor’s lead partner and discuss the timing and process for implementing the rotation of the lead audit partner, the concurring audit partners and any other active audit engagement team partner; |
| k) | on a periodic basis, perform a comprehensive review of the performance of the External Auditor over multiple years to assess the audit firm, its independence and application of professional skepticism; and |
32
| l) | at least annually, obtain and review a report by the external auditor describing: (i) the external auditor’s internal quality- control procedures; (ii) the external auditor’s internal procedures to ensure independence; and (iii) any material issues raised by the most recent internal quality-control review or peer review of the external auditors, or by any inquiry or investigation by governmental or professional authorities, within the preceding five years, respecting one or more independent audits carried out by the external auditor, and any steps taken to deal with any such issues. |
| 4. | Oversight of Independent Control Functions |
The Committee will oversee the finance and internal audit functions, having regard to their independence from the businesses whose activities they review. The Committee will review and approve the appointment or removal of each of the Chief Financial Officer (the CFO) and the Chief Audit Executive (the CAE), as well as their respective mandates and the mandates or charters of their respective functions. The Committee will approve each of the functions’ organizational structures, budgets and resources. Every year the Committee will assess the performance of each of the CFO and CAE and the effectiveness of their respective functions. It will also periodically review independent assessments of each of these functions. Moreover, it will annually review and approve the internal audit function’s overall risk methodology.
| 5. | Internal Control |
The Committee will assist in the oversight of internal control by engaging in the following activities:
| a) | requiring management to implement and maintain appropriate systems of internal control, including internal controls over financial reporting and for the prevention and detection of fraud and error; |
| b) | requiring management to develop and elevate internal controls over sustainability reporting and receiving regular progress updates on the maturity of internal controls supporting the Bank’s annual sustainability reporting; |
| c) | evaluating and approving systems of internal control and meeting regularly with the CAE and with management to assess the adequacy and effectiveness of these systems; |
| d) | receiving reasonable assurances on a regular basis from management that the organization is in control; |
| e) | reviewing reports from the Chief Executive Officer (the CEO) and the CFO regarding any significant deficiency or material weakness in the design or operation of internal controls over financial reporting and the detection of fraud involving management or other employees who have a significant role in the Bank’s internal control over financial reporting; |
| f) | reviewing and approving the Bank’s disclosure policy and reviewing reports on the effectiveness of the Bank’s disclosure controls and procedures; |
| g) | reviewing the process relating to the CEO and CFO’s certifications on the design and effectiveness of the Bank’s disclosure controls and procedures and internal control over financial reporting, and the integrity of the Bank’s quarterly and annual financial statements. |
| 6. | Internal Auditor |
The Committee will regularly meet with the CAE to review and approve the annual risk-based internal audit plan and review internal audit activities. The Committee will review and discuss with the CAE issues reported to management by the internal audit function and management’s responses and/or corrective actions. The Committee will also evaluate the status of identified control weaknesses, as well as the adequacy and degree of compliance with the Bank’s systems of internal control. Other issues that the Committee may review with the CAE include audit scope, information access, resource limitations or any other difficulties encountered by the internal audit function.
33
| 7. | Capital and Liquidity Management |
The Committee will review capital transactions and may designate and authorize the issue of (i) First Preferred Shares and (ii) securities qualifying as additional Tier 1 capital under capital adequacy guidelines issued by the Superintendent of Financial Institutions. The Committee may also review and approve securities disclosure documents in connection with issues of the Bank’s subordinated indebtedness as provided in the relevant resolution of the Board.
The Committee will review the adequacy and effectiveness of internal controls related to capital and liquidity management. It will also discuss with the external auditors any matters arising from the audit that may have an impact on regulatory or capital disclosures included in the Bank’s annual statement.
| 8. | Committee Reports |
The Committee is responsible for preparing any report from the Committee that may be included in the Bank’s annual proxy statement.
| 9. | Other |
| a) | The Committee will discuss major issues regarding accounting principles and financial statement presentations, including significant changes in the Bank’s selection or application of accounting principles and analyses prepared by management or the external auditors regarding financial reporting issues and judgments made in connection with the preparation of the financial statements; |
| b) | The Committee will establish procedures for managing complaints received by the Bank regarding accounting, internal accounting controls or auditing matters, as well as procedures for the confidential and anonymous submission by employees of concerns regarding accounting, internal accounting controls or auditing matters. The Committee will receive reports from the Vice-President, Client Complaints Appeal Office at each Committee meeting and will meet with the Vice-President, Client Complaints Appeal Office annually in relation to these procedures; |
| c) | The Committee will review and discuss any reports concerning material violations submitted to it by the Bank’s legal counsel pursuant to applicable law and policy; |
| d) | The Committee will discuss the major financial risk exposures of the Bank and the steps management has taken to monitor and control such exposures; |
| e) | Subject to the laws applicable to the subsidiary, the Committee may perform for and on behalf of a subsidiary the functions of an audit committee of the subsidiary. |
| B. | COMMITTEE COMPOSITION AND PROCEDURES |
| 1. | Composition of Committee |
The Committee will be composed of five or more directors. No Committee member may be an officer or employee of the Bank or of an affiliate of the Bank. Each Committee member will be (i) unaffiliated, as determined in accordance with the regulations made under the Bank Act, and (ii) independent, as determined by director independence standards adopted by the Board. Committee membership will reflect a balance of experience and expertise required to fulfill the Committee’s mandate.
34
All Committee members will be financially literate or become financially literate within a reasonable period after appointment to the Committee. At least one member will have accounting or financial management expertise. No member may serve on the audit committees of more than two other public companies, unless the Board determines such simultaneous service would not impair the member’s ability to serve effectively on the Committee.
| 2. | Appointment of Committee Members |
The Board will appoint or reappoint the Committee members at the annual organizational meeting of the directors. In the normal course members will serve a minimum of three years. Each member will remain a member until a successor is appointed, unless the member resigns, is removed or ceases to be a director. The Board may fill a vacancy that occurs in the Committee at any time.
| 3. | Committee Chair and Secretary |
The Board will appoint or reappoint a Committee Chair from among the members of the Committee. If the Board fails to do so, the Committee members will make the appointment or re-appointment. In the normal course the Committee Chair will serve a minimum of three years. The Committee Chair will not be a former employee of the Bank or of an affiliate. The Secretary of the Committee need not be a director.
| 4. | Time and Place of Meetings |
Meetings may be called by any Committee member, the external auditors, the CFO, the Board Chair, the CEO or the Chief Audit Executive. The Committee members will determine the time and place of and the procedure at meetings, provided that the Committee meets at least quarterly. The Committee members may participate in meetings in person or by telephone, electronic or other communications facilities. The Committee may request any officer or employee of the Bank or the Bank’s outside counsel or external auditors to attend a meeting of the Committee or to meet with any members of, or consultants to, the Committee.
| 5. | Quorum |
A quorum for meetings will be three members.
| 6. | Notice of Meetings |
Notice of the time and place of each meeting will be generally given in writing or by telephone, or by electronic or other communications facilities, to each Committee member and to the external auditors at least 24 hours prior to the time fixed for such meeting; however,
| a) | a member may in any manner waive notice of a meeting and attendance of a member at a meeting is a waiver of notice of the meeting, except where a member attends a meeting for the express purpose of objecting to the transaction of any business on the grounds that the meeting is not lawfully called; |
| b) | a resolution in writing signed by all the members entitled to vote on that resolution at a Committee meeting, other than a resolution of the Committee carrying out its duties under subsection 194(3) of the Bank Act, will be as valid as if it had been passed at a meeting of the Committee; and |
35
| c) | capital transactions may be reviewed and/or authorized at a meeting of which at least one hour prior notice is given. |
| 7. | Delegation |
The Committee may designate a sub-committee to review any matter within the Committee’s mandate.
| 8. | Reporting to the Board |
The Committee will report to the Board following each meeting with respect to its activities and recommendations. It will also report to the Board on the annual statement and returns that must be approved by the directors under the Bank Act.
| 9. | Access to Management and External Advisors |
In fulfilling its responsibilities, the Committee will have unrestricted access to management, employees and the CAE, of the Bank. The Committee will select, retain, oversee, terminate and approve the fees of any external advisor that the Committee deems necessary, including any legal or accounting advisor, to assist it in fulfilling its responsibilities. The Bank will provide appropriate funding, as determined by the Committee, for any such engagement.
The Committee may also investigate any matter with full access to all books, records, facilities, management and employees of the Bank.
| 10. | Private Meetings |
At least quarterly the Committee will meet with no members of management present and have separate private meetings with the external auditors, and each of the CAE, the CFO and the Chief Legal & Administrative Officer, to discuss any matters that the Committee or these parties believe should be discussed.
| 11. | Minutes |
Minutes of meetings of the Committee will be maintained by the Secretary and subsequently presented to the Committee and to the Board, if required by the Board.
| 12. | Evaluation of Effectiveness and Review of Mandate |
The Committee will annually review and assess the adequacy of its mandate and evaluate its effectiveness in fulfilling its mandate.
36
APPENDIX D – PRE-APPROVAL POLICIES AND PROCEDURES
Policies and Procedures
for the Monitoring, and Pre-Approval of Services
to be Performed by Public Accounting Firms
and the Review of the External Auditors
(effective April 10, 2024)
Mandate
| 1. | The mandate of the Audit Committee established by the Board of Directors (“Board”) confers on the Audit Committee the authority and responsibility (among other things) to: |
| • | Pre-approve all audit and any legally permissible non-audit services to be provided by the external auditors and all audit, review and attest services provided by any other public accounting firm, with such approval to be given either specifically or pursuant to pre-approval policies and procedures adopted by the Audit Committee; and |
| • | To complete an annual and five year comprehensive reviews of the external auditor’s performance and to recommend to the Board the selection and termination of the external auditor subject to shareholder approval. |
Purpose
| 2. | These Policies and Procedures are intended to: |
| a) | specify the methods by which the Audit Committee may pre-approve the provision of audit, review and attest services by any public accounting firm to the Bank and its subsidiaries; |
| b) | specify the methods by which the Audit Committee may pre-approve the provision of non-audit services to the Bank and its subsidiaries by the Bank’s external auditors and their affiliates (the “auditors”) that do not impair the independence of the auditors under applicable laws and professional standards, including the rules of the Chartered Professional Accountants Canada, the Public Company Accounting Oversight Board (“PCAOB”), the Canadian Securities Administrators and the U.S. Securities and Exchange Commission; |
| c) | set forth procedures designed to ensure that any services to be provided by the auditors and that any audit, review or attestation services to be performed by any other public accounting firm have been properly authorized and pre-approved under the authority of the Audit Committee, and that the Audit Committee is promptly informed of each service; |
| d) | ensure that the Audit Committee’s responsibilities are not delegated to management in violation of applicable law; |
| e) | specify the policies relating to the annual and comprehensive evaluation of the external auditor and selection of the external auditor by the Audit Committee for recommendation to the Board. |
Required Approval of Audit and Non-Audit Services
| 3. | The Audit Committee shall pre-approve all engagements of the auditors by: |
| a) | the Bank; or |
| b) | any subsidiary. |
| 4. | The Audit Committee shall pre-approve all engagements of any public accounting firm to provide audit, review or attest services to: |
| a) | the Bank; or |
| b) | any subsidiary. |
37
| 5. | The Audit Committee shall evidence its pre-approval by resolution of the Audit Committee or through the exercise of delegated authority in accordance with these Policies and Procedures. |
| 6. | “Subsidiary” has the meaning set forth in Rule 210.1-02(x) of the U.S. Securities and Exchange Commission’s Regulation S-X. |
| 7. | For the purpose of these Policies and Procedures and any pre-approval: |
| a) | “Audit services” include services that are a necessary part of the audit process and any activity that is a necessary procedure used by the accountant in reaching opinions on the financial statements and on internal control over financial reporting as is required under applicable auditing standards (“AAS”), including technical reviews to reach an audit judgment on complex accounting issues; |
| b) | The term “audit services” is broader than those services strictly required to perform an audit pursuant to AAS and include such services as: |
| i) | the issuance of comfort letters and consents in connection with offerings of securities; |
| ii) | the performance of domestic and foreign statutory audits; |
| iii) | attest services required by statute or regulation; and |
| iv) | assistance with and review of documents filed with the Office of the Superintendent of Financial Institutions, Canadian Securities Administrators, the Securities and Exchange Commission, the Board of Governors of the Federal Reserve Board and other regulators having jurisdiction over the activities of the Bank and its subsidiaries, and responding to comments from such regulators; |
| c) | “Audit-related” services are assurance and related services traditionally performed by the Bank’s independent auditor and that are reasonably related to the performance of the audit or review of financial statements and not categorized under “audit fees” for disclosure purposes. |
“Audit-related services” include:
| i) | employee benefit plan audits; |
| ii) | due diligence related to mergers and acquisitions, |
| iii) | consultations and audits in connection with acquisitions, including evaluating the accounting treatment for proposed transactions; |
| iv) | reporting on the effectiveness of internal controls as required by contract or for business reasons; |
| v) | the audits of various trusts and limited partnerships; |
| vi) | attest services not required by statute or regulation; and |
| vii) | consultations regarding financial accounting and reporting standards. |
Non-financial operational audits are not “audit-related” services.
| d) | “Review services” are services applied to unaudited financial statements and consist of the inquiry and analytical procedures that provide the accountant with a reasonable basis for expressing limited assurance that there are no material modifications that should be made to financial statements for them to be in conformity with International Financial Reporting Standards or, if applicable, any other comprehensive basis of accounting. |
| e) | “Attest” services are engagements where the accountant issues an examination, a review, or an agreed-upon procedures report on a subject matter, or an assertion about the subject matter that is the responsibility of another party. Examples of the subject matter of an “attest” engagement include: examinations (i.e., audits) of financial forecasts and projections; reviews of pro-forma financial information; reporting on a company’s internal control over financial reporting; and examinations of compliance with contractual arrangements or laws and regulations. |
38
| f) | A “subsidiary” of a specified person is an affiliate controlled by such person directly, or indirectly through one or more intermediaries. |
External Auditor Selection and Appointment
| 8. | The Audit Committee shall monitor, review and assess the quality of the external auditor on an annual basis. The annual assessment will include: |
| a) | quality and thoroughness of the audit approach and methodology; |
| b) | level of professional skepticism, and critical judgments applied by the audit team; |
| c) | independence of the external audit firm and the engagement partner; |
| d) | skills and knowledge of the audit team; |
| e) | level of understanding of our businesses and the financial services industry; |
| f) | sufficiency of resources and ability to complete the audit in a timely manner; |
| g) | partner rotation; |
| h) | value for money; |
| i) | quality of communications; |
| j) | risk of likelihood of withdrawal from the audit; |
| k) | input from senior management of RBC; |
| l) | input from RBC Internal Audit; |
| m) | a self-assessment prepared by the auditor; and |
| n) | audit quality metrics and other matters as determined by the Audit Committee or the Board of Directors. |
| 9. | At least every five years the Audit Committee will conduct a comprehensive assessment of the external auditor. The assessment will include: |
| a) | considerations included within the annual assessment; |
| b) | performance since the last comprehensive review, or appointment of the external auditor; |
| c) | quality and continuity of the engagement team; |
| d) | tenure of the auditor; |
| e) | incidence of independence threats and effectiveness of applied safeguards; |
| f) | track record of the auditor applying professional skepticism; and |
| g) | responsiveness to changes in the Bank’s businesses (i.e. significant acquisitions or changes to systems) and calls for improvement from regulators, inspectors, Audit Committee or management. |
| 10. | The Audit Committee will take the following into account in deciding whether to recommend the tendering of the external audit engagement of the Bank: |
| a) | the results of the annual and comprehensive assessments (refer to factors described in sections 8 and 9); |
| b) | the impact of regulatory and legislative requirements, including mandatory tendering and rotation requirements on the Bank and its subsidiaries; and |
| c) | other factors deemed relevant by the Audit Committee or the Board. |
Delegation
| 11. | The Audit Committee may from time to time delegate to one or more of its members who are “independent” (within the meanings of applicable law and the rules or policies of a securities commission having jurisdiction, and the New York Stock Exchange) the power to pre-approve from time to time: |
| a) | audit, audit-related, review or attest services to be provided by any public accounting firm (including the auditors) that have not been otherwise approved by the Audit Committee; |
| b) | permissible non-audit services to be provided by the auditors that have not otherwise been approved by the Audit Committee, and |
| c) | changes in the scope of pre-approved engagements and the maximum estimated fees for engagements that have been pre-approved by the Audit Committee. |
39
| 12. | The member(s) exercising such delegated authority must report at the next regularly scheduled meeting of the Audit Committee any services that were pre-approved under this delegated authority since the date of the last regularly scheduled meeting. |
| 13. | The member(s) exercising delegated authority may evidence his or her approval by signing an instrument in writing that describes the engagement with reasonable specificity, or by signing an engagement letter containing such a description. |
| 14. | In addition, member(s) exercising delegated authority may pre-approve an engagement orally, if any such oral approval is promptly confirmed in writing. Such written confirmation may be given by fax or e-mail and must describe the engagement with reasonable specificity. |
| 15. | The Audit Committee may, each fiscal year, pre-approve additional fees for addendums to existing audit and audit-related engagements and new audit and audit-related engagements, categorized based on the nature of the underlying services, with a maximum amount (“fee cap”) assigned for each category of services (“fee buckets”). The Audit Committee delegates authority to management to approve final fees associated with such pre-approved engagements provided that such fees do not exceed the fee cap. Any engagement subject to this process will be limited to those with little or no risk of independence breaches. Management shall provide a summary of cumulative fees approved under each fee bucket at the scheduled meetings of the Audit Committee held following the end of each fiscal quarter end. |
Responsibilities of External Auditors
| 16. | To support the independence process, the external auditors shall: |
| a) | confirm in engagement letters that performance of the work will not impair independence; |
| b) | satisfy the Audit Committee that they have in place comprehensive internal policies and processes to ensure adherence, world-wide, to independence requirements, including robust monitoring and communications; |
| c) | provide communication and confirmation to the Audit Committee on independence on a regular basis, and at least annually; |
| d) | provide for the Audit Committee’s approval a summary of proposed services for the fiscal year and a detailed breakdown of expected fees; |
| e) | utilize the tracking numbers assigned by management to all pre-approved services in all fee billings and correspondence, provide detailed annual fee reporting and review management’s detailed quarterly fee reporting. |
| f) | communicate to the Audit Committee all matters required to be communicated by the Canadian Public Accountability Board and U.S. Public Company Accounting Oversight Board. |
| g) | maintain certification by the Canadian Public Accountability Board and registration with the U.S. Public Company Accounting Oversight Board; and |
| h) | review their partner rotation plan and advise the Audit Committee on an annual basis. |
Engagements
| 17. | The Audit Committee will not, as a general rule, pre-approve a service more than one year prior to the time at which it is anticipated that the firm of accountants will be engaged to provide the service. |
| 18. | Engagements will not be considered to be revolving in nature and may not operate from year-to-year without re-approval. |
| 19. | All audit, audit-related, and non-audit services to be provided by the auditor, and all audit, audit-related, review or attest services to be provided by any public accounting firm, shall be provided pursuant to an engagement letter that shall: |
| a) | be in writing and signed by the auditors or public accounting firm; |
| b) | specify the particular services to be provided; |
| c) | specify the period in which the services will be performed; |
40
| d) | specify the maximum total fees to be paid; and |
| e) | in the case of engagements of the auditors, include a confirmation by the auditors that the services are not within a category of services the provision of which would impair their independence under applicable law and Canadian and U.S. generally accepted auditing standards. |
| 20. | Management shall, before signing and delivering an engagement letter on behalf of the Bank or a subsidiary and before authorizing the commencement of an engagement: |
| a) | obtain an engagement letter in accordance with these Policies and Procedures; |
| b) | confirm that the services are described in the engagement letter accurately and with reasonable specificity; |
| c) | obtain confirmation from the auditors that they have conducted an analysis that supports their conclusion that performance of the services will not impair their independence; |
| d) | with respect to engagements for the provision of services other than audit and audit-related services, obtain confirmation from legal counsel of the Bank that performance of the services will not impair independence; and |
| e) | verify that the performance of the services has specifically been approved by the Audit Committee or a member in accordance with authority delegated by the Audit Committee. |
All engagement letters entered into pursuant to these Policies and Procedures shall be made available to the Audit Committee upon request.
Tax Services
| 21. | The Audit Committee, and any member in the exercise of delegated power, shall consider the provision of tax services by the auditors on an engagement-by-engagement basis. |
| 22. | The Audit Committee shall not pre-approve, and any member of the Audit Committee may not exercise delegated power to engage the auditors to provide, tax services to the Bank or a subsidiary: |
| a) | to represent the Bank or a subsidiary before a tax or other court; |
| b) | if the provision of the services would be prohibited, as prescribed by paragraph 26 of these Policies and Procedures; or |
| c) | related to marketing, planning or opinion in favour of the tax treatment of (1) a transaction offered under conditions of confidentiality and for which a fee has been or will be paid by the Bank; or (2) a transaction that was initially recommended directly or indirectly, by the accountant and a significant purpose of which is tax avoidance, unless the proposed tax treatment is at least more likely than not to be allowable under applicable tax laws. |
| 23. | The Audit Committee shall not pre-approve, and any member of the Audit Committee may not exercise delegated power to engage the auditors to provide, tax services to a person in a financial oversight role at the Bank, or an immediate family member of such a person, except as would be permitted by the PCAOB rules. |
Other Non-Audit Services
| 24. | The Audit Committee, and any member in the exercise of delegated power, shall consider the provision of other non-audit services (non-audit services other than audit-related services and tax services, and including non-audit services relating to internal control and business recovery services) by the auditors on an engagement-by-engagement basis. Any approval of non-audit services relating to internal control must be preceded by a discussion with the auditors of the potential effects of the services on independence as required by the rules of the PCAOB. |
41
Value-Added Services
| 25. | The Audit Committee recognizes and approves of the fact that the auditors from time to time provide, without charge or commitment, value added services to the Bank and its subsidiaries that do not involve an engagement of the auditors. Such value added services may include surveys, educational sessions, workshops, roundtable meetings with peers, benchmarking studies, and monitoring of contest draws as an independent observer. The Audit Committee receives and reviews periodic reports from management and the auditors providing representative examples of such services as part of its monitoring of the Bank’s overall relationship with the auditors. |
Prohibited Services
| 26. | The Audit Committee shall not pre-approve, and any member may not exercise delegated power to engage the auditors to provide, any services, including tax services or business recovery services, that (i) provide for a contingency or commission fee arrangement; or (ii) involve the auditors performing any of the non-audit services set forth in paragraph (c)(4) of Rule 210.2-01 of the U.S. Securities and Exchange Commission’s Regulation S-X, which include: |
| a. | providing bookkeeping or other services related to the accounting records or financial statements of the Bank or any of its subsidiaries, |
| b. | providing financial information systems design and implementation to the Bank or any of its subsidiaries, |
| c. | providing appraisal or valuation services, fairness opinions, or contribution-in-kind reports to the Bank or any of its subsidiaries, |
| d. | providing actuarial services to the Bank or any of its subsidiaries, |
| e. | providing internal audit outsourcing services to the Bank or any of its subsidiaries, |
| f. | functioning in the role of management for the Bank or any of its subsidiaries, |
| g. | providing human resources services to the Bank or any of its subsidiaries, |
| h. | providing broker-dealer, investment adviser, or investment banking services to the Bank or any of its subsidiaries, |
| i. | provide legal services to the Bank or any of its subsidiaries, |
| j. | providing services that fall within the category of “expert” services that are prohibited by applicable law to the Bank or any of its subsidiaries, |
| k. | auditing their own work in relation to the Bank or any of its subsidiaries, |
| l. | serving in an advocacy role for the Bank or any of its subsidiaries, or |
| m. | providing services to the Bank or any of its subsidiaries that would otherwise compromise their independence under applicable regulatory guidance. |
For the purposes of the Prohibited Services listed in Section 26, a “subsidiary” includes any entity for which the Bank uses the equity method of accounting and where it is material to the Bank. Therefore, the Audit Committee is not permitted to pre-approve the provision of the prohibited services listed above by the auditors to these entities.
Timely Reporting to the Audit Committee
| 27. | Management shall provide a written report to the Audit Committee of services performed and related fees, and if necessary, proposals for approval of any increase in fees or new engagements at the scheduled meetings of the Audit Committee held following the end of each fiscal quarter end, or more frequently if required. |
No Delegation to Management
| 28. | Nothing in these Policies and Procedures shall be interpreted as a delegation to management of the Audit Committee’s responsibilities in violation of applicable law. |
Effective Date
| 29. | These updated Policies and Procedures are effective as and from April 10, 2024. |
42
Disclosure
| 30. | The Bank shall disclose these Policies and Procedures in its periodic filings, as required by applicable law. |
Review
| 31. | The Audit Committee shall review and reassess the adequacy of these Policies and Procedures on a triennial basis. |
43
Table of Contents
Management’s Discussion and Analysis (MD&A) is provided to enable a reader to assess our results of operations and financial condition for the fiscal year ended October 31, 2025, compared to the preceding fiscal year. This MD&A should be read in conjunction with our 2025 Annual Consolidated Financial Statements and related notes and is dated December 2, 2025. All amounts are in Canadian dollars, unless otherwise specified, and are based on financial statements presented in accordance with International Financial Reporting Standards (IFRS) as issued by the International Accounting Standards Board (IASB), unless otherwise noted. Additional information about us, including our 2025 Information contained in or otherwise accessible through the websites mentioned herein does not form part of this report. All references in this report to websites are inactive textual references and are for your information only. |
22 |
||||
23 |
||||
| 23 | ||||
| 24 | ||||
| 24 | ||||
| 24 | ||||
| 25 | ||||
26 |
||||
| 26 | ||||
| 27 | ||||
| 27 | ||||
| 28 | ||||
| 29 | ||||
| 30 | ||||
| 30 | ||||
32 |
||||
| 32 | ||||
| 32 | ||||
| 33 | ||||
| 35 | ||||
| 40 | ||||
| 43 | ||||
| 50 | ||||
| 53 | ||||
| 59 | ||||
59 |
||||
| 59 | ||||
| 60 | ||||
61 |
||||
| 61 | ||||
| 62 | ||||
65 |
||||
| 65 | ||||
| 65 | ||||
| 69 | ||||
72 |
||||
| 72 | ||||
| 83 | ||||
| 88 | ||||
| 102 | ||||
| 102 | ||||
| 105 | ||||
| 106 | ||||
| 106 | ||||
107 |
||||
| 107 | ||||
| 108 | ||||
| 108 | ||||
| 109 | ||||
110 |
||||
121 |
||||
| 121 | ||||
| 124 | ||||
125 |
||||
125 |
||||
133 |
||||
Enhanced Disclosure Task Force recommendations index |
136 |
|||
Caution regarding forward-looking statements |
Overview and outlook |
Selected financial and other highlights (1) |
Table 1 |
(Millions of Canadian dollars, except per share, number of and percentage amounts) |
2025 |
2024 | 2025 vs. 2024 Increase (decrease) |
|||||||||||||
Total revenue |
$ |
66,605 |
$ | 57,344 | $ |
9,261 |
16.1% |
|||||||||
Provision for credit losses (PCL) |
4,362 |
3,232 | 1,130 |
n.m. |
||||||||||||
Non-interest expense |
36,592 |
34,250 | 2,342 |
6.8% |
||||||||||||
Income before income taxes |
25,651 |
19,862 | 5,789 |
29.1% |
||||||||||||
Net income |
$ |
20,369 |
$ | 16,240 | $ |
4,129 |
25.4% |
|||||||||
Net income – adjusted (2), (3) |
$ |
20,870 |
$ | 17,430 | $ |
3,440 |
19.7% |
|||||||||
Segments – net income |
||||||||||||||||
Personal Banking |
$ |
7,105 |
$ | 5,921 | $ |
1,184 |
20.0% |
|||||||||
Commercial Banking |
3,020 |
2,818 | 202 |
7.2% |
||||||||||||
Wealth Management |
4,289 |
3,422 | 867 |
25.3% |
||||||||||||
Insurance |
828 |
729 | 99 |
13.6% |
||||||||||||
Capital Markets |
5,393 |
4,573 | 820 |
17.9% |
||||||||||||
Corporate Support |
(266 |
) |
(1,223 | ) | 957 |
n.m. |
||||||||||
Net income |
$ |
20,369 |
$ | 16,240 | $ |
4,129 |
25.4% |
|||||||||
Selected information |
||||||||||||||||
Earnings per share (EPS) – basic |
$ |
14.10 |
$ | 11.27 | $ |
2.83 |
25.1% |
|||||||||
– diluted |
14.07 |
11.25 | 2.82 |
25.1% |
||||||||||||
– basic adjusted (2), (3) |
14.46 |
12.11 | 2.35 |
19.4% |
||||||||||||
– diluted adjusted (2), (3) |
14.43 |
12.09 | 2.34 |
19.4% |
||||||||||||
Return on common equity (ROE) (3) |
16.3% |
14.4% | n.m. |
190 bps |
||||||||||||
ROE – adjusted (2), (3) |
16.7% |
15.5% | n.m. |
120 bps |
||||||||||||
Average common equity (4) |
$ |
122,050 |
$ | 110,650 | $ |
11,400 |
10.3% |
|||||||||
Net interest margin (NIM) – on average earning assets, net (3) |
1.62% |
1.54% | n.m. |
8 bps |
||||||||||||
PCL on loans as a % of average net loans and acceptances |
0.43% |
0.35% | n.m. |
8 bps |
||||||||||||
PCL on performing loans as a % of average net loans and acceptances |
0.06% |
0.07% | n.m. |
(1) bps |
||||||||||||
PCL on impaired loans as a % of average net loans and acceptances |
0.37% |
0.28% | n.m. |
9 bps |
||||||||||||
Gross impaired loans (GIL) as a % of loans and acceptances |
0.83% |
0.59% | n.m. |
24 bps |
||||||||||||
Liquidity coverage ratio (LCR) (3), (5) |
127% |
128% | n.m. |
(100) bps |
||||||||||||
Net stable funding ratio (NSFR) (3), (5) |
112% |
114% | n.m. |
(200) bps |
||||||||||||
Capital, Leverage and Total loss absorbing capacity (TLAC) ratios (3), (6) |
||||||||||||||||
Common Equity Tier 1 (CET1) ratio |
13.5% |
13.2% | n.m. |
30 bps |
||||||||||||
Tier 1 capital ratio |
15.1% |
14.6% | n.m. |
50 bps |
||||||||||||
Total capital ratio |
16.8% |
16.4% | n.m. |
40 bps |
||||||||||||
Leverage ratio |
4.4% |
4.2% | n.m. |
20 bps |
||||||||||||
TLAC ratio |
31.5% |
29.3% | n.m. |
220 bps |
||||||||||||
TLAC leverage ratio |
9.2% |
8.4% | n.m. |
80 bps |
||||||||||||
Selected balance sheet and other information (7) |
||||||||||||||||
Total assets |
$ |
2,325,006 |
$ | 2,171,582 | $ |
153,424 |
7.1% |
|||||||||
Securities, net of applicable allowance |
561,788 |
439,918 | 121,870 |
27.7% |
||||||||||||
Loans, net of allowance for loan losses |
1,042,422 |
981,380 | 61,042 |
6.2% |
||||||||||||
Derivative assets |
177,206 |
150,612 | 26,594 |
17.7% |
||||||||||||
Deposits |
1,515,616 |
1,409,531 | 106,085 |
7.5% |
||||||||||||
Common equity |
127,417 |
118,058 | 9,359 |
7.9% |
||||||||||||
Total risk-weighted assets (RWA) (3), (6) |
730,225 |
672,282 | 57,943 |
8.6% |
||||||||||||
Assets under management (AUM) (3) |
1,573,800 |
1,342,300 | 231,500 |
17.2% |
||||||||||||
Assets under administration (AUA) (3), (8) |
5,599,000 |
4,965,500 | 633,500 |
12.8% |
||||||||||||
Common share information |
||||||||||||||||
Shares outstanding (000s) – average basic |
1,409,072 |
1,411,903 | (2,831 |
) |
(0.2)% |
|||||||||||
– average diluted |
1,411,589 |
1,413,755 | (2,166 |
) |
(0.2)% |
|||||||||||
– end of period |
1,400,114 |
1,414,504 | (14,390 |
) |
(1.0)% |
|||||||||||
Dividends declared per common share |
$ |
6.04 |
$ | 5.60 | $ |
0.44 |
7.9% |
|||||||||
Dividend yield (3) |
3.4% |
3.9% | n.m. |
(50) bps |
||||||||||||
Dividend payout ratio (3) |
43% |
50% | n.m. |
(700) bps |
||||||||||||
Common share price (RY on TSX) (9) |
$ |
205.47 |
$ | 168.39 | $ |
37.08 |
22.0% |
|||||||||
Market capitalization (TSX) (9) |
287,681 |
238,188 | 49,493 |
20.8% |
||||||||||||
Business information |
||||||||||||||||
Employees (full-time equivalent) (FTE) |
96,628 |
94,838 | 1,790 |
1.9% |
||||||||||||
Bank branches |
1,263 |
1,292 | (29 |
) |
(2.2)% |
|||||||||||
Automated teller machines (ATMs) |
4,183 |
4,367 | (184 |
) |
(4.2)% |
|||||||||||
Period average US$ equivalent of C$1.00 (10) |
$ |
0.712 |
$ | 0.736 | $ |
(0.024 |
) |
(3.3)% |
||||||||
Period-end US$ equivalent of C$1.00 |
$ |
0.713 |
$ | 0.718 | $ |
(0.005 |
) |
(0.7)% |
||||||||
| (1) | On March 28, 2024, we completed the acquisition of HSBC Bank Canada (HSBC Canada transaction). HSBC Bank Canada (HSBC Canada) results have been consolidated from the closing date, and are included in our Personal Banking, Commercial Banking, Wealth Management and Capital Markets segments. |
| (2) | These are non-GAAP measures or ratios. For further details, including a reconciliation, refer to the Key performance and non-GAAP measures section. |
| (3) | See Glossary for composition of these measures. |
| (4) | Average amounts are calculated using methods intended to approximate the average of the daily balances for the period. |
| (5) | The LCR and NSFR are calculated in accordance with the Office of the Superintendent of Financial Institutions’ (OSFI) Liquidity Adequacy Requirements (LAR) guideline. LCR is the average for the three months ended for each respective period. For further details, refer to the Liquidity and funding risk section. |
| (6) | Capital ratios and RWA are calculated using OSFI’s Capital Adequacy Requirements (CAR) guideline, the Leverage ratio is calculated using OSFI’s Leverage Requirements (LR) guideline, and both the TLAC and TLAC leverage ratios are calculated using OSFI’s TLAC guideline. Both the CAR guideline and LR guideline are based on the Basel III framework. For further details, refer to the Capital management section. |
| (7) | Represents period-end spot balances. |
| (8) | AUA includes $15 billion and $5 billion (2024 – $15 billion and $6 billion) of securitized residential mortgages and credit card loans, respectively. |
| (9) | Based on TSX closing market price at period-end. |
| (10) | Average amounts are calculated using month-end spot rates for the period. |
| n.m. | not meaningful |
About Royal Bank of Canada |
Personal Banking |
Provides a broad suite of financial products and services to retail clients in Canada, the Caribbean and the U.S. Our commitment to building and maintaining deep and meaningful relationships with our clients is underscored by the delivery of exceptional client experiences, the breadth of our product suite, our depth of expertise and the features of our digital solutions. | |
Commercial Banking |
Serves the end-to-end | |
Wealth Management |
Primarily serves affluent, high-net-worth (HNW) and ultra-high-net-worth (UHNW) clients from our offices in key financial centres across the globe. We offer a comprehensive suite of wealth, investment, trust, banking, credit and other solutions to this client segment. We also provide a self-directed investment service in Canada, as well as asset management products globally to institutional and individual clients through our distribution channels and third-party distributors. We offer asset services and investor services to financial institutions, asset managers and asset owners in Canada. | |
Insurance |
Offers a comprehensive suite of advice and solutions for individual and business clients including life, health, wealth solutions, property & casualty, travel, group benefits, longevity reinsurance and reinsurance solutions for creditor products. We provide tailored, client-led advice and solutions, harnessing the power of technology and data and leveraging the strength and scale of the RBC® enterprise as our competitive advantage. | |
Capital Markets |
Provides expertise in advisory & origination, sales & trading, lending & financing and transaction banking to corporate, institutional, sponsor and government clients globally. We serve these clients from 55 offices in 16 countries across North America, the U.K. & Europe, Australia, Asia and other regions. |
Vision and strategic goals |
| • | In Canada, to be the undisputed leader in financial services; |
| • | In the U.S., to be the preferred partner to institutional, corporate, commercial and HNW clients and their businesses; and |
| • | In select global financial centres, to be a leading financial services partner valued for our expertise. |
Economic, market and regulatory review and outlook – data as at December 2, 2025 |
Defining and measuring success |
Financial performance compared to our medium-term objectives |
Table 2 |
Medium-term objectives (1), (2) |
3-year (3) |
5-year (3) |
||||||||||
Diluted EPS growth of 7% + |
8% |
13% |
||||||||||
ROE of 16% + |
15.0% |
16.0% |
||||||||||
Strong capital ratio (CET1) (4) |
13.8% |
13.5% |
||||||||||
Dividend payout ratio 40% – 50% |
48% |
46% |
||||||||||
| (1) | A medium-term (3-5 year) objective is considered to be achieved when the performance goal is met in either a 3- or 5-year period. These objectives assume a normal business environment and our ability to achieve them in a period may be adversely affected by the macroeconomic backdrop and the cyclical nature of the credit cycle. |
| (2) | Our financial performance reflects the impact of specified items and the amortization of acquisition related intangibles. |
| (3) | Diluted EPS growth is calculated using a Compound Annual Growth Rate (CAGR). ROE, CET1 and dividend payout ratio are calculated using an average. |
| (4) | The CET1 ratio is calculated using OSFI’s CAR guideline. For further details on the CET1 ratio, refer to the Capital management section. |
| • | Canadian financial institutions: |
| • | U.S. banks: |
| • | International banks: |
Medium-term objectives – 3- and 5-year TSR vs. peer group average |
Table 3 |
3-year TSR (1) |
5-year TSR (1) |
|||||||
Royal Bank of Canada |
22% | 22% | ||||||
| Bottom half | Bottom half | |||||||
Peer group average (excluding RBC) |
26% | 25% | ||||||
| (1) | The 3- and 5-year annualized TSR are calculated based on our common share price appreciation as per the TSX closing market price plus reinvested dividends for the period October 31, 2022 to October 31, 2025 and October 31, 2020 to October 31, 2025. |
Common share and dividend information |
Table 4 |
For the year ended October 31 |
2025 |
2024 | 2023 | 2022 | 2021 | |||||||||||||||
Common share price (RY on TSX) – close, end of period |
$ |
205.47 |
$ | 168.39 | $ 110.76 | $ | 126.05 | $ | 128.82 | |||||||||||
Dividends paid per share |
6.04 |
5.60 | 5.34 | 4.96 | 4.32 | |||||||||||||||
Increase (decrease) in share price |
22.0% |
52.0% | (12.1)% | (2.2)% | 38.3% | |||||||||||||||
Total shareholder return |
26.2% |
57.8% | (8.3)% | 1.6% | 43.8% | |||||||||||||||
Financial performance |
Overview |
Impact of foreign currency translation |
Table 5 |
||||
(Millions of Canadian dollars, except per share amounts) |
2025 vs. 2024 |
|||
Increase (decrease): |
||||
Total revenue |
$ |
1,022 |
||
PCL |
33 |
|||
Non-interest expense |
592 |
|||
Income taxes |
43 |
|||
Net income |
354 |
|||
Impact on EPS |
||||
Basic |
$ |
0.25 |
||
Diluted |
0.25 |
|||
Table 6 |
(Average foreign currency equivalent of C$1.00) (1) |
2025 |
2024 | ||||||
U.S. dollar |
0.712 |
0.736 | ||||||
British pound |
0.545 |
0.575 | ||||||
Euro |
0.641 |
0.677 | ||||||
| (1) | Average amounts are calculated using month-end spot rates for the period. |
Total revenue |
Table 7 |
(Millions of Canadian dollars, except percentage amounts) |
2025 |
2024 | ||||||
Interest and dividend income |
$ |
103,825 |
$ | 104,951 | ||||
Interest expense |
70,825 |
76,998 | ||||||
Net interest income |
$ |
33,000 |
$ | 27,953 | ||||
NIM |
1.62% |
1.54% | ||||||
Insurance service result |
$ |
867 |
$ | 777 | ||||
Insurance investment result |
284 |
294 | ||||||
Trading revenue |
3,125 |
2,327 | ||||||
Investment management and custodial fees |
10,647 |
9,325 | ||||||
Mutual fund revenue |
5,084 |
4,437 | ||||||
Securities brokerage commissions |
1,905 |
1,660 | ||||||
Service charges |
2,425 |
2,294 | ||||||
Underwriting and other advisory fees |
2,899 |
2,672 | ||||||
Foreign exchange revenue, other than trading |
1,301 |
1,142 | ||||||
Card service revenue |
1,333 |
1,273 | ||||||
Credit fees |
1,670 |
1,592 | ||||||
Net gains on investment securities |
120 |
170 | ||||||
Income (loss) from joint ventures and associates |
73 |
(16 | ) | |||||
Other |
1,872 |
1,444 | ||||||
Non-interest income |
$ |
33,605 |
$ | 29,391 | ||||
Total revenue |
$ |
66,605 |
$ | 57,344 | ||||
Table 8 |
(Millions of Canadian dollars) |
2025 |
2024 | ||||||
Net interest income (1) |
$ |
2,335 |
$ | 1,742 | ||||
Non-interest income |
3,125 |
2,327 | ||||||
Total trading revenue |
$ |
5,460 |
$ | 4,069 | ||||
Total trading revenue by product |
||||||||
Interest rate and credit |
$ |
2,773 |
$ | 2,371 | ||||
Equities |
1,492 |
817 | ||||||
Foreign exchange and commodities |
1,195 |
881 | ||||||
Total trading revenue |
$ |
5,460 |
$ | 4,069 | ||||
| (1) | Reflects net interest income arising from trading-related positions, including assets and liabilities that are classified or designated at fair value through profit or loss (FVTPL). |
Provision for credit losses (1) |
Table 9 |
| For the year ended | ||||||||
(Millions of Canadian dollars, except percentage amounts) |
October 31 2025 |
October 31 2024 |
||||||
Personal Banking |
$ |
359 |
$ | 399 | ||||
Commercial Banking |
314 |
260 | ||||||
Wealth Management |
(8 |
) |
(119 | ) | ||||
Capital Markets |
(43 |
) |
86 | |||||
Corporate Support and other (2) |
– |
1 | ||||||
PCL on performing loans |
622 |
627 | ||||||
Personal Banking |
$ |
1,757 |
$ | 1,418 | ||||
Commercial Banking |
1,236 |
714 | ||||||
Wealth Management |
128 |
148 | ||||||
Capital Markets |
613 |
340 | ||||||
Corporate Support and other |
– |
– | ||||||
PCL on impaired loans (2) |
3,734 |
2,620 | ||||||
PCL – Loans |
4,356 |
3,247 | ||||||
PCL – Other (3) |
6 |
(15 | ) | |||||
Total PCL |
$ |
4,362 |
$ | 3,232 | ||||
PCL on loans is comprised of: |
||||||||
Retail |
$ |
436 |
$ | 414 | ||||
Wholesale |
186 |
213 | ||||||
PCL on performing loans |
622 |
627 | ||||||
Retail |
1,961 |
1,586 | ||||||
Wholesale |
1,773 |
1,034 | ||||||
PCL on impaired loans |
3,734 |
2,620 | ||||||
PCL – Loans |
$ |
4,356 |
$ | 3,247 | ||||
PCL on loans as a % of average net loans and acceptances |
0.43% |
0.35% | ||||||
PCL on impaired loans as a % of average net loans and acceptances |
0.37% |
0.28% | ||||||
| (1) | Information on loans represents loans, acceptances and commitments. |
| (2) | Includes PCL recorded in Corporate Support and Insurance. |
| (3) | PCL – Other includes amounts related to debt securities measured at fair value through other comprehensive income (FVOCI) and amortized cost, accounts receivable, and financial and purchased guarantees. |
Non-interest expense |
Table 10 |
(Millions of Canadian dollars, except percentage amounts) |
2025 |
2024 | ||||||
Salaries |
$ |
9,426 |
$ | 8,878 | ||||
Variable compensation |
9,983 |
8,838 | ||||||
Benefits and retention compensation |
2,711 |
2,408 | ||||||
Share-based compensation |
1,002 |
959 | ||||||
Human resources |
23,122 |
21,083 | ||||||
Equipment |
2,790 |
2,537 | ||||||
Occupancy |
1,679 |
1,805 | ||||||
Communications |
1,497 |
1,369 | ||||||
Professional fees |
2,177 |
2,525 | ||||||
Amortization of other intangibles |
1,759 |
1,549 | ||||||
Other |
3,568 |
3,382 | ||||||
Non-interest expense |
$ |
36,592 |
$ | 34,250 | ||||
Efficiency ratio (1) |
54.9% |
59.7% | ||||||
Efficiency ratio – adjusted (1), (2) |
54.0% |
57.1% | ||||||
| (1) | See Glossary for composition of these measures. |
| (2) | This is a non-GAAP ratio. For further details, including a reconciliation, refer to the Key performance and non-GAAP measures section. |
Income and other taxes |
Table 11 |
(Millions of Canadian dollars, except percentage amounts) |
2025 |
2024 | ||||||
Income taxes |
$ |
5,282 |
$ | 3,622 | ||||
Other taxes |
||||||||
Value added and sales taxes |
724 |
680 | ||||||
Payroll taxes |
1,183 |
1,060 | ||||||
Capital taxes |
36 |
47 | ||||||
Property taxes |
160 |
155 | ||||||
Insurance premium taxes |
47 |
45 | ||||||
Business taxes |
99 |
61 | ||||||
2,249 |
2,048 | |||||||
Total income and other taxes |
$ |
7,531 |
$ | 5,670 | ||||
Income before income taxes |
$ |
25,651 |
$ | 19,862 | ||||
Effective income tax rate |
20.6% |
18.2% | ||||||
Effective total tax rate (1) |
27.0% |
25.9% | ||||||
Adjusted results (2), (3) |
||||||||
Income taxes – adjusted |
$ |
5,436 |
$ | 3,984 | ||||
Income before income taxes – adjusted |
26,306 |
21,414 | ||||||
Effective income tax rate – adjusted |
20.7% |
18.6% | ||||||
| (1) | Total income and other taxes as a percentage of income before income taxes and other taxes. |
| (2) | These are non-GAAP measures. For further details, including a reconciliation, refer to the Key performance and non-GAAP measures section. |
| (3) | See Glossary for composition of these measures. |
Client assets |
AUA by geographic mix and asset class |
Table 12 |
(Millions of Canadian dollars) |
2025 |
2024 | ||||||
Canada (1) |
||||||||
Money market |
$ |
42,400 |
$ | 32,800 | ||||
Fixed income |
823,800 |
784,600 | ||||||
Equity |
968,800 |
701,800 | ||||||
Multi-asset and other |
1,554,300 |
1,458,300 | ||||||
Total Canada |
3,389,300 |
2,977,500 | ||||||
U.S. (1) |
||||||||
Money market |
35,300 |
36,600 | ||||||
Fixed income |
144,500 |
144,600 | ||||||
Equity |
387,200 |
335,900 | ||||||
Multi-asset and other |
515,700 |
432,900 | ||||||
Total U.S. |
1,082,700 |
950,000 | ||||||
Other International (1) |
||||||||
Money market |
25,400 |
19,200 | ||||||
Fixed income |
152,000 |
130,800 | ||||||
Equity |
507,300 |
425,600 | ||||||
Multi-asset and other |
442,300 |
462,400 | ||||||
Total International |
1,127,000 |
1,038,000 | ||||||
Total AUA |
$ |
5,599,000 |
$ | 4,965,500 | ||||
| (1) | Geographic information is based on the location from where our clients are serviced. |
Client assets – AUM |
Table 13 | |||
2025 |
2024 | |||||||||||||||||||||||||||
(Millions of Canadian dollars) |
Money market |
Fixed income |
Equity |
Multi-asset and other |
Total |
Total | ||||||||||||||||||||||
AUM, beginning balance (1) |
$ |
62,800 |
$ |
281,300 |
$ |
183,900 |
$ |
814,300 |
$ |
1,342,300 |
$ | 1,067,500 | ||||||||||||||||
Institutional inflows |
233,900 |
57,000 |
12,400 |
9,100 |
312,400 |
318,400 | ||||||||||||||||||||||
Institutional outflows |
(218,800 |
) |
(51,400 |
) |
(12,900 |
) |
(5,000 |
) |
(288,100 |
) |
(295,500 | ) | ||||||||||||||||
Personal flows, net |
1,800 |
5,000 |
4,200 |
24,700 |
35,700 |
19,800 | ||||||||||||||||||||||
Total net flows |
16,900 |
10,600 |
3,700 |
28,800 |
60,000 |
42,700 | ||||||||||||||||||||||
Market impact |
800 |
17,900 |
30,200 |
112,300 |
161,200 |
201,900 | ||||||||||||||||||||||
Acquisition/dispositions |
– |
– |
– |
– |
– |
20,600 | ||||||||||||||||||||||
Foreign exchange |
500 |
2,600 |
200 |
7,000 |
10,300 |
9,600 | ||||||||||||||||||||||
Total market, acquisition/dispositions and foreign exchange impact |
1,300 |
20,500 |
30,400 |
119,300 |
171,500 |
232,100 | ||||||||||||||||||||||
AUM, balance at end of year |
$ |
81,000 |
$ |
312,400 |
$ |
218,000 |
$ |
962,400 |
$ |
1,573,800 |
$ | 1,342,300 | ||||||||||||||||
| (1) | The amounts in the respective categories have been revised from those previously presented. |
Business segment results |
Results by business segments |
Table 14 |
2025 |
2024 | |||||||||||||||||||||||||||||||||||
(Millions of Canadian dollars, except percentage amounts) |
Personal Banking (1) |
Commercial Banking (1) |
Wealth Management (1) |
Insurance |
Capital Markets (1), (2) |
Corporate Support (2) |
Total |
Total | ||||||||||||||||||||||||||||
Net interest income |
$ |
14,496 |
$ |
7,268 |
$ |
5,459 |
$ |
– |
$ |
4,789 |
$ |
988 |
$ |
33,000 |
$ | 27,953 | ||||||||||||||||||||
Non-interest income |
5,358 |
1,294 |
16,919 |
1,321 |
9,637 |
(924 |
) |
33,605 |
29,391 | |||||||||||||||||||||||||||
Total revenue |
19,854 |
8,562 |
22,378 |
1,321 |
14,426 |
64 |
66,605 |
57,344 | ||||||||||||||||||||||||||||
PCL |
2,105 |
1,550 |
120 |
– |
587 |
– |
4,362 |
3,232 | ||||||||||||||||||||||||||||
Non-interest expense |
8,001 |
2,833 |
16,769 |
315 |
7,966 |
708 |
36,592 |
34,250 | ||||||||||||||||||||||||||||
Income before income taxes |
9,748 |
4,179 |
5,489 |
1,006 |
5,873 |
(644 |
) |
25,651 |
19,862 | |||||||||||||||||||||||||||
Income taxes |
2,643 |
1,159 |
1,200 |
178 |
480 |
(378 |
) |
5,282 |
3,622 | |||||||||||||||||||||||||||
Net income |
$ |
7,105 |
$ |
3,020 |
$ |
4,289 |
$ |
828 |
$ |
5,393 |
$ |
(266 |
) |
$ |
20,369 |
$ | 16,240 | |||||||||||||||||||
ROE (3) |
24.9% |
14.9% |
16.6% |
40.7% |
13.7% |
n.m. |
16.3% |
14.4% | ||||||||||||||||||||||||||||
Average assets |
$ |
563,500 |
$ |
192,200 |
$ |
188,400 |
$ |
31,000 |
$ |
1,326,300 |
$ |
97,000 |
$ |
2,398,400 |
$ | 2,108,500 | ||||||||||||||||||||
| (1) | On March 28, 2024, we completed the HSBC Canada transaction. HSBC Canada results have been consolidated from the closing date, and are included in our Personal Banking, Commercial Banking, Wealth Management and Capital Markets segments. |
| (2) | Net interest income, non-interest income, total revenue, income before income taxes and income taxes are presented in Capital Markets on a taxable equivalent basis (teb). The teb adjustment is eliminated in the Corporate Support segment. For a further discussion, refer to the How we measure and report our business segments section. |
| (3) | For further details, refer to the Key performance and non-GAAP measures section. |
| n.m. | not meaningful |
How we measure and report our business segments |
| • | Wealth Management results include disclosure in U.S. dollars, primarily for U.S. Wealth Management (including City National Bank (“City National”)) as we review and manage the results of this business largely in this currency. |
| • | Capital Markets results are reported on a teb basis, which grosses up total revenue from certain tax-advantaged sources (U.S. tax credit business and Canadian taxable corporate dividends received on or before December 31, 2023) to their effective taxable equivalent value with a corresponding offset recorded in income taxes. We record the elimination of the teb adjustments in Corporate Support. We believe these adjustments are useful and reflect how Capital Markets manages its business, since it enhances the comparability of revenue and related ratios across taxable revenue and our principal tax-advantaged sources of revenue. The use of teb adjustments and measures may not be comparable to similar GAAP measures or similarly adjusted amounts disclosed by other financial institutions. |
| • | Corporate Support results include all enterprise level activities that are undertaken for the benefit of the organization that are not allocated to our five business segments, such as certain liquidity and cash management activities, including amounts associated with unattributed capital, and consolidation adjustments, including the elimination of the teb gross-up amounts. In addition, we record gains (losses) on economic hedges of our U.S. Wealth Management (including City National) share-based compensation plans, which are reflected in revenue, and related variability in share-based compensation expense driven by changes in the fair value of liabilities relating to these plans in Corporate Support as we believe this presentation more closely aligns with how we view business performance and manage the underlying risks. |
Key performance and non-GAAP measures |
Calculation of ROE |
Table 15 |
2025 |
2024 |
|||||||||||||||||||||||||||||||||||
(Millions of Canadian dollars, except percentage amounts) |
Personal Banking (3) |
Commercial Banking (3) |
Wealth Management (3) |
Insurance |
Capital Markets (3) |
Corporate Support |
Total |
Total | ||||||||||||||||||||||||||||
Net income available to common shareholders |
$ |
6,985 |
$ |
2,940 |
$ |
4,187 |
$ |
820 |
$ |
5,244 |
$ |
(308 |
) |
$ |
19,868 |
$ | 15,908 | |||||||||||||||||||
Total average common equity (1), (2) |
28,100 |
19,650 |
25,200 |
2,000 |
38,350 |
8,750 |
122,050 |
110,650 | ||||||||||||||||||||||||||||
ROE |
24.9% |
14.9% |
16.6% |
40.7% |
13.7% |
n.m. |
16.3% |
14.4% | ||||||||||||||||||||||||||||
| (1) | Total average common equity represents rounded figures. |
| (2) | The amounts for the segments are referred to as attributed capital. |
| (3) | Effective the first quarter of 2025, we increased our capital attribution rates. For further details, refer to the How we measure and report our business segments section. |
| n.m. | not meaningful |
| • | HSBC Canada transaction and integration costs. Effective the third quarter of 2025, we no longer treated HSBC Canada transaction and integration costs as a specified item. Integration activities have been completed. |
| • | Management of closing capital volatility related to the HSBC Canada transaction. |
Table 16 |
(Millions of Canadian dollars, except per share, number of and percentage amounts) |
2025 |
2024 | ||||||
Total revenue |
$ |
66,605 |
$ | 57,344 | ||||
PCL |
4,362 |
3,232 | ||||||
Non-interest expense |
36,592 |
34,250 | ||||||
Income before income taxes |
25,651 |
19,862 | ||||||
Income taxes |
5,282 |
3,622 | ||||||
Net income |
$ |
20,369 |
$ | 16,240 | ||||
Net income available to common shareholders |
$ |
19,868 |
$ | 15,908 | ||||
Average number of common shares (thousands) |
1,409,072 |
1,411,903 | ||||||
Basic earnings per share (in dollars) |
$ |
14.10 |
$ | 11.27 | ||||
Average number of diluted common shares (thousands) |
1,411,589 |
1,413,755 | ||||||
Diluted earnings per share (in dollars) |
$ |
14.07 |
$ | 11.25 | ||||
ROE |
16.3% |
14.4% | ||||||
Effective income tax rate |
20.6% |
18.2% | ||||||
Total adjusting items impacting net income (before-tax) |
$ |
655 |
$ | 1,552 | ||||
Specified item: HSBC Canada transaction and integration costs (1), (2) |
43 |
960 | ||||||
Specified item: Management of closing capital volatility related to the HSBC Canada transaction (1) |
– |
131 | ||||||
Amortization of acquisition-related intangibles (3) |
612 |
461 | ||||||
Total income taxes for adjusting items impacting net income |
$ |
154 |
$ | 362 | ||||
Specified item: HSBC Canada transaction and integration costs (1) |
13 |
201 | ||||||
Specified item: Management of closing capital volatility related to the HSBC Canada transaction (1) |
– |
36 | ||||||
Amortization of acquisition-related intangibles (3) |
141 |
125 | ||||||
Adjusted results |
||||||||
Income before income taxes – adjusted |
$ |
26,306 |
$ | 21,414 | ||||
Income taxes – adjusted |
5,436 |
3,984 | ||||||
Net income – adjusted |
20,870 |
17,430 | ||||||
Net income available to common shareholders – adjusted (4) |
20,369 |
17,098 | ||||||
Average number of common shares (thousands) |
1,409,072 |
1,411,903 | ||||||
Basic earnings per share (in dollars) – adjusted |
$ |
14.46 |
$ | 12.11 | ||||
Average number of diluted common shares (thousands) |
1,411,589 |
1,413,755 | ||||||
Diluted earnings per share (in dollars) – adjusted |
$ |
14.43 |
$ | 12.09 | ||||
ROE – adjusted |
16.7% |
15.5% | ||||||
Effective income tax rate – adjusted |
20.7% |
18.6% | ||||||
Adjusted efficiency ratio |
||||||||
Total revenue |
$ |
66,605 |
$ | 57,344 | ||||
Add specified item: Management of closing capital volatility related to the HSBC Canada transaction (before-tax) (1) |
– |
131 | ||||||
Total revenue – adjusted (4) |
$ |
66,605 |
$ | 57,475 | ||||
Non-interest expense |
$ |
36,592 |
$ | 34,250 | ||||
Less specified item: HSBC Canada transaction and integration costs (before-tax) (1) |
43 |
960 | ||||||
Less: Amortization of acquisition-related intangibles (before-tax) (3) |
612 |
461 | ||||||
Non-interest expense – adjusted (4) |
$ |
35,937 |
$ | 32,829 | ||||
Efficiency ratio |
54.9% |
59.7% | ||||||
Efficiency ratio – adjusted |
54.0% |
57.1% | ||||||
| (1) | These amounts have been recognized in Corporate Support. |
| (2) | As at October 31, 2025, the cumulative HSBC Canada transaction and integration costs (before-tax) incurred were $1.4 billion. Effective the third quarter of 2025, we no longer treated HSBC Canada transaction and integration costs as a specified item. Integration activities have been completed. |
| (3) | Represents the impact of amortization of acquisition-related intangibles (excluding amortization of software), and any goodwill impairment. |
| (4) | See Glossary for composition of these measures. |
Personal Banking |
~15 million |
#1 |
32,335 | ||||||
Number of Personal Banking – Canada clients |
Ranking in market share for all key retail products 1 |
Employees (FTE) 2 | ||||||
Revenue by Business Lines |
We operate through two businesses – Personal Banking – Canada and Caribbean & U.S. Banking. Personal Banking – Canada serves our home market in Canada. We have the largest branch network, the most ATMs and one of the largest mobile sales forces across Canada, along with market-leading digital capabilities. In Caribbean & U.S. Banking, we offer a broad range of financial products and services in targeted markets. In Canada, we compete with other Schedule 1 banks, independent trust companies, foreign banks, credit unions, caisses populaires and auto financing companies, as well as emerging entrants to the financial services industry. In the Caribbean, our competition includes banks, emerging digital banks, trust companies and investment management companies serving retail and corporate clients, as well as public institutions. In the U.S., we compete primarily with other Canadian banking institutions that have U.S. operations. | |||||||
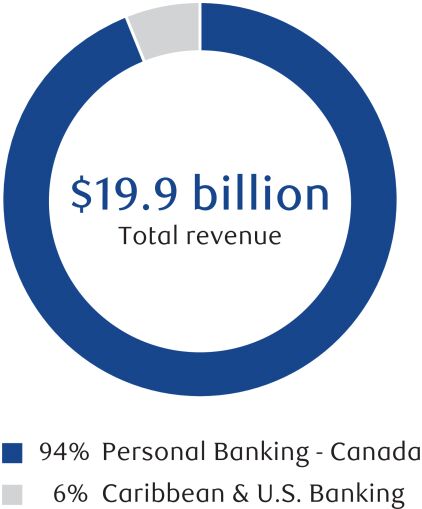 |
||||||||
› |
Amidst a lower inflationary environment, the BoC overnight interest rate has decreased significantly through a series of interest rate cuts since June 2024. This has been accompanied by a shift in deposit mix towards demand deposits, which has contributed to our continued increase in NIM throughout fiscal 2025. |
› |
Residential real estate markets continued to be impacted by softening demand throughout 2025, driven by the imposition of tariffs from the U.S. administration as well as general macroeconomic uncertainty. Despite slower mortgage volume growth, mortgage originations were up from the prior year. |
› |
In an environment where a higher cost of living and economic uncertainty continue to weigh on consumer spending, consumers are displaying cautious spending habits. Despite these financial pressures, overall credit card purchase volumes continued to grow from the prior year. |
› |
We recorded growth in non-term deposit products, reflecting a shift in client preference away from term deposit products, as BoC interest rates have decreased. We also maintained our number one market share position in Personal Core Deposits and Guaranteed Investments Certificates (GICs). |
› |
Favourable equity market conditions throughout the majority of fiscal 2025 and client sales activity have driven higher average mutual fund balances. |
› |
The credit environment was impacted by rising unemployment rates, slowing economic growth and the impacts of trade disruptions, resulting in higher provisions on impaired and performing loans. |
› |
We continued to focus on investments in staff along with ongoing investments in technology, including in AI and digital transformation. |
› |
The Caribbean region’s economy continued to expand at a healthy pace in 2025, with the inflation rate in the region remaining low as the impacts of higher import costs fueled by tariffs are yet to have a downstream impact on consumers. Our Caribbean Banking business benefitted from strong volume growth in both loans and deposits as we continued to invest in growing the franchise. |
› |
The U.S. Banking business benefitted from continued loan and deposit growth and the sustained level of higher U.S. interest rates, despite uncertainty associated with U.S. trade policy and a decline in Canadian travel to the U.S. |
1 |
Market share is calculated using the most current data available from OSFI (M4), the Securities and Investment Management Association (SIMA) and the Canadian Bankers Association (CBA), and is as at August 2025 and June 2025. This is based on the following key product categories: Personal Lending (including residential mortgages), Personal Core Deposits and GICs, Credit Cards and Long-term Mutual Funds. |
2 |
Includes FTE for all shared services across Personal Banking and Commercial Banking, for which the related non-interest expenses are allocated to both Personal Banking and Commercial Banking. |
OUR STRATEGY |
PROGRESS IN 2025 |
PRIORITIES IN 2026 | ||
Enhance client value proposition by providing exceptional value and reciprocity |
Received the highest ranking in customer satisfaction for a second consecutive year in the J.D. Power 2025 Canada Retail Banking Satisfaction Study Avion Rewards ® was recognized for a third consecutive year as the International Loyalty Program of the Year (Americas) at the 2025 International Loyalty Awards. The award recognizes the highest level of excellence and innovation in loyalty programs on a global scale. Avion Rewards also won top honors at the 2025 Loyalty360 Awards, recognizing the program’s creative campaigns and data analytics innovationsAnnounced several strategic partnerships and enhancements to expand our loyalty and credit card offerings. These include a linked loyalty partnership with Canadian Tire Corporation that links eligible RBC cards and Triangle Rewards ‡ co-branded credit cards and a linked loyalty partnership with Pattison Food Group to offer exclusive everyday savings to clients and allow them to earn more rewards on grocery purchases. We also launched enhancements that enabled WestJet‡ ‡ ‡ ‡ Introduced credit at account opening under the RBC Newcomer Advantage ® program and continued to engage HSBC Canada clients through proactive marketing initiativesExpanded access to no-cost banking accounts1 for Indigenous Peoples in Canada as well as anyone aged 24 and under, including non-students |
Continue to build a suite of best-in-class Focus on engaging key high-growth client segments with superior advice and empower our advisors to build new and deeper relationships to drive industry-leading volume growth Continue to support retail clients in achieving their climate-related value propositions, including building upon our existing portfolio of products, services and advice Continue to support the financial wellbeing of Canadians through dedicated products, services and advice | ||
Optimize channels by servicing clients through unparalleled access and convenience |
Won 10 Ipsos 2025 Financial Service Excellence Awards among the Big 5 banks, including four solo wins in “Recommend to Friends or Family (Net Promoter Score)”, “Financial Planning & Advice”, “ATM Banking Excellence” and “Online Banking Excellence” Enabled clients to open GICs or Registered Savings products through their mobile devices. Clients can now open, purchase and set-up pre-authorized contributions for Tax-free Savings Accounts and Registered Retirement Savings Plans through their mobile devicesLaunched an easier and faster mortgage renewal process for clients through a new streamlined, self-serve option in the RBC Mobile app. Eligible clients can now seamlessly and securely renew their RBC mortgage from wherever is most convenient for them Increased advisor sales power by digitizing low-complexity tasks, leveraging alternate channels for simpler servicing and expanding our remote sales centres |
Continue to deliver leading digital capabilities and functionality through our mobile app Continue to reimagine our branch network to meet the evolving needs of our clients Deliver anytime, anywhere solutions to our clients across all channels Upskill our expert advisor network to deliver more personalized insights and address complex advice needs | ||
Leverage AI and hyper-personalization to create personalized client experiences, improve efficiency and manage risk |
Scaled our proprietary AI foundation model for financial services, ATOM ™ (Asynchronous Temporal Model), which enables the bank to leverage unique insights and develop innovative solutions within a responsible AI framework that meets regulatory requirements. ATOM has enhanced our credit adjudication capabilities, enabling better assessment of client needs and ability to pay. In addition, it has enhanced our ability to provide personalized recommendations, which are applied in our Avion® Redemption Newsletter, allowing us to streamline offerings to our membersDeployed GenAI solutions in our Advice Centre to support advisors with a number of tasks, from faster access to knowledge and insights to executing activities on their behalf, saving the advisor time to focus on clients |
Further scale ATOM in-market to hyper-personalize client interactions across all client touchpoints, leveraging offers across RBC’s product shelf and insights on client behaviours and anticipating servicing needs to create substantially deeper relationships with existing RBC clientsDeploy agentic capabilities through our enterprise GenAI platform to enable more automation across workflows and enable AI to surface unique insights from our data assets | ||
1 |
This expanded access has in part been made available through RBC’s adherence to recent enhancements to voluntary Commitment on Low-Cost and No-Cost Accounts, which came into effect on December 1, 2025. |
OUR STRATEGY |
PROGRESS IN 2025 |
PRIORITIES IN 2026 | ||
Attract, grow and retain future-ready talent |
Empowered teams to deliver against our strategy by transforming our Personal Banking organizational structure to align teams against our biggest growth opportunities Supported development of talent through targeted employee moves to new and/or expanded roles to develop in-demand skills and build key capabilities for the futureContinued leadership development through various enterprise and business segment programs, including leadership summits, strategy seminars and people manager enablement programs such as webinars, workshops and learning programs Further strengthened our culture of inclusion and belonging by engaging employee participation in key global enterprise events and Employee Resource Groups |
Build critical future skills through targeted development experiences for leaders and employees aligned to our bold ambitions Inspire and enable teams to achieve ambitious outcomes and high-performance Develop and coach leaders to champion transformation and growth and foster a client-focused culture Empower our leaders and employees through AI to reimagine what’s possible and accelerate innovation | ||
In the Caribbean |
Progressed and accelerated key initiatives including data transformation, product innovation and streamlining regulatory compliance by digitizing our processes, expanding products and prioritizing resources to modernize and simplify our business and deliver an enhanced client and employee experience |
Continue to deepen our focus in growth segments, while maintaining momentum in operational excellence by accelerating digital and process modernization and further aligning our business model to deliver differentiated value for clients and employees | ||
In the U.S. |
Continued to enable new client onboarding and cross-border banking through deeper integration with Canadian franchise product, channel and marketing strategies Continued to develop digital capabilities and automation to enhance scalability, further integrate our products, simplify processes and improve the client experience |
Further align with Canadian value proposition, product strategies and channel experiences to drive new client acquisition and anchor existing relationships Continue the transformation of sales and service channels to improve productivity and streamline client acquisition and servicing processes | ||
Personal Banking (1) |
Table 17 |
(Millions of Canadian dollars, except percentage amounts and as otherwise noted) |
2025 |
2024 | ||||||
Net interest income |
$ |
14,496 |
$ | 12,438 | ||||
Non-interest income |
5,358 |
4,904 | ||||||
Total revenue |
19,854 |
17,342 | ||||||
PCL on performing assets |
358 |
392 | ||||||
PCL on impaired assets |
1,747 |
1,410 | ||||||
PCL |
2,105 |
1,802 | ||||||
Non-interest expense |
8,001 |
7,485 | ||||||
Income before income taxes |
9,748 |
8,055 | ||||||
Net income |
$ |
7,105 |
$ | 5,921 | ||||
Revenue by business |
||||||||
Personal Banking – Canada |
$ |
18,593 |
$ | 16,206 | ||||
Caribbean & U.S. Banking |
1,261 |
1,136 | ||||||
Key ratios |
||||||||
ROE |
24.9% |
24.8% | ||||||
NIM |
2.66% |
2.43% | ||||||
Efficiency ratio |
40.3% |
43.2% | ||||||
Operating leverage (2) |
7.6% |
2.2% | ||||||
Selected balance sheet information |
||||||||
Average total assets |
$ |
563,500 |
$ | 528,200 | ||||
Average total earning assets, net |
545,900 |
512,300 | ||||||
Average loans and acceptances, net |
535,600 |
502,700 | ||||||
Average deposits |
437,800 |
404,600 | ||||||
Other information |
||||||||
AUA (3), (4) |
$ |
288,500 |
$ | 255,400 | ||||
Average AUA |
267,400 |
235,500 | ||||||
AUM (4) |
6,100 |
6,400 | ||||||
Number of employees (FTE) (5) |
32,335 |
38,642 | ||||||
Credit information |
||||||||
PCL on impaired loans as a % of average net loans and acceptances |
0.33% |
0.28% | ||||||
Other selected information – Personal Banking – Canada |
||||||||
Net income |
$ |
6,717 |
$ | 5,550 | ||||
NIM |
2.58% |
2.35% | ||||||
Efficiency ratio |
38.8% |
41.6% | ||||||
Operating leverage |
7.5% |
2.3% | ||||||
| (1) | On March 28, 2024, we completed the HSBC Canada transaction. HSBC Canada results have been consolidated from the closing date, which impacted results, balances and ratios for all reported periods. |
| (2) | See Glossary for composition of this measure. |
| (3) | AUA includes securitized residential mortgages and credit card loans as at October 31, 2025 of $15 billion and $5 billion, respectively (October 31, 2024 – $15 billion and $6 billion). |
| (4) | Represents year-end spot balances. |
| (5) | Includes FTE for all shared services across Personal Banking and Commercial Banking, for which the related non-interest expenses are allocated to both Personal Banking and Commercial Banking. Effective the fourth quarter of 2025, approximately 5,500 FTE who were previously shared services and are now dedicated to Commercial Banking were transferred from Personal Banking to Commercial Banking. As a result, FTE from the prior period may not be fully comparable. |
Business line review |
Personal Banking – Canada |
Selected highlights (1) |
Table 18 |
(Millions of Canadian dollars, except number of) |
2025 |
2024 | ||||||
Total revenue |
$ |
18,593 |
$ | 16,206 | ||||
Other information |
||||||||
Average residential mortgages |
414,100 |
388,500 | ||||||
Average other loans and acceptances, net |
82,600 |
78,300 | ||||||
Average deposits |
413,600 |
382,300 | ||||||
Average credit card balances |
25,200 |
23,400 | ||||||
Credit card purchase volumes |
196,600 |
185,000 | ||||||
Branch mutual fund balances (2) |
257,400 |
223,600 | ||||||
Average branch mutual fund balances |
235,600 |
204,000 | ||||||
Number as at October 31: |
||||||||
Branches (3) |
1,159 |
1,189 | ||||||
ATMs (3) |
3,869 |
4,042 | ||||||
| (1) | On March 28, 2024, we completed the HSBC Canada transaction. HSBC Canada results have been consolidated from the closing date, which impacted results for all reported periods. |
| (2) | Represents year-end spot balances. |
| (3) | Branches and ATMs are shared across Personal Banking and Commercial Banking. |
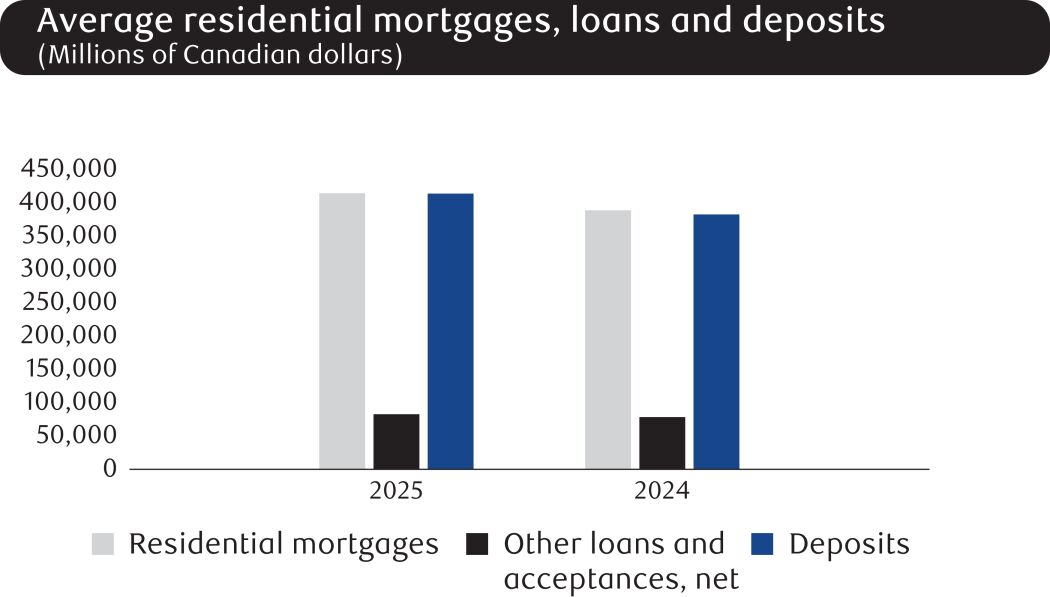
Caribbean & U.S. Banking |
Selected highlights |
Table 19 |
|||||||
(Millions of Canadian dollars, except number of and percentage amounts) |
2025 |
2024 | ||||||
Total revenue |
$ |
1,261 |
$ | 1,136 | ||||
Other information |
||||||||
NIM |
4.20% |
4.26% | ||||||
Average loans and acceptances, net |
13,700 |
12,500 | ||||||
Average deposits |
24,200 |
22,300 | ||||||
AUA (1) |
11,500 |
11,000 | ||||||
Average AUA |
11,200 |
10,700 | ||||||
AUM (1) |
6,100 |
5,700 | ||||||
Average AUM |
5,800 |
5,600 | ||||||
Number as at October 31: |
||||||||
Branches |
38 |
38 | ||||||
ATMs |
247 |
259 | ||||||
| (1) | Represents year-end spot balances. |
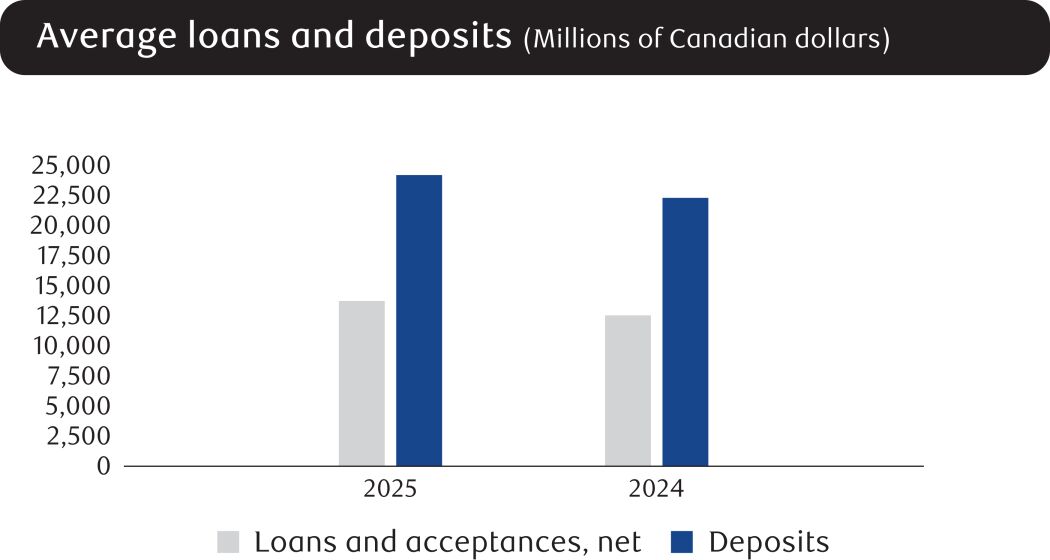
Commercial Banking |
~ 1.4 million |
#1 |
> 3,500 | ||||||
Number of Commercial Banking clients |
Ranking in market share in commercial lending and deposits 1 |
Client-facing advisors and specialists | ||||||
Revenue by Product |
We are a market-leading, full-service commercial bank that meets the needs of Canadian businesses, including subsidiaries of multi-nationals. In Canada, we compete with other Schedule 1 banks, foreign banks, credit unions, specialized financing companies, as well as emerging non-traditional entrants to the financial services industry. For small businesses, we offer convenience through 1,159 branches in Canada and comprehensive digital solutions supported by experienced advisors. For commercial clients, we provide customized banking advice through our network of industry-specialized relationship managers and product specialists. Our corporate clients benefit from tailored product solutions and premium high-touch services via a broad team of specialists and market-leading capabilities. | |||||||
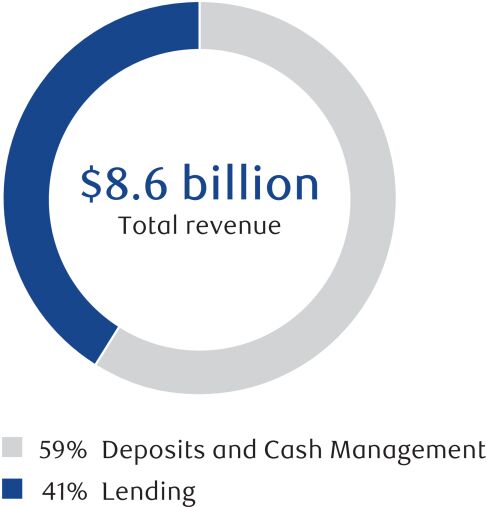 |
||||||||
› |
In 2025, trade uncertainty negatively impacted the economy, eroding business confidence and reducing capital investment. As a result, businesses delayed long-term strategic investments, leading to decreased business investment and weaker employment. This cautious business environment led to a slowdown in lending growth. |
› |
Following the BoC’s monetary policy easing since June 2024, clients shifted towards demand deposits with a preference for liquidity during this time of economic uncertainty. This led to a mix shift in our portfolio, with funds flowing from term products towards demand deposits. |
› |
Despite unfavourable business sentiment and increased competition, our diversified Commercial Banking business achieved volume growth across all major product lines and client segments. |
› |
The credit environment was impacted by rising unemployment rates, slowing economic growth and the impacts of trade disruptions, resulting in higher provisions on impaired and performing loans. |
1 |
Market share is calculated based on deposit balances excluding term deposits from OSFI (M4) and lending balances from CBA, and is as at August 2025 and March 2025, respectively. |
OUR STRATEGY |
PROGRESS IN 2025 |
PRIORITIES IN 2026 | ||
Invest in digital and AI to drive productivity and efficiency |
Continued to invest in digitizing our business to drive more convenience, efficiency and speed for our clients Modernized our transaction banking platform RBC Edge TM to better support clients’ increasingly complex cash management needs |
Continue to create a digitized and AI-enabled credit experience for clients, including our modernized credit platform and auto-adjudication capabilitiesFurther develop self-serve digital onboarding for our clients, refining the experience in virtual accounts management and liquidity management | ||
Target segments and sectors to drive premium growth |
Realigned coverage teams to better match capabilities with client needs to provide more effective support for large commercial and corporate clients Generated market growth in Indigenous Banking, supported by the expansion of our team serving these communities, cross-enterprise collaboration and active engagement with Indigenous communities Enhanced advisor training on climate topics through a program developed in collaboration with Green Economy Canada to help advisors support clients on their transition and resilience journeys Extended our leadership position in the small business and core commercial banking segments through client acquisition strategies and new value propositions |
Develop and execute strategies for key growth sectors Continue to deploy new tailored servicing model for large commercial and corporate clients aimed at driving simplicity and efficiency Continue to execute on refined coverage model and transition teams to a singular platform Engage with clients to understand their plans for the climate transition and where RBC can assist Canadian businesses in achieving their growth and sustainability goals | ||
Differentiate through trade and payments capabilities with international connectivity |
Recognized by Global Finance Magazine as the best overall bank for cash management in Canada for the fourth consecutive year and the leading trade finance provider in Canada for the thirteenth consecutive year Completed integration of HSBC Canada with minimal client attrition Unified transaction banking coverage group, bringing together expertise from multiple teams within treasury and trade solutions and product support to streamline client experience and drive business growth Built out global payments solutions, such as trade finance and foreign exchange in conjunction with Capital Markets Established greater collaboration with City National to support the U.S. banking needs of Canadian commercial and corporate clients resulting in a significant increase in cross-border activity Developed key capabilities within RBC Edge for cross-border cash management that are critical for our north-south transaction banking strategy |
Roll out dedicated support model tailored for the needs of transaction banking clients with specialized expertise Continue to invest in best-in-class Continue to invest in cross-border capabilities including our RBC Edge platform in conjunction with RBC Clear TM | ||
Attract, grow and retain future-ready talent |
Empowered teams to deliver against our strategy by transforming our Commercial Banking organizational structure to align teams against our biggest growth opportunities Supported development of talent through targeted employee moves to new and/or expanded roles to develop in-demand skills and build key capabilities for the futureContinued leadership development through various enterprise and business segment programs, including leadership summits, strategy seminars and people manager enablement programs such as webinars, workshops and learning programs Further strengthened our culture of inclusion and belonging by engaging employee participation in key global enterprise events and Employee Resource Groups |
Build critical future skills through targeted development experiences for leaders and employees aligned to our bold ambitions Inspire and enable teams to achieve ambitious outcomes and high-performance Develop and coach leaders to champion transformation and growth and foster a client-focused culture Empower our leaders and employees through AI to reimagine what’s possible and accelerate innovation | ||
Commercial Banking (1) |
Table 20 |
(Millions of Canadian dollars, except percentage amounts and as otherwise noted) |
2025 |
2024 | ||||||
Net interest income |
$ |
7,268 |
$ | 6,061 | ||||
Non-interest income |
1,294 |
1,321 | ||||||
Total revenue |
8,562 |
7,382 | ||||||
PCL on performing assets |
314 |
261 | ||||||
PCL on impaired assets |
1,236 |
714 | ||||||
PCL |
1,550 |
975 | ||||||
Non-interest expense |
2,833 |
2,512 | ||||||
Income before income taxes |
4,179 |
3,895 | ||||||
Net income |
$ |
3,020 |
$ | 2,818 | ||||
Key ratios |
||||||||
ROE |
14.9% |
18.5% | ||||||
NIM |
3.89% |
4.06% | ||||||
Efficiency ratio |
33.1% |
34.0% | ||||||
Operating leverage |
3.2% |
5.2% | ||||||
Selected balance sheet information |
||||||||
Average total assets |
$ |
192,200 |
$ | 165,400 | ||||
Average total earning assets, net |
186,800 |
149,400 | ||||||
Average loans and acceptances, net |
186,800 |
161,600 | ||||||
Average deposits |
308,700 |
281,800 | ||||||
Other information |
||||||||
Number of employees (FTE) (2) |
7,012 |
1,290 | ||||||
Credit information |
||||||||
PCL on impaired loans as a % of average net loans and acceptances |
0.66% |
0.44% | ||||||
| (1) | On March 28, 2024, we completed the HSBC Canada transaction. HSBC Canada results have been consolidated from the closing date, which impacted results, balances and ratios for all reported periods. |
| (2) | Excludes FTE for all shared services across Personal Banking and Commercial Banking, for which the related non-interest expenses are allocated to both Personal Banking and Commercial Banking. Effective the fourth quarter of 2025, approximately 5,500 FTE who were previously shared services and are now dedicated to Commercial Banking were transferred from Personal Banking to Commercial Banking. As a result, FTE from the prior period may not be fully comparable. |
Wealth Management |
$22.4 billion |
> 6,200 |
~ 75% |
||||||||
Total revenue |
Client-facing advisors |
GAM AUM outperforming the benchmark on a 5-year basis 1 |
||||||||
Assets under Administration (AUA) 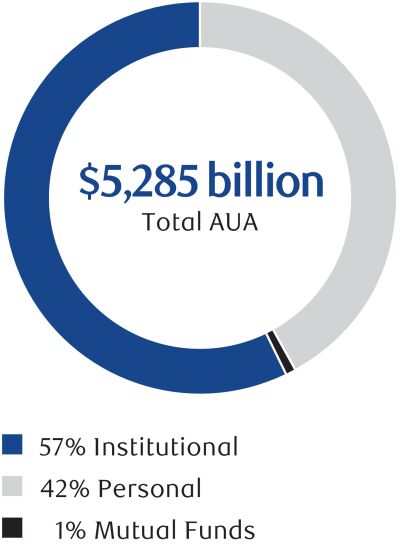 |
Assets under Management (AUM) 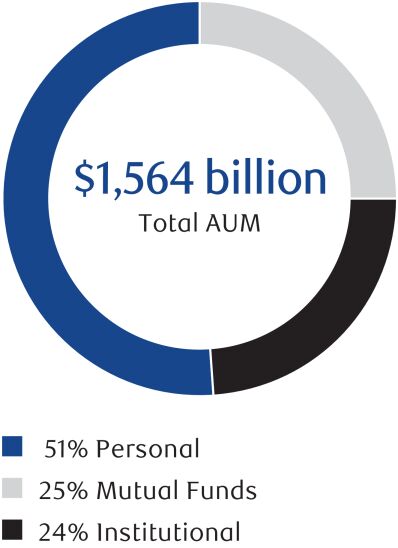 |
Our lines of business include Canadian Wealth Management, U.S. Wealth Management (including City National), Global Asset Management (GAM), International Wealth Management and Investor Services. • Canadian Wealth Management includes a full-service wealth advisory business serving HNW and UHNW clients, as well as a leading self-directed investment service in Canada. The full-service wealth advisory business is the largest in Canada, as measured by AUA. • U.S. Wealth Management (including City National) encompasses our private client group (PCG), clearing and custody (C&C) businesses and City National. PCG is a full-service wealth advisory firm in the U.S., C&C provides a wide array of clearing and execution services for independent broker dealers and registered investment advisors. City National is a U.S.-based relationship bank serving the entertainment industry, mid-market businesses, HNW and UHNW individuals and other clients who value personalized banking relationships. • GAM is the largest retail mutual fund company in Canada as measured by AUM, as well as a leading institutional asset manager. • International Wealth Management serves affluent, HNW and UHNW clients, primarily through key financial centres in the U.K., Ireland, the Channel Islands and Asia. • Investor Services delivers asset servicing solutions to Canadian asset managers, asset owners, insurance companies and private wealth advisors. Investor Services also provides sub-custody services to global financial institutions and brokers. | ||||||
› |
Earnings in the current fiscal year benefitted from strong growth in client assets, primarily driven by favourable market conditions and positive net flows. |
› |
Our wealth advisory businesses continued to realize net positive flows of fee-based client assets reflecting the strength of our business driven by the quality of our advice, the breadth of our investment and holistic wealth planning solutions and clients’ trust in our brand. Within our asset management businesses, we captured increased share in Canadian retail mutual fund sales as the sector returned to positive net flows. |
› |
We continued to invest in our people and technology to maintain our competitive advantage and increase efficiencies in an environment characterized by market volatility, changing client preferences and stringent regulatory expectations. |
› |
The credit environment reflected better-than-expected U.S. economic growth, tempered by elevated U.S. interest rates, resulting in lower provisions on impaired loans. |
1 |
The percentage of assets in funds beating the benchmark represents performance of RBC GAM Canadian retail mutual funds, excluding index funds. Past performance is no guarantee of future results. Benchmarks used are total return indices. Performance is based on gross-of-fee returns using data available from SIMA as of October 2025. |
OUR STRATEGY |
PROGRESS IN 2025 |
PRIORITIES IN 2026 | ||
In Canada, be the premier service provider for HNW and UHNW clients, and build on our leading position serving self-directed investors |
Further extended our position as an industry leader in our full-service private wealth business Continued to focus on holistic wealth planning, including advisor training on intergenerational and business wealth transfer Continued to offer RBC Premier Banking solutions to our clients to deepen banking relationships with Wealth Management clients Focused on the business owner client segment by running business owner planning to deepen collaboration and provide solutions to address financial needs across business segments including Personal Banking and Commercial Banking Continued to enhance digital and data capabilities, modernize infrastructure and invest in personalized client experiences to boost client satisfaction and advisor productivity Focused on providing unique product capabilities that are becoming increasingly important to our HNW and UHNW client base, such as private alternative investment products Introduced commission-free ETF trading in RBC Direct Investing ™ to strengthen our value proposition with early-stage investors, and launched our Royal Distinction program that provides dedicated support and exclusive benefits to our HNW clients |
Build on our existing entrepreneurial and diverse culture and reward system that retains, attracts and motivates top wealth management talent in Canada Deliver a differentiated client experience through enriched advisor-client interactions and seamless digital experiences Focus on strategic partnership opportunities that support clients on healthy aging, philanthropic and personal goals Deepen client relationships by leveraging the combined strengths across other business segments (Personal Banking and Commercial Banking) with a focus on the business owner client segment Continue to invest in digital solutions to streamline and improve efficiency and advisor productivity, including emerging AI capabilities in partnership with RBC Borealis ™ Continue to win early-stage investors in RBC Direct Investing through our low-cost acquisition funnel and launch new products and services for the audience, while simultaneously streamlining the transition of our mass affluent and HNW investors into full-service advice relationships | ||
Full capabilities to serve U.S. clients and deliver strong performance through the cycle |
Continued to invest in key areas needed to drive growth in the U.S. market, including expanding our banking and lending solutions with the introduction of RBC Premium Savings, enhancements to the digital platform with AI-powered insights and record high financial advisor recruitmentAt City National, we focused on enhancing our risk management capabilities across the three lines of defence for sustainable, organic growth in the future. City National also continued to refine its business mix, exit non-core segments and deepen client relationships through new product capabilities |
Continue to deliver an exceptional client experience for targeted HNW and UHNW segments by deepening client relationships with the expansion of our banking and lending and wealth planning solutions and continuing the recruitment of highly productive advisors Increase investments in technology and leverage the combined strengths within U.S. Wealth Management (including City National) and Capital Markets to deepen client relationships At City National, we will continue to focus on enhancing our risk management capabilities across the three lines of defence, as well as improving profitability, stability and scalability | ||
In select global financial centres, become the most trusted regional private bank |
Continued to deliver on growth initiatives, bringing the full strength and breadth of RBC to our clients Focused on delivering a differentiated client experience by leveraging our global capabilities Continued to leverage RBC Brewin Dolphin to support our position as a top five largest wealth manager in the U.K. Achieved growth and continued momentum in Asia through the addition of experienced client-facing advisors and net new assets |
Continue to focus on growing market share in target markets Continue to leverage our global strengths to better serve clients and deepen relationships, taking advantage of our expanded product suite and distribution channels Continue to deliver an exceptional client experience and increase business effectiveness and talent capabilities Continue to enhance client value proposition and consolidation of position in the U.K. local market In Asia, continue to focus on achieving scale by growing the business through the hiring of experienced client-facing advisors and leveraging our global capabilities | ||
In asset management, be a leading, diversified asset manager focused on retail clients in Canada and wealth platforms and institutional clients globally |
Maintained #1 market share in Canadian mutual fund AUM RBC ® iShares strategic alliance maintained #1 market share in Canadian ETFsCompleted the integration of RBC Indigo Asset Management Inc., formerly HSBC Asset Management Canada, into GAM |
Continue to focus on delivering exceptional investment performance and valued insights with client experience at the centre of all that we do Continue to expand our investment capabilities, including alternative investment solutions, to meet evolving client needs in our target distribution regions | ||
Become Canada’s undisputed leader in investment servicing by focusing on our clients and employees, investing for today and tomorrow and leveraging OneRBC |
Launched Ignite 2027, our strategy dedicated to our Canadian Investor Services business with a focus on client and employee experience, and significant investment in technology and people |
Continue with Ignite 2027 focused on client-centred investments to deliver world-class solutions at scale that help clients achieve their growth and efficiency aspirations | ||
Attract, grow and retain future-ready talent |
Empowered teams to deliver against our strategy by transforming our Wealth Management organizational structure to align teams against our biggest growth opportunities Supported development of talent through targeted employee moves to new and/or expanded roles to develop in-demand skills and build key capabilities for the futureContinued leadership development through various enterprise and business segment programs, including leadership summits, strategy seminars and people manager enablement programs such as webinars, workshops and learning programs Further strengthened our culture of inclusion and belonging by engaging employee participation in key global enterprise events and Employee Resource Groups |
Build critical future skills through targeted development experiences for leaders and employees aligned to our bold ambitions Inspire and enable teams to achieve ambitious outcomes and high-performance Develop and coach leaders to champion transformation and growth and foster a client-focused culture Empower our leaders and employees through AI to reimagine what’s possible and accelerate innovation | ||
Wealth Management (1) |
Table 21 |
(Millions of Canadian dollars, except number of, percentage amounts and as otherwise noted) |
2025 |
2024 | ||||||
Net interest income |
$ |
5,459 |
$ | 4,979 | ||||
Non-interest income |
16,919 |
14,647 | ||||||
Total revenue |
22,378 |
19,626 | ||||||
PCL on performing assets |
(8 |
) |
(119 | ) | ||||
PCL on impaired assets |
128 |
148 | ||||||
PCL |
120 |
29 | ||||||
Non-interest expense |
16,769 |
15,312 | ||||||
Income before income taxes |
5,489 |
4,285 | ||||||
Net income |
$ |
4,289 |
$ | 3,422 | ||||
Revenue by business |
||||||||
Canadian Wealth Management |
$ |
6,959 |
$ | 5,777 | ||||
U.S. Wealth Management (including City National) |
9,857 |
8,906 | ||||||
U.S. Wealth Management (including City National) (US$ millions) |
7,023 |
6,550 | ||||||
Global Asset Management |
3,368 |
2,948 | ||||||
International Wealth Management |
1,406 |
1,295 | ||||||
Investor Services |
788 |
700 | ||||||
Key ratios |
||||||||
ROE |
16.6% |
14.4% | ||||||
NIM |
3.33% |
3.26% | ||||||
Pre-tax margin (2) |
24.5% |
21.8% | ||||||
Selected balance sheet information |
||||||||
Average total assets |
$ |
188,400 |
$ | 176,200 | ||||
Average total earning assets, net |
163,700 |
152,500 | ||||||
Average loans and acceptances, net |
123,200 |
114,600 | ||||||
Average deposits |
173,600 |
163,400 | ||||||
Other information |
||||||||
AUA (3), (4) |
$ |
5,284,800 |
$ | 4,685,900 | ||||
AUM (3) |
1,563,900 |
1,332,500 | ||||||
Average AUA |
4,920,400 |
4,384,200 | ||||||
Average AUM |
1,428,500 |
1,218,900 | ||||||
PCL on impaired loans as a % of average net loans and acceptances |
0.10% |
0.13% | ||||||
Number of employees (FTE) |
26,374 |
25,672 | ||||||
Number of advisors (5) |
6,229 |
6,116 | ||||||
Estimated impact of U.S. dollar, British pound and Euro translation on key income statement items |
||||||||
(Millions of Canadian dollars, except percentage amounts) |
2025 vs. 2024 |
|||||||
Increase (decrease): |
||||||||
Total revenue |
$ |
445 |
||||||
PCL |
9 |
|||||||
Non-interest expense |
358 |
|||||||
Net income |
61 |
|||||||
Percentage change in average U.S. dollar equivalent of C$1.00 |
(3)% |
|||||||
Percentage change in average British pound equivalent of C$1.00 |
(5)% |
|||||||
Percentage change in average Euro equivalent of C$1.00 |
(5)% |
|||||||
| (1) | On March 28, 2024, we completed the HSBC Canada transaction. HSBC Canada results have been consolidated from the closing date, which impacted results, balances and ratios for all reported periods. |
| (2) | Pre-tax margin is defined as income before income taxes divided by total revenue. |
| (3) | Represents year-end spot balances. |
| (4) | In addition to Canadian Wealth Management, U.S. Wealth Management (including City National), International Wealth Management and Investor Services, AUA includes $8,000 million (2024 – $7,400 million) related to GAM. |
| (5) | Represents client-facing advisors across all our Wealth Management businesses. |
Client assets – AUA |
Table 22 |
(Millions of Canadian dollars) |
2025 |
2024 |
||||||
AUA, beginning balance (1) |
$ |
2,004,500 |
$ | 1,621,600 | ||||
Asset inflows |
504,000 |
474,000 | ||||||
Asset outflows |
(486,200 |
) |
(458,800 | ) | ||||
Total net flows (1) |
17,800 |
15,200 | ||||||
Market impact |
267,800 |
341,700 | ||||||
Acquisitions/dispositions |
– |
21,400 | ||||||
Foreign exchange/other |
16,600 |
4,600 | ||||||
Total market, acquisition/dispositions and foreign exchange/other impact (1) |
284,400 |
367,700 | ||||||
AUA, balance at end of year (1) |
2,306,700 |
2,004,500 | ||||||
Investor Services, balance at end of year |
2,978,100 |
2,681,400 | ||||||
Total AUA |
$ |
5,284,800 |
$ | 4,685,900 | ||||
| (1) | Includes AUA from the following lines of business: Canadian Wealth Management, U.S. Wealth Management (including City National), Global Asset Management and International Wealth Management. |
AUA by geographic mix and asset class |
Table 23 |
(Millions of Canadian dollars) |
2025 |
2024 | ||||||
Canada (1), (2) |
||||||||
Money market |
$ |
36,600 |
$ | 28,400 | ||||
Fixed income |
55,600 |
61,500 | ||||||
Equity |
258,900 |
248,400 | ||||||
Multi-asset and other |
640,200 |
510,300 | ||||||
Total Canada |
991,300 |
848,600 | ||||||
U.S. (1), (2) |
||||||||
Money market |
35,100 |
36,300 | ||||||
Fixed income |
144,500 |
144,600 | ||||||
Equity |
387,200 |
335,900 | ||||||
Multi-asset and other |
496,600 |
413,200 | ||||||
Total U.S. |
1,063,400 |
930,000 | ||||||
Other International (1), (2) |
||||||||
Money market |
25,400 |
19,200 | ||||||
Fixed income |
25,400 |
13,200 | ||||||
Equity |
106,700 |
56,800 | ||||||
Multi-asset and other |
94,500 |
136,700 | ||||||
Total International |
252,000 |
225,900 | ||||||
AUA, balance at end of year (2) |
2,306,700 |
2,004,500 | ||||||
Investor Services, balance at end of year |
2,978,100 |
2,681,400 | ||||||
Total AUA |
$ |
5,284,800 |
$ | 4,685,900 | ||||
| (1) | Geographic information is based on the location from where our clients are served. |
| (2) | Includes AUA from the following lines of business: Canadian Wealth Management, U.S. Wealth Management (including City National), Global Asset Management and International Wealth Management. |
Client assets – AUM |
Table 24 |
2025 |
2024 | |||||||||||||||||||||||
(Millions of Canadian dollars) |
Money market |
Fixed income |
Equity |
Multi-asset and other |
Total |
Total | ||||||||||||||||||
AUM, beginning balance (1) |
$ |
62,700 |
$ |
278,500 |
$ |
181,600 |
$ |
809,700 |
$ |
1,332,500 |
$ |
1,058,900 |
||||||||||||
Institutional inflows |
233,900 |
56,900 |
12,400 |
8,500 |
311,700 |
317,900 | ||||||||||||||||||
Institutional outflows |
(218,800 |
) |
(51,400 |
) |
(12,800 |
) |
(4,600 |
) |
(287,600 |
) |
(295,100 | ) | ||||||||||||
Personal flows, net |
1,800 |
5,000 |
4,200 |
24,700 |
35,700 |
19,800 | ||||||||||||||||||
Total net flows |
16,900 |
10,500 |
3,800 |
28,600 |
59,800 |
42,600 | ||||||||||||||||||
Market impact |
800 |
17,700 |
30,000 |
112,100 |
160,600 |
201,000 | ||||||||||||||||||
Acquisition/dispositions |
– |
– |
– |
– |
– |
20,600 | ||||||||||||||||||
Foreign exchange and other |
500 |
2,600 |
900 |
7,000 |
11,000 |
9,400 | ||||||||||||||||||
Total market, acquisition/dispositions and foreign exchange impact |
1,300 |
20,300 |
30,900 |
119,100 |
171,600 |
231,000 | ||||||||||||||||||
AUM, balance at end of year |
$ |
80,900 |
$ |
309,300 |
$ |
216,300 |
$ |
957,400 |
$ |
1,563,900 |
$ | 1,332,500 | ||||||||||||
| (1) | The amounts in the respective categories have been revised from those previously presented. |
Business line review |
Canadian Wealth Management |
Selected highlights (1) |
Table 25 |
(Millions of Canadian dollars) |
2025 |
2024 | ||||||
Total revenue |
$ |
6,959 |
$ | 5,777 | ||||
Other information |
||||||||
Average loans and acceptances, net |
7,300 |
6,500 | ||||||
Average deposits |
31,100 |
25,000 | ||||||
AUA (2) |
998,700 |
855,800 | ||||||
AUM (2) |
290,600 |
240,500 | ||||||
Average AUA |
979,900 |
791,100 | ||||||
Average AUM |
284,400 |
218,600 | ||||||
| (1) | On March 28, 2024, we completed the HSBC Canada transaction. HSBC Canada results have been consolidated from the closing date, which impacted results, balances and ratios for all reported periods. |
| (2) | Represents year-end spot balances. |
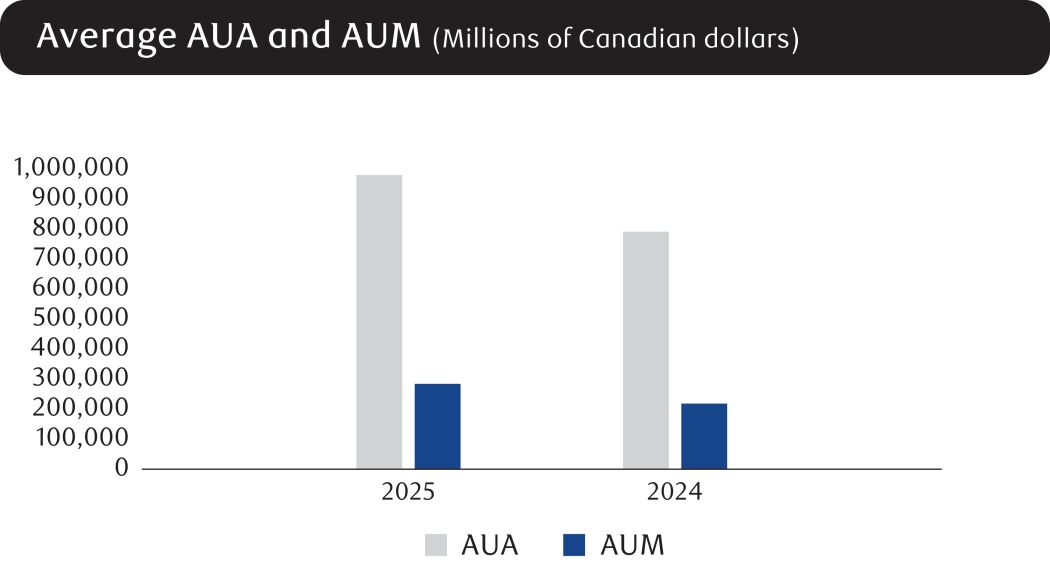
U.S. Wealth Management (including City National) |
Selected highlights |
Table 26 |
(Millions of Canadian dollars, except as otherwise noted) |
2025 |
2024 | ||||||
Total revenue |
$ |
9,857 |
$ | 8,906 | ||||
Other information (Millions of U.S. dollars) |
||||||||
Total revenue |
7,023 |
6,550 | ||||||
NIM |
2.54% |
2.71% | ||||||
Average earning assets, net |
104,500 |
100,600 | ||||||
Average loans, guarantees and letters of credit, net |
78,400 |
75,500 | ||||||
Average deposits |
80,700 |
84,100 | ||||||
AUA (1) |
758,600 |
668,100 | ||||||
AUM (1) |
257,500 |
220,200 | ||||||
Average AUA |
747,200 |
629,100 | ||||||
Average AUM |
252,800 |
206,300 | ||||||
| (1) | Represents year-end spot balances. |
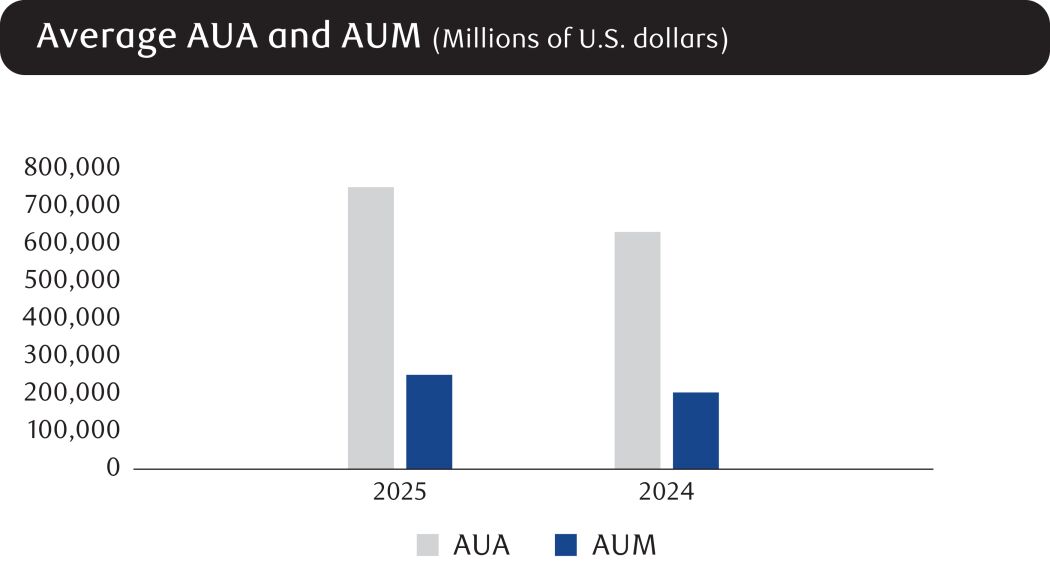
Global Asset Management |
Selected highlights (1) |
Table 27 |
(Millions of Canadian dollars) |
2025 |
2024 | ||||||
Total revenue |
$ |
3,368 |
$ | 2,948 | ||||
Other information |
||||||||
Canadian net long-term mutual fund sales (redemptions) (2) |
9,609 |
1,935 | ||||||
Canadian net money market mutual fund sales (redemptions) (2) |
2,891 |
1,334 | ||||||
AUM (3) |
793,700 |
680,300 | ||||||
Average AUM |
776,500 |
619,900 | ||||||
| (1) | On March 28, 2024, we completed the HSBC Canada transaction. HSBC Canada results have been consolidated from the closing date, which impacted results, balances and ratios for all reported periods. |
| (2) | As reported to the Investment Funds Institute of Canada. Includes all prospectus-based mutual funds across our Canadian GAM businesses. |
| (3) | Represents year-end spot balances. |
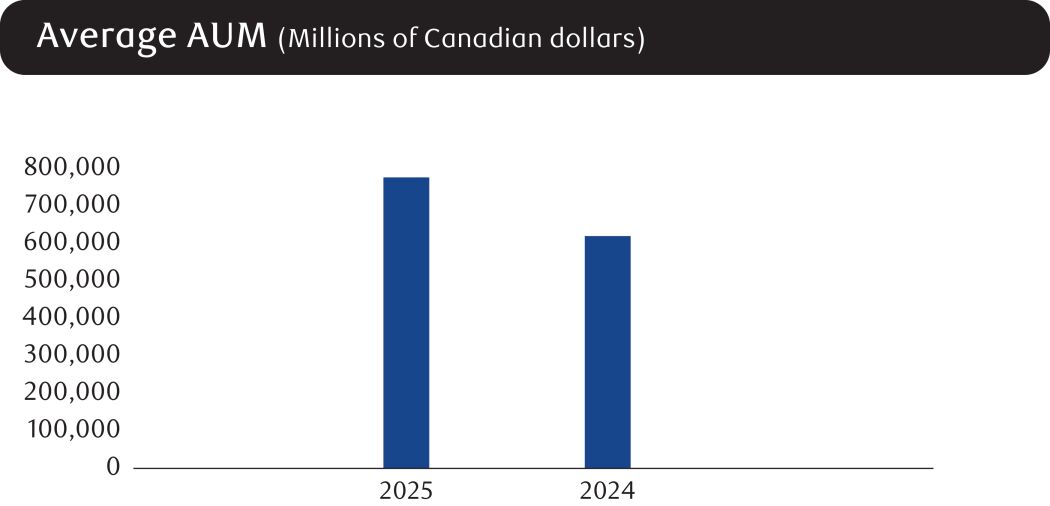
International Wealth Management |
Selected highlights |
Table 28 |
(Millions of Canadian dollars) |
2025 |
2024 | ||||||
Total revenue |
$ |
1,406 |
$ | 1,295 | ||||
Other information |
||||||||
Average loans, guarantees and letters of credit, net |
4,700 |
4,500 | ||||||
Average deposits |
14,700 |
11,500 | ||||||
AUA (1) |
236,600 |
211,300 | ||||||
AUM (1) |
118,700 |
105,000 | ||||||
Average AUA |
214,000 |
201,100 | ||||||
Average AUM |
103,600 |
99,800 | ||||||
| (1) | Represents year-end spot balances. |
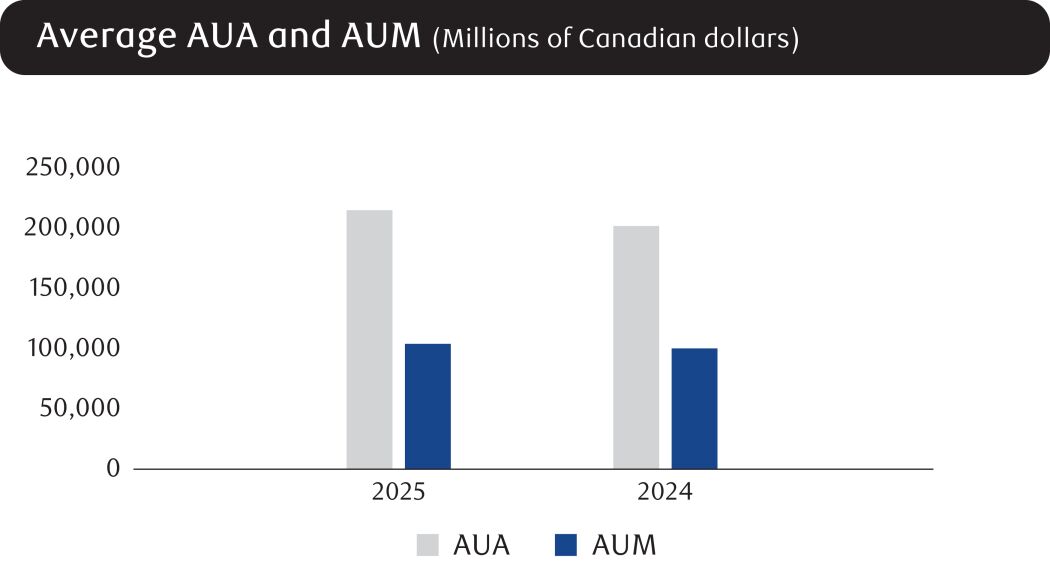
Investor Services |
Selected highlights |
Table 29 |
(Millions of Canadian dollars) |
2025 |
2024 | ||||||
Total revenue |
$ |
788 |
$ | 700 | ||||
Other information |
||||||||
Average deposits |
13,200 |
11,600 | ||||||
AUA (1) |
2,978,100 |
2,681,400 | ||||||
Average AUA |
2,932,500 |
2,529,400 | ||||||
| (1) | Represents year-end spot balances. |
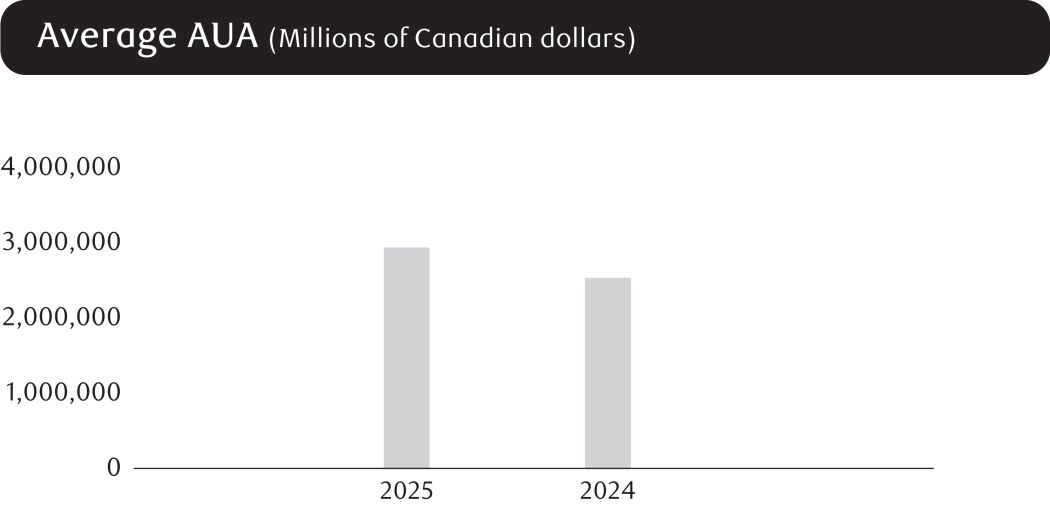
Insurance |
$1.3 billion |
~ 4.9 million |
2,853 | ||||||
Total revenue |
Number of clients |
Employees (FTE) | ||||||
Premiums and Deposits 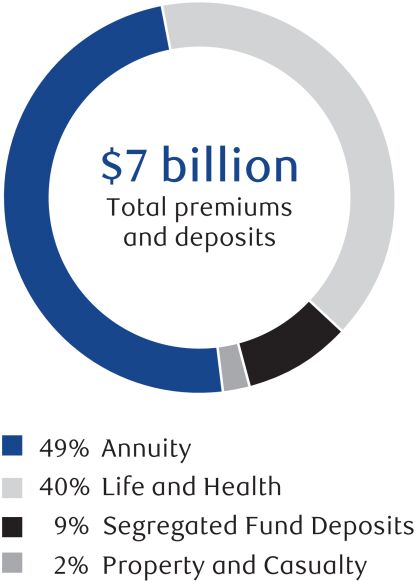 |
RBC Insurance is the largest Canadian bank-owned life insurance company on a total revenue basis. 1 We offer a comprehensive suite of advice and solutions for individual and business clients, including life, health, wealth solutions, travel, group benefits and reinsurance. We provide property & casualty insurance through a distribution agreement with Aviva Canada. We also offer longevity reinsurance, as well as reinsurance solutions for creditor life, disability and critical illness. Our products and services are distributed through multiple channels, including our proprietary sales force, digital platforms, and a network of independent brokers and partners. In Canada, many of our competitors specialize in life and health, wealth, or property and casualty products. In our International Insurance business, we compete in the global reinsurance market. | |||||||
› |
Ongoing geopolitical uncertainty created headwinds for the Canadian economy, worsening affordability pressures on Canadians, weighing on consumer confidence and challenging new business growth. Amidst this macroeconomic backdrop, RBC Insurance delivered steady growth in total premiums and deposits, supported by the strength of our overall insurance product portfolio. |
› |
Within individual insurance, term insurance remained a key driver of growth, supported by product enhancements and improved pricing and underwriting. We sustained leading creditor insurance market share in a challenging environment, achieving sales growth in home and loan protection products. We also maintained our market leadership position in disability income insurance. |
› |
Driven by strong market growth in investment protection and retirement income products, we expanded our wealth offerings with product and pricing enhancements to better serve our clients. |
› |
The trend of companies transferring pension risk management to specialists continued. Consequently, our Canadian group annuity business delivered prudent growth driven by disciplined pricing within our risk tolerance. |
› |
With Canadian group sponsors placing greater emphasis on the need for more flexible and accessible group benefits solutions, we strengthened our group benefits offering through digital advancements and improved product features, further elevating the client experience. |
› |
Despite the travel market having been affected by changing travel patterns and softer spending, we experienced steady growth in our travel business. Through embedded travel coverage we offer with RBC credit cards, we continue to offer our clients new options and expanded benefits. |
1 |
Based on the most current total nine-month revenue for life insurance companies, as available from OSFI. |
OUR STRATEGY |
PROGRESS IN 2025 |
PRIORITIES IN 2026 | ||
Deliver a market-leading client experience |
Awarded A+ ratings by Fundata Canada for our three Guaranteed Investment Funds, recognizing their consistent outstanding risk adjusted performance, a distinction earned by fewer than 2% of Canadian investment fund products Ranked #1 for broker relationship management capabilities and underwriting case coordinator service in the 2025 NMG Consulting Canadian individual life insurance study, reflecting strong frontline engagement and service excellence Repositioned our third-party sales force to expand solution set for clients |
Drive profitable business growth by continuing the journey to become a client-led organization underpinned by superior advice and solutionsDrive deep client relationships through distribution excellence, including channel growth and by supporting our agents and partners with high quality tools and unique value propositions | ||
Lead in digital, data and technology |
Awarded three global insurance innovation awards from The Digital Banker, including Best Digital Insurance Initiative, Best Digital Transformation Program, and Outstanding Customer Relations & Brand Engagement Initiative, recognizing our leadership in digital innovation Launched a redesigned public website, resulting in a 17% increase in overall traffic and positioning us well to quickly implement future enhancements Drove 50%+ YoY increase in digital releases, reflecting the impact of ongoing investments in digital, data, technology and process improvements |
Create innovative client experiences, leveraging data and analytics to proactively anticipate future insurance needs | ||
Harness the power of RBC and the RBC Brand to grow our Insurance business – OneRBC approach |
Maintained leadership position in creditor products as measured by total insured lending balance 1 Featured creditor products in RBC’s home equity finance spring campaign for the first time, introducing important protection at a critical life moment thereby deepening client engagement Deepened our partnership with Wealth Management to deliver insurance solutions, supporting clients’ financial planning needs and driving growth in term and disability insurance solutions Leveraged enterprise AI capabilities, infrastructure and the RBC Borealis platform to build and scale AI capabilities within RBC Insurance |
Harness the power of being a bank-owned insurer by tapping into enterprise capabilities, relationships, channels, best practices and the RBC brand to maximize enterprise opportunities | ||
Drive operational excellence through automation and streamlined processes |
Achieved a 35%+ reduction in critical illness decision cycle time, elevating the overall client experience Enabled point-of-sale Launched our first fully-automated and integrated GenAI solution, enhancing claims fraud detection and driving greater operational efficiency |
Reimagine our processes through automation, advanced capabilities and resilient operations to position us for scale and to deliver an enhanced client experience | ||
Attract, develop and retain future-ready talent |
Empowered teams to deliver against our strategy by transforming our Insurance organizational structure to align teams against our biggest growth opportunities Supported development of talent through targeted employee moves to new and/or expanded roles to develop in-demand skills and build key capabilities for the futureContinued leadership development through various enterprise and business segment programs, including leadership summits, strategy seminars and people manager enablement programs such as webinars, workshops and learning programs Further strengthened our culture of inclusion and belonging by engaging employee participation in key global enterprise events and Employee Resource Groups |
Build critical future skills through targeted development experiences for leaders and employees aligned to our bold ambitions Inspire and enable teams to achieve ambitious outcomes and high-performance Develop and coach leaders to champion transformation and growth and foster a client-focused culture Empower our leaders and employees through AI to reimagine what’s possible and accelerate innovation |
1 |
Total insured lending balance calculated from latest available supplementary financial reports |
Insurance |
Table 30 |
(Millions of Canadian dollars, except percentage amounts and as otherwise noted) |
2025 |
2024 | ||||||
Non-interest income |
||||||||
Insurance service result |
$ |
867 |
$ | 777 | ||||
Insurance investment result |
284 |
294 | ||||||
Other income |
170 |
153 | ||||||
Total revenue |
1,321 |
1,224 | ||||||
PCL |
– |
2 | ||||||
Non-interest expense |
315 |
285 | ||||||
Income before income taxes |
1,006 |
937 | ||||||
Net income |
$ |
828 |
$ | 729 | ||||
Key ratios |
||||||||
ROE |
40.7% |
35.3% | ||||||
Selected balance sheet information |
||||||||
Average total assets |
$ |
31,000 |
$ | 26,400 | ||||
Other information |
||||||||
Premiums and deposits (1), (2) |
$ |
7,016 |
$ | 6,136 | ||||
Net insurance contract liabilities (3) |
23,746 |
21,643 | ||||||
Contractual service margin (CSM) (4) |
1,802 |
2,137 | ||||||
Number of employees (FTE) |
2,853 |
2,788 | ||||||
| (1) | Premiums and deposits include premiums on risk-based individual and group insurance and annuity products as well as segregated fund deposits, consistent with insurance industry practices. |
| (2) | Comparative amounts have been revised from those previously presented. |
| (3) | Includes insurance contract liabilities net of insurance contract assets. |
| (4) | Represents the CSM of insurance contract assets and liabilities net of reinsurance contract held assets and liabilities. For insurance contracts, the CSM represents the unearned profit (net inflows) for providing insurance coverage. For reinsurance contracts held, the CSM represents the net cost or net gain of purchasing reinsurance. The CSM is not applicable to contracts measured using the premium allocation approach. |
Capital Markets |
> 22,900 |
#1 |
7,648 | ||||||
Number of clients |
Canadian bank-owned capital markets firm by revenue 1 |
Employees (FTE) | ||||||
Revenue by Geography 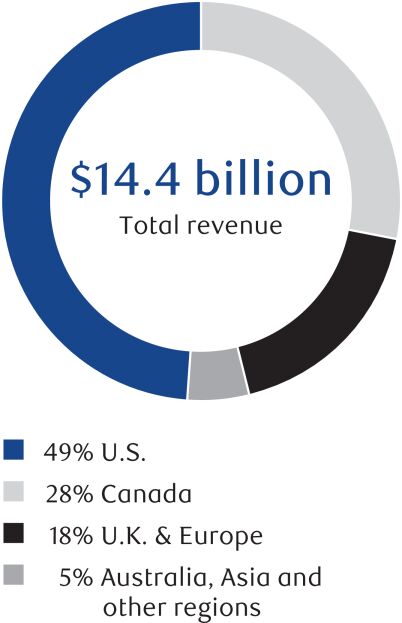 |
We operate two main business lines: Corporate & Investment Banking and Global Markets. In North America, we offer a full suite of products and services, including equity and debt origination and distribution, advisory services, sales & trading and transaction banking. In Canada, we are a market leader with a strategic presence in all lines of capital markets businesses. In the U.S., where our competitors include large global investment banks, we have a full industry sector coverage and investment banking product range, as well as capabilities in credit, secured lending, municipal finance, fixed income, currencies & commodities and equities. Outside North America, we have a targeted strategic presence in the U.K. & Europe, Australia, Asia and other markets aligned to our global expertise. In the U.K. & Europe, we offer a diversified set of capabilities in key industry sectors of focus. In Australia and Asia, we compete with global and regional investment banks in targeted areas aligned to our global expertise, including fixed income distribution and currencies trading, secured financing, as well as corporate & investment banking. | |||||||
› |
The fiscal 2025 macroeconomic environment was characterized by modest global growth, declining interest rates and lower inflation, alongside an increase in geopolitical uncertainty. These macro conditions supported a growing industry wallet across most of our core businesses. |
› |
Investment banking fee pool growth slowed in the first half of 2025 amidst macroeconomic uncertainty and market volatility; however, the fee pools increased in the second half of 2025. Against this backdrop, we continued to expand our client coverage, which contributed to revenue growth. |
› |
Overall financial market activity was driven by elevated market volatility in the first half of 2025, which supported robust client-driven trading flows, notably from equities, foreign exchange and interest rate trading. The second half of 2025 saw a reduction in market volatility, which supported a recovery in credit trading, partly offset by slower growth in equities trading volumes. |
› |
The credit environment reflected better-than-expected economic growth in the U.S., tempered by elevated U.S. interest rates, while other economies experienced slowing growth and the impacts of trade disruptions. We saw higher provisions on impaired loans driven by a few accounts in the other services and financing products sectors. |
› |
The Pillar Two legislation, which includes a 15% global minimum corporate tax, resulted in an increase in tax expenses. |
1 |
Source: Based on externally disclosed capital markets revenue for Canadian peers (Bank of Montreal, The Bank of Nova Scotia, Canadian Imperial Bank of Commerce, The Toronto-Dominion Bank and National Bank of Canada) for the last twelve months as of July 31, 2025 |
OUR STRATEGY |
PROGRESS IN 2025 |
PRIORITIES IN 2026 | ||
Build new and deepen client relationships |
Expanded client coverage through our holistic global coverage model. A notable client example is our role as exclusive financial advisor to Advent International on the US$6.3 billion take-private of Nuvei and joint lead arranger on a US$3.2 billion related financing Awards include Best Investment Bank in Canada (Euromoney), Top 10 Investment Bank globally (Euromoney) and Best Bank for Research in North America (Euromoney) |
Grow corporate relationships with expanded sector coverage Leverage sponsors franchise including capturing more private capital opportunities Increase coverage of bank, insurance and hedge fund clients | ||
Strengthen and expand our capabilities |
Expanded our U.S. Transaction Banking platform, RBC Clear, onboarding new clients and growing deposits Awards include 2025 Model Celent Bank winner for Reinventing Cash Management by Celent Model Bank and 2025 Best Digital Banking Initiative – RBC Clear awarded by Banking Tech Awards USA Expanded capabilities and market presence across equity derivatives, risk solutions, structured products and commodities Created a dedicated Energy Transition centre of excellence within Investment Banking to support clients on energy transition with advice and capital. A notable client example is our role as exclusive financial advisor to Canada Growth Fund and Building Ontario Fund on $2 billion and $1 billion equity investments in the world-leading Ontario Power Generation Small Modular Reactors project Accelerated growth in Equity Capital Markets (ECM) capabilities, with a notable client example highlighted through our role as joint lead manager, bookrunner and underwriter on Goodman Group’s AU$4 billion institutional placement |
Grow Mergers & Acquisitions (M&A) and ECM capabilities, in partnership with coverage Expand foreign exchange (FX) and commodities products and capabilities Expand equity financing and derivatives opportunities Scale U.S. transaction banking solutions with further domestic payment automation and launch of FX capabilities | ||
Deliver complete solutions as OneRBC |
Grew structured products solutions targeted to Wealth Management clients Progressed the enterprise FX program across RBC platforms to coordinate capabilities and grow offerings |
Deliver global transaction banking capabilities to clients, in partnership with Commercial Banking and City National Partner with Commercial Banking and Personal Banking to drive enterprise FX offerings Connect Capital Markets clients with the best of RBC capabilities across Wealth Management and Global Asset Management products | ||
Leverage digital, data and AI |
Established an AI and digital centre of excellence Scaled Aiden ® , RBC Capital Markets’ AI solution, to all RBC Capital Markets employees |
Accelerate execution of agentic AI with bespoke applications tailored to user needs Generate differentiated insights with thought leadership, leveraging alternative data and client analytics Modernize trading platform across rates, FX and risk solutions | ||
Simplify, scale and modernize our foundation |
Delivered across large scale platform modernization and execution capability projects Leveraged digital and AI to streamline the end-to-end technology ecosystem and provide an improved client and employee experience Further simplified our estate of applications while ensuring security and soundness |
Automate operations to deliver improved end-to-end Simplify and streamline technology and operational infrastructures while amplifying controls and risk management Continue momentum in productivity and efficiency program | ||
Dynamically allocate resources for maximum impact |
Continued to invest in key areas of technology, with a focus on client facing applications (e.g., RBC Clear) and operational efficiencies Supported clients with financial resources and tailored advice |
Sustain technology investment, focused on change the bank initiatives Prioritize financial resource allocation to the highest priority client opportunities | ||
OUR STRATEGY |
PROGRESS IN 2025 |
PRIORITIES IN 2026 | ||
Attract, grow and retain future-ready talent |
Empowered teams to deliver against our strategy by transforming our Capital Markets organizational structure to align teams against our biggest growth opportunities Supported development of talent through targeted employee moves to new and/or expanded roles to develop in-demand skills and build key capabilities for the futureContinued leadership development through various enterprise and business segment programs, including leadership summits, strategy seminars and people manager enablement programs such as webinars, workshops and learning programs Accelerated hiring to strengthen our leadership capabilities in alignment with our global business strategy Further strengthened our culture of inclusion and belonging by engaging employee participation in key global enterprise events and Employee Resource Groups |
Build critical future skills through targeted development experiences for leaders and employees aligned to our bold ambitions Inspire and enable teams to achieve ambitious outcomes and high-performance Develop and coach leaders to champion transformation and growth and foster a client-focused culture Empower our leaders and employees through AI to reimagine what’s possible and accelerate innovation | ||
Capital Markets (1) |
Table 31 |
(Millions of Canadian dollars, except percentage amounts and as otherwise noted) |
2025 |
2024 | ||||||
Net interest income (2) |
$ |
4,789 |
$ | 3,183 | ||||
Non-interest income (2) |
9,637 |
8,829 | ||||||
Total revenue (2) |
14,426 |
12,012 | ||||||
PCL on performing assets |
(29 |
) |
84 | |||||
PCL on impaired assets |
616 |
340 | ||||||
PCL |
587 |
424 | ||||||
Non-interest expense |
7,966 |
7,016 | ||||||
Income before income taxes |
5,873 |
4,572 | ||||||
Net income |
$ |
5,393 |
$ | 4,573 | ||||
Revenue by business |
||||||||
Corporate & Investment Banking (3) |
$ |
6,877 |
$ | 6,213 | ||||
Global Markets |
7,538 |
5,879 | ||||||
Other (3) |
11 |
(80 | ) | |||||
Key ratios |
||||||||
ROE |
13.7% |
14.2% | ||||||
Selected balance sheet information |
||||||||
Average total assets |
$ |
1,326,300 |
$ | 1,134,300 | ||||
Average trading securities |
206,800 |
183,400 | ||||||
Average loans and acceptances, net |
163,500 |
148,200 | ||||||
Average deposits |
389,900 |
296,400 | ||||||
Other information |
||||||||
Number of employees (FTE) |
7,648 |
7,424 | ||||||
Credit information |
||||||||
PCL on impaired loans as a % of average net loans and acceptances |
0.38% |
0.23% | ||||||
Estimated impact of U.S. dollar, British pound and Euro translation on key income statement items |
||||||||
(Millions of Canadian dollars, except percentage amounts) |
2025 vs. 2024 |
|||||||
Increase (decrease): |
||||||||
Total revenue |
$ |
490 |
||||||
PCL |
23 |
|||||||
Non-interest expense |
211 |
|||||||
Net income |
225 |
|||||||
Percentage change in average U.S. dollar equivalent of C$1.00 |
(3)% |
|||||||
Percentage change in average British pound equivalent of C$1.00 |
(5)% |
|||||||
Percentage change in average Euro equivalent of C$1.00 |
(5)% |
|||||||
| (1) | On March 28, 2024, we completed the HSBC Canada transaction. HSBC Canada results have been consolidated from the closing date, which impacted results, balances and ratios for all reported periods. |
| (2) | The teb adjustment for 2025 was $151 million (2024 – $294 million). For further discussion, refer to the How we measure and report our business segments section. |
| (3) | Comparative amounts have been revised from those previously presented. |
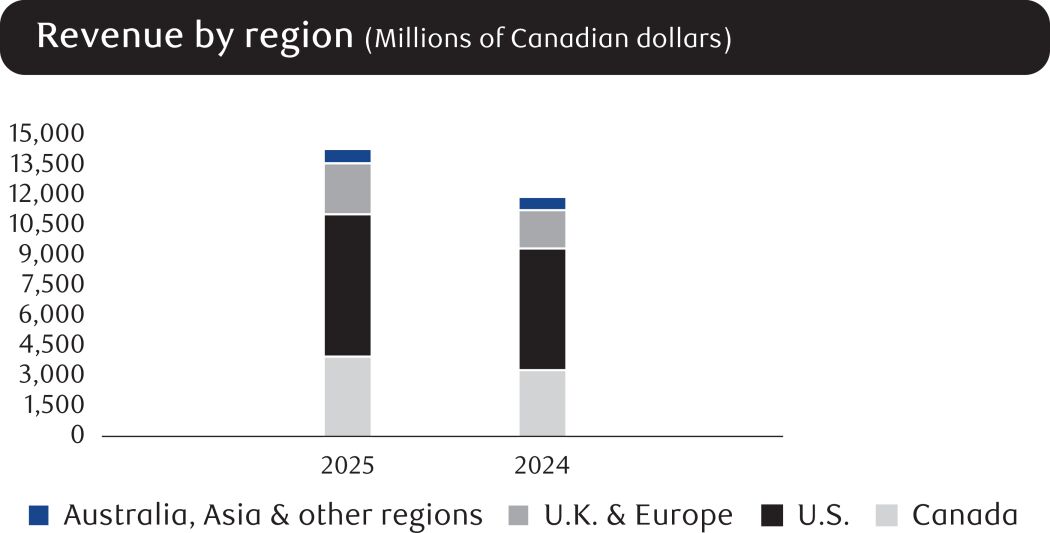
Business line review |
Corporate & Investment Banking |
Selected highlights |
Table 32 |
(Millions of Canadian dollars) |
2025 |
2024 | ||||||
Total revenue (1), (2) |
$ |
6,877 |
$ | 6,213 | ||||
Breakdown of total revenue (1) |
||||||||
Investment banking |
3,027 |
2,745 | ||||||
Lending and transaction banking (2), (3) |
3,850 |
3,468 | ||||||
Other information |
||||||||
Average assets |
143,000 |
129,000 | ||||||
Average loans and acceptances, net |
134,000 |
121,000 | ||||||
| (1) | The teb adjustment for the year ended October 31, 2025 was $152 million (October 31, 2024 – $265 million). For further discussion, refer to the How we measure and report our business segments section. |
| (2) | Comparative amounts have been revised from those previously presented. |
| (3) | Effective the second quarter of 2025, we renamed the “Lending and other” business to “Lending and transaction banking”. The change had no impact to how the business is managed or prior period comparatives. |
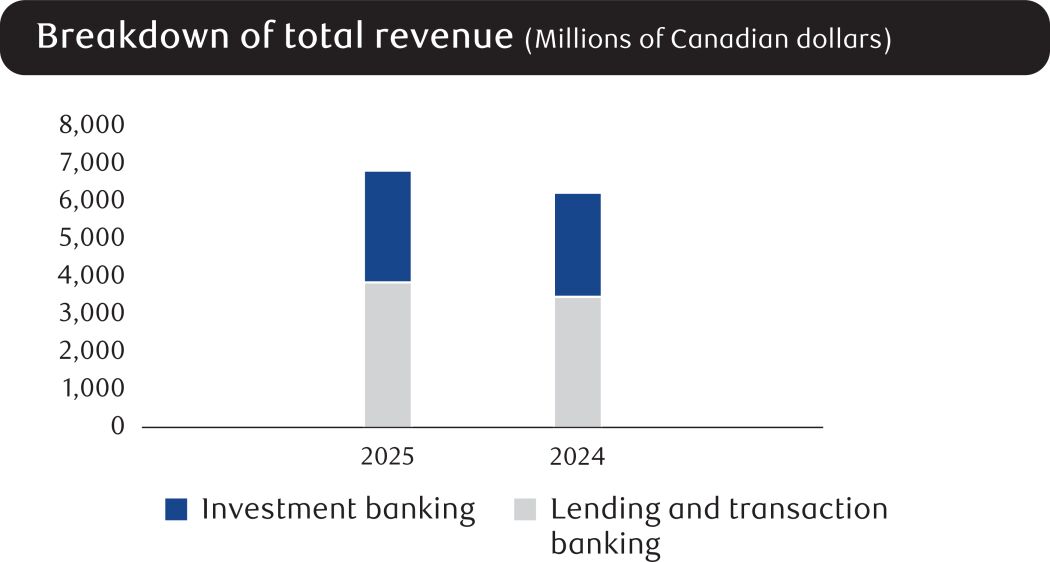
Global Markets |
Selected highlights |
Table 33 |
(Millions of Canadian dollars) |
2025 |
2024 | ||||||
Total revenue (1) |
$ |
7,538 |
$ | 5,879 | ||||
Breakdown of total revenue (1) |
||||||||
Fixed income, currencies and commodities (2) |
5,200 |
4,354 | ||||||
Equities (2) |
2,338 |
1,525 | ||||||
Other information |
||||||||
Average assets |
1,163,000 |
995,000 | ||||||
| (1) | The teb adjustment for the year ended October 31, 2025 was $(1) million (October 31, 2024 – $29 million). For further discussion, refer to the How we measure and report our business segments section. |
| (2) | Effective the second quarter of 2025, we reorganized our revenue reporting hierarchy to collapse our Treasury services and funding business into our Fixed income, currencies and commodities and Equities businesses. Comparative amounts have been revised from those previously presented to conform to this new basis of presentation. |
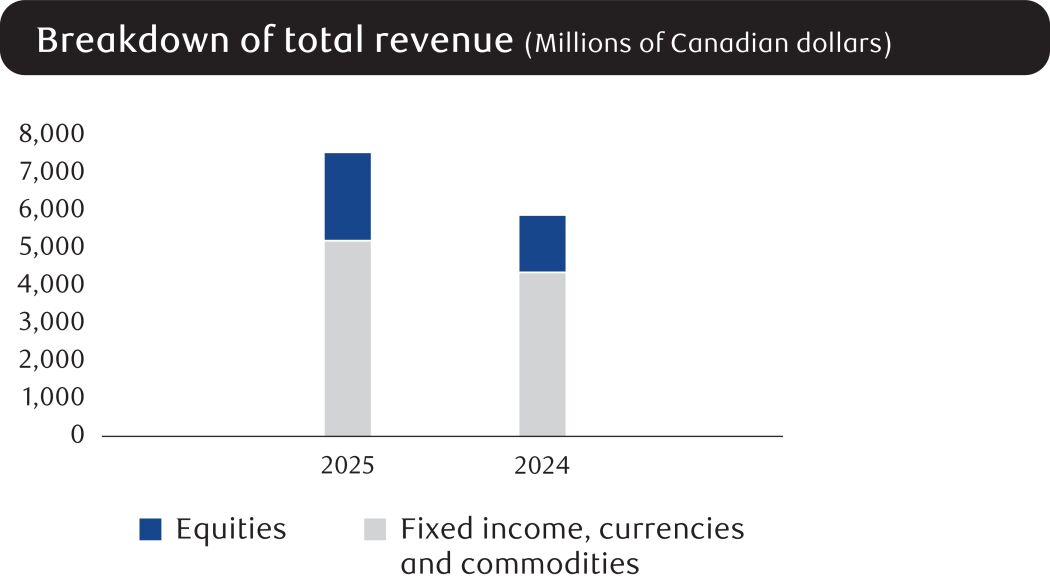
Other |
Corporate Support |
Corporate Support |
Table 34 |
(Millions of Canadian dollars) |
2025 |
2024 | ||||||
Net interest income (loss) (1) |
$ |
988 |
$ | 1,292 | ||||
Non-interest income (loss) (1), (2) |
(924 |
) |
(1,534 | ) | ||||
Total revenue (1), (2) |
64 |
(242 | ) | |||||
Non-interest expense (2) |
708 |
1,640 | ||||||
Income (loss) before income taxes (1) |
(644 |
) |
(1,882 | ) | ||||
Income taxes (recoveries) (1) |
(378 |
) |
(659 | ) | ||||
Net income (loss) |
$ |
(266 |
) |
$ | (1,223 | ) | ||
| (1) | Teb adjusted. |
| (2) | Revenue for the year ended October 31, 2025, included gains of $405 million (October 31, 2024 – gains of $499 million) on economic hedges of our U.S. Wealth Management (including City National) share-based compensation plans, and non-interest expense included $391 million (October 31, 2024 – $473 million) of share-based compensation expense driven by changes in the fair value of liabilities relating to our U.S. Wealth Management (including City National) share-based compensation plans. |
Quarterly financial information |
Fourth quarter performance |
Quarterly results and trend analysis |
Quarterly results (1) |
Table 35 |
2025 |
2024 | |||||||||||||||||||||||||||||||||||
(Millions of Canadian dollars, except per share and percentage amounts) |
Q4 (2) |
Q3 (2) |
Q2 (2) |
Q1 (2) |
Q4 (2) |
Q3 (2) |
Q2 (2) |
Q1 | ||||||||||||||||||||||||||||
Personal Banking |
$ |
5,178 |
$ | 5,060 | $ | 4,805 | $ | 4,811 | $ | 4,658 | $ | 4,490 | $ | 4,163 | $ | 4,031 | ||||||||||||||||||||
Commercial Banking |
2,221 |
2,152 | 2,062 | 2,127 | 2,077 | 2,036 | 1,656 | 1,613 | ||||||||||||||||||||||||||||
Wealth Management |
5,900 |
5,513 | 5,397 | 5,568 | 5,186 | 4,964 | 4,789 | 4,687 | ||||||||||||||||||||||||||||
Insurance |
209 |
368 | 338 | 406 | 278 | 285 | 298 | 363 | ||||||||||||||||||||||||||||
Capital Markets (3) |
3,611 |
3,758 | 3,301 | 3,756 | 2,903 | 3,004 | 3,154 | 2,951 | ||||||||||||||||||||||||||||
Corporate Support (3) |
90 |
134 | (231 | ) | 71 | (28 | ) | (148 | ) | 94 | (160 | ) | ||||||||||||||||||||||||
Total revenue |
17,209 |
16,985 | 15,672 | 16,739 | 15,074 | 14,631 | 14,154 | 13,485 | ||||||||||||||||||||||||||||
PCL |
1,007 |
881 | 1,424 | 1,050 | 840 | 659 | 920 | 813 | ||||||||||||||||||||||||||||
Non-interest expense |
9,374 |
9,232 | 8,730 | 9,256 | 9,019 | 8,599 | 8,308 | 8,324 | ||||||||||||||||||||||||||||
Income before income taxes |
6,828 |
6,872 | 5,518 | 6,433 | 5,215 | 5,373 | 4,926 | 4,348 | ||||||||||||||||||||||||||||
Income taxes |
1,394 |
1,458 | 1,128 | 1,302 | 993 | 887 | 976 | 766 | ||||||||||||||||||||||||||||
Net income |
$ |
5,434 |
$ | 5,414 | $ | 4,390 | $ | 5,131 | $ | 4,222 | $ | 4,486 | $ | 3,950 | $ | 3,582 | ||||||||||||||||||||
EPS – basic |
$ |
3.77 |
$ | 3.76 | $ | 3.03 | $ | 3.54 | $ | 2.92 | $ | 3.09 | $ | 2.75 | $ | 2.50 | ||||||||||||||||||||
– diluted |
3.76 |
3.75 | 3.02 | 3.54 | 2.91 | 3.09 | 2.74 | 2.50 | ||||||||||||||||||||||||||||
Effective income tax rate |
20.4% |
21.2% | 20.4% | 20.2% | 19.0% | 16.5% | 19.8% | 17.6% | ||||||||||||||||||||||||||||
Period average US$ equivalent of C$1.00 |
$ |
0.720 |
$ | 0.728 | $ | 0.704 | $ | 0.699 | $ | 0.733 | $ | 0.730 | $ | 0.734 | $ | 0.745 | ||||||||||||||||||||
| (1) | Fluctuations in the Canadian dollar relative to other foreign currencies have affected our consolidated results over the period. |
| (2) | On March 28, 2024, we completed the HSBC Canada transaction. HSBC Canada results have been consolidated from the closing date, and are included in our Personal Banking, Commercial Banking, Wealth Management and Capital Markets segments. |
| (3) | Teb adjusted. For further discussion, refer to the How we measure and report our business segments section. |
Financial condition |
Condensed balance sheets |
Table 36 |
As at October 31 (Millions of Canadian dollars) |
2025 |
2024 | ||||||
Assets |
||||||||
Cash and due from banks |
$ |
37,024 |
$ | 56,723 | ||||
Interest-bearing deposits with banks |
50,364 |
66,020 | ||||||
Securities, net of applicable allowance (1) |
561,788 |
439,918 | ||||||
Assets purchased under reverse repurchase agreements and securities borrowed |
309,683 |
350,803 | ||||||
Loans |
||||||||
Retail |
652,344 |
626,978 | ||||||
Wholesale |
397,171 |
360,439 | ||||||
Allowance for loan losses |
(7,093 |
) |
(6,037 | ) | ||||
Other – Derivatives |
177,206 |
150,612 | ||||||
– Other |
146,519 |
126,126 | ||||||
Total assets |
$ |
2,325,006 |
$ | 2,171,582 | ||||
Liabilities |
||||||||
Deposits |
$ |
1,515,616 |
$ | 1,409,531 | ||||
Other – Derivatives |
183,953 |
163,763 | ||||||
– Other |
472,325 |
457,550 | ||||||
Subordinated debentures |
13,961 |
13,546 | ||||||
Total liabilities |
2,185,855 |
2,044,390 | ||||||
Equity attributable to shareholders |
139,092 |
127,089 | ||||||
Non-controlling interests |
59 |
103 | ||||||
Total equity |
139,151 |
127,192 | ||||||
Total liabilities and equity |
$ |
2,325,006 |
$ | 2,171,582 | ||||
| (1) | Securities are comprised of trading and investment securities. |
Off-balance sheet arrangements |
Liquidity and credit enhancement facilities |
Table 37 |
2025 |
2024 | |||||||||||||||||||||
| As at October 31 (Millions of Canadian dollars) | Notional of committed amounts (1) |
Allocable notional amounts |
Maximum exposure to loss (2) |
Notional of committed amounts (1) |
Allocable notional amounts |
Maximum exposure to loss (2) | ||||||||||||||||
Backstop liquidity facilities |
$ |
64,359 |
$ |
60,433 |
$ |
60,642 |
$ | 56,511 | $ | 53,011 | $ 53,247 | |||||||||||
Credit enhancement facilities (3) |
3,926 |
3,926 |
3,926 |
3,500 | 3,500 | 3,500 | ||||||||||||||||
Total |
$ |
68,285 |
$ |
64,359 |
$ |
64,568 |
$ | 60,011 | $ | 56,511 | $ 56,747 | |||||||||||
| (1) | Based on total committed financing limit. |
| (2) | Not presented in the table above are derivative assets with a fair value of $23 million (October 31, 2024 – $32 million) which are a component of our total maximum exposure to loss from our interests in the multi-seller conduits. Refer to Note 8 of our 2025 Annual Consolidated Financial Statements for more details. |
| (3) | Includes $32 million (October 31, 2024 – $18 million) of financial standby letters of credit. |
Maximum exposure to loss by asset type |
Table 38 |
2025 |
2024 | |||||||||||||||||||||||
| As at October 31 (Millions of dollars) | US$ |
C$ |
Total C$ |
US$ | C$ | Total C$ | ||||||||||||||||||
Outstanding securitized assets |
||||||||||||||||||||||||
Auto and truck loans and leases |
$ |
15,316 |
$ |
5,407 |
$ |
26,877 |
$ | 12,882 | $ | 4,478 | $ | 22,409 | ||||||||||||
Consumer loans |
5,179 |
– |
7,260 |
4,931 | – | 6,864 | ||||||||||||||||||
Credit cards |
2,601 |
510 |
4,156 |
3,180 | 510 | 4,937 | ||||||||||||||||||
Dealer floor plan receivables |
1,312 |
683 |
2,523 |
1,063 | 683 | 2,163 | ||||||||||||||||||
Equipment receivables |
1,282 |
786 |
2,583 |
1,639 | 236 | 2,517 | ||||||||||||||||||
Fleet finance receivables |
2,906 |
159 |
4,233 |
2,227 | 255 | 3,355 | ||||||||||||||||||
Commercial loans |
449 |
592 |
1,221 |
701 | 592 | 1,567 | ||||||||||||||||||
Residential mortgages |
– |
3,570 |
3,570 |
– | 2,295 | 2,295 | ||||||||||||||||||
Student loans |
2,678 |
143 |
3,896 |
1,789 | 142 | 2,632 | ||||||||||||||||||
Trade receivables |
3,335 |
– |
4,676 |
3,132 | – | 4,359 | ||||||||||||||||||
Transportation finance |
2,469 |
112 |
3,573 |
2,512 | 153 | 3,649 | ||||||||||||||||||
Total |
$ |
37,527 |
$ |
11,962 |
$ |
64,568 |
$ | 34,056 | $ | 9,344 | $ | 56,747 | ||||||||||||
Canadian equivalent |
$ |
52,605 |
$ |
11,962 |
$ |
64,568 |
$ | 47,403 | $ | 9,344 | $ | 56,747 | ||||||||||||
Risk management |
Overview |
| • | Assess the impact of risks arising from choosing and executing a strategy while effectively balancing risk and reward to enable sustainable growth. |
| • | Collectively share the responsibility for risk management. |
| • | Undertake only risks we understand and make thoughtful and future-focused risk decisions, taking environmental and social considerations into account. |
| • | Always uphold our Purpose and vision, and consistently abide by our values and Code of Conduct as well as applicable laws, regulations and regulatory expectations to maintain our reputation and the trust of our clients, colleagues and communities. |
| • | Maintain a healthy and robust control environment to protect our stakeholders. |
| • | Use judgment and common sense. |
| • | Always be operationally prepared and financially resilient for a potential crisis. |
Enterprise risk management |
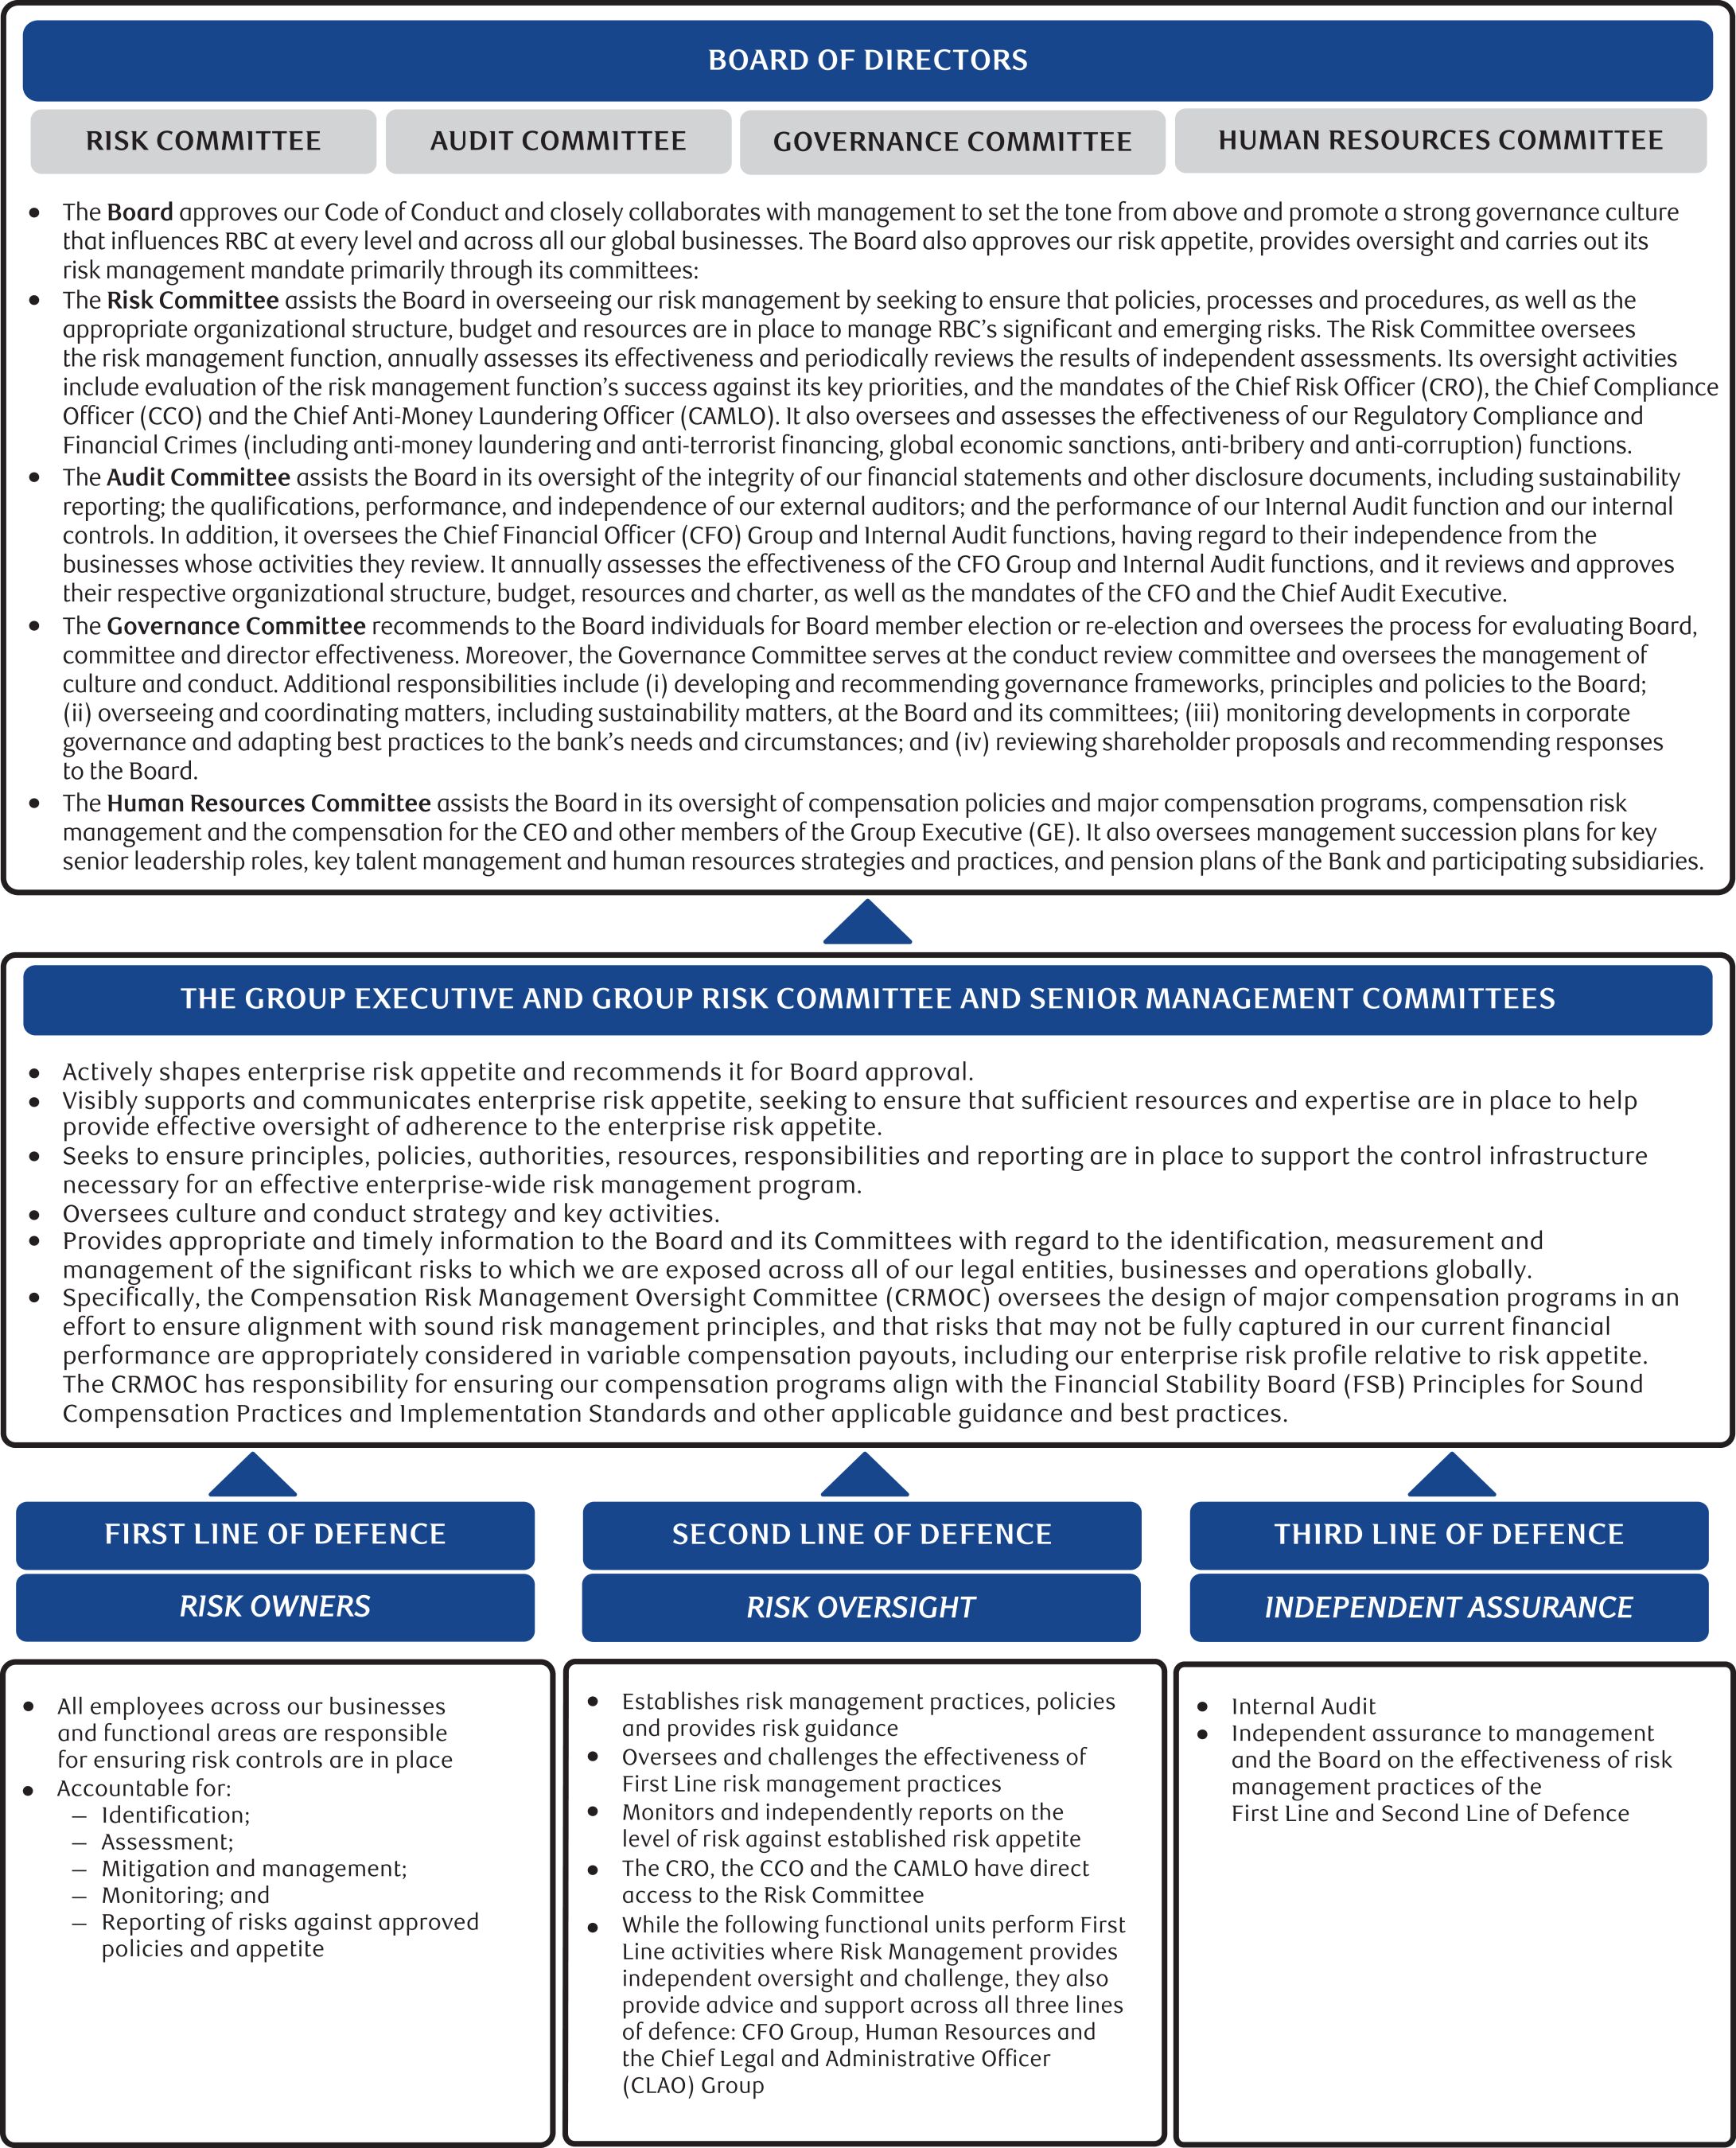
Effective risk management helps protect us from unacceptable losses or undesirable outcomes with respect to our earnings volatility, concentration, capital adequacy or other Principal Risks while supporting and enabling our overall business strategy. It requires the clear articulation of our risk appetite, which is the amount and type of risk that we are able and willing to accept in the pursuit of our business objectives. Risk appetite reflects our self-imposed upper bound to risk-taking, set at levels inside of regulatory limits and constraints, and influences our risk management philosophy, Code of Conduct, business practices and resource allocation. It provides clear boundaries and sets an overall tone for balancing risk-reward trade-offs intended to ensure the long-term viability of the organization. Our risk appetite is integrated into our strategic, financial and capital planning processes, as well as ongoing business decision-making processes, and is reviewed and approved annually by the Board. Our Enterprise Risk Appetite Framework (ERAF) outlines the foundational aspects of our approach to risk appetite, articulates our quantitative and qualitative risk appetite statements and their supporting measures and associated constraints, which can be applied at the enterprise, business segment, business unit and legal entity level, and describes our requirements and expectations to embed effective risk appetite practices throughout the organization. |
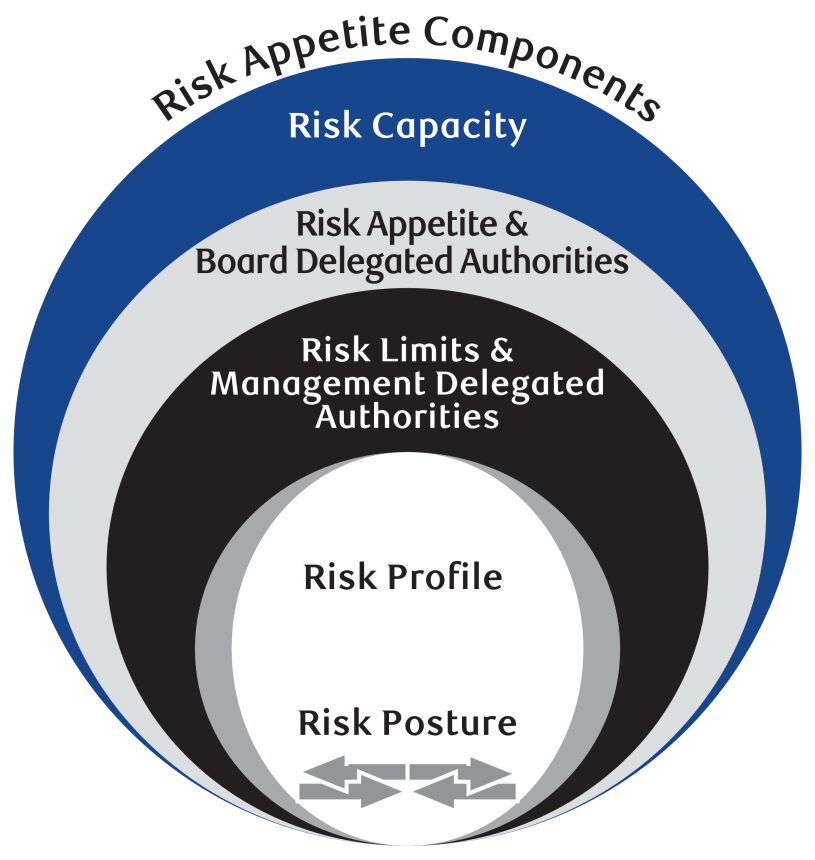 |
Risk appetite statements |
||||||||||||
Quantitative statements |
Qualitative statements |
|||||||||||
• Manage earnings volatility and exposure to future losses under normal and stressed conditions. • Avoid excessive concentrations of risk. • Ensure capital adequacy and sound management of liquidity and funding risk. • Ensure sound management of operational and regulatory compliance risk. • Maintain strong credit ratings and a risk profile in the top half of our peer group. |
• Always uphold our Purpose and vision and consistently abide by our values and Code of Conduct to maintain our reputation and the trust of our clients, colleagues and communities. • Undertake only risks we understand. Make thoughtful and future-focused risk decisions, taking environmental and social considerations into account. • Assess the impact of the risks arising from choosing and executing a strategy while effectively balancing risk and reward to enable sustainable growth. • Maintain a healthy and robust control environment to protect our stakeholders. • Always be operationally prepared and financially resilient for a potential crisis. |
|||||||||||
| • | Quantifying expected loss: losses that are statistically expected to occur as a result of conducting business in a given time period; |
| • | Quantifying unexpected loss: an estimate of the deviation of actual earnings from expected earnings, over a specified time horizon; |
| • | Stress testing evaluates, from a forward-looking perspective, the potential effects of a set of specified changes in risk factors, corresponding to exceptional but plausible adverse economic and financial market events. RBC’s stress testing programs are performed at different levels of the organization (enterprise-wide, subsidiary-level and risk-level) to allow relevant risk profiles and concentrations to be reflected in scenario design, analysis and decision-making; and |
| • | Back-testing: the realized values are compared to the parameter estimates that are currently used in an effort to ensure the parameters remain appropriate for regulatory and economic capital calculations. |
| • | Assessing the viability of long-term business plans and strategies; |
| • | Monitoring our risk profile relative to our risk appetite in terms of earnings and capital at risk; |
| • | Setting risk limits; |
| • | Identifying key risks to, and potential shifts in, our capital and liquidity levels, as well as our financial position; |
| • | Enhancing our understanding of available mitigating actions in response to potential adverse events; and |
| • | Assessing the adequacy of our capital and liquidity levels. |
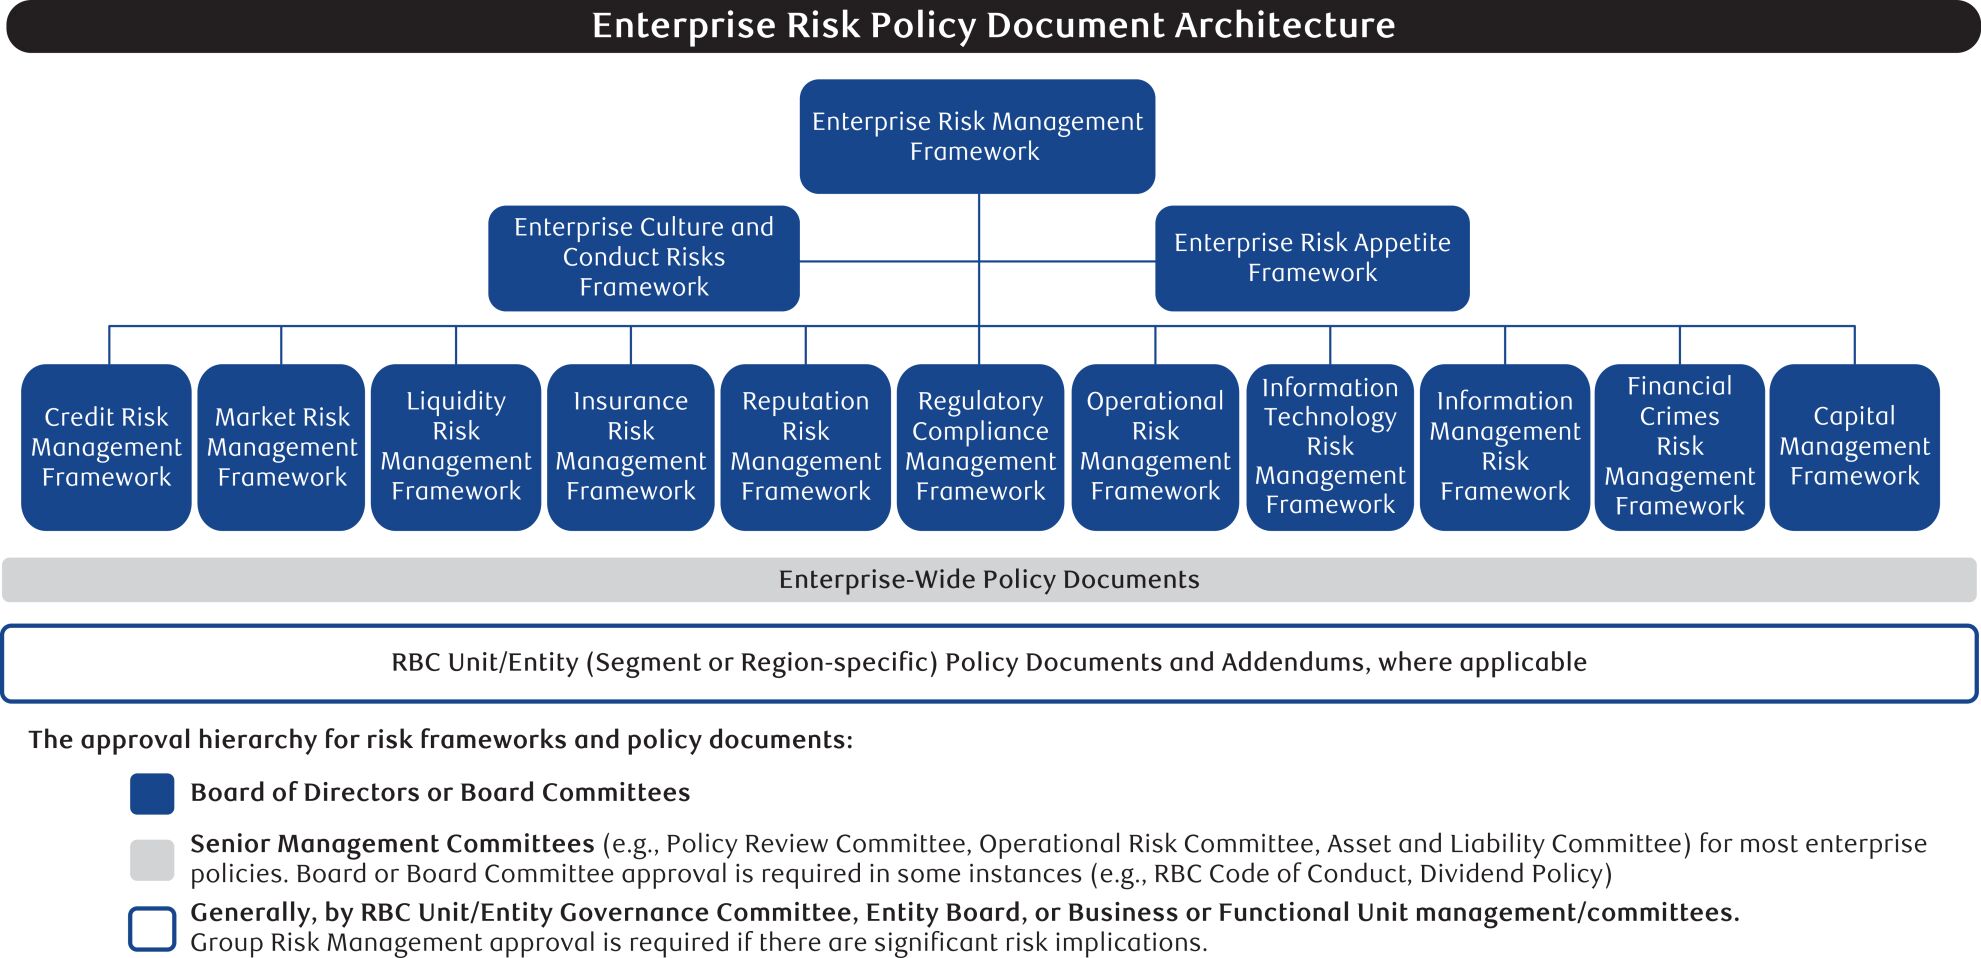
Top and emerging risks |
Top & emerging risks |
Description | |
Business and economic conditions  |
Our financial results are affected to varying degrees by the general business and economic conditions in the geographic regions in which we operate. These conditions may include factors such as: economic growth or contraction trends, consumer saving and spending habits; consumer and corporate borrowing and repayment patterns; unemployment rates; the differing economic trajectories among nations across the globe; global tensions and geopolitical uncertainty and conflicts; the level of business investment and overall business sentiment; trade policy developments; the emergence of a new pandemic outbreak or other health crisis; the level of government spending, including developments relating to tariffs and trade agreements, as well as fiscal and monetary policy; the level of activity and volatility of the financial markets; disruptions to energy and other commodity markets; competitiveness; supply chain challenges and labour shortages; the evolution of inflationary pressures; and possible stagflation or deflation. Moreover, interest rate changes and actions taken by central banks to manage inflation, deflation or the broader economy have implications for us. Our financial results are sensitive to changes in interest rates, as described in the Government fiscal, monetary and other policies section. For example, certain sectors, economies and markets have been adversely impacted by uncertainty generated by geopolitical shocks, such as protectionist trade policy developments, which continue to evolve. In addition, governments may face increasing fiscal challenges due to high debt-loads, ongoing deficits, higher spending pressures, and changing demographic and immigration trends. These fiscal challenges may limit future crisis response tools for governments and lead to higher taxes, spending cuts and adverse economic, market, credit and/or liquidity impacts. Moreover, monetary policy uncertainty, due to central bank challenges through a period of potential trade- or supply-related inflationary pressures, could increase economic, credit and market risks. A slowdown in economic growth or an economic downturn could adversely impact employment rates and household incomes, consumer spending, housing prices, corporate earnings and business investment, all of which could adversely affect our business, including, but not limited to, the demand for our loan and other products, and result in lower earnings and higher credit losses. There are also emerging risks related to technological developments and wealth and income inequality, as well as the broader implications of changing demographics and immigration, which could impact the labour market, productivity, the housing market, inflation, demand and consumer trends, and potentially have widespread societal and government policy implications. | |
Canadian housing and household indebtedness  |
Canadian housing and household indebtedness risks remain heightened given the current uncertain economic environment and affordability challenges. Risks around the ability of Canadian households to meet debt obligations could escalate if interest rates rise materially, if there is a resurgence in inflation or if the job market deteriorates significantly amidst economic and other geopolitical uncertainty, potentially resulting in, among other things, higher credit losses or reduced housing market activity. Moreover, elevated interest rates, slowing economic growth or an economic downturn could further adversely impact housing market activity and housing prices, which could push loan-to-value While interest rates have started to decline, Canadian real estate activity generally remains soft, with some markets showing signs of recovery. Challenging affordability conditions and an increase in condominium supply and construction costs may have an adverse impact on future real estate investment and demand. The combination of multiple challenges, including but not limited to elevated home prices, high debt levels, an increasingly high cost of living, a rising unemployment rate and government policy uncertainty (e.g., immigration policy), may make key Canadian housing markets particularly vulnerable to a potential economic shock or financial instability. | |
Information technology, cyber and third-party risks  |
Information technology (IT) risk, cyber risk and third-party risk remain top risks, not only for the financial services sector, but for other industries worldwide. Geopolitical tensions have increased the risk of nation state actors attacking critical infrastructure, including banks and critical third parties. We continue to be subject to the heightened inherent risk of cyberattacks, data breaches, cyber extortion and similar compromises, due to: (i) the size, scale and global nature of our operations; (ii) our heavy reliance on the internet to conduct day-to-day software-as-a-service Ransomware threats continue to grow in sophistication and ransomware is being used to launch major supply chain attacks. Resulting implications could include business interruptions, client service disruptions, financial loss, theft of intellectual property and confidential information, litigation, enhanced regulatory attention and penalties, as well as reputational damage. Furthermore, the adoption of emerging technologies, such as cloud computing; AI, including GenAI; and robotics, call for continued focus and investment to manage risks effectively. For more details on how we are managing these risks, refer to the Operational risk section. |
Top & emerging risks |
Description | |
Geopolitical uncertainty  |
Elevated geopolitical risks and tensions, particularly from global fragmentation, U.S. policy uncertainty, and recent and future trade-related developments, could continue to impact economies, markets and our financial and non-financial risks.Tensions remain elevated between China and the U.S. and its allies over issues, including trade, technology, human rights, Taiwan, Hong Kong and Macau. Moreover, these trade tensions produce additional vulnerabilities to the Canadian economy given the country’s trading relationships with the U.S. and China, Canada’s two largest trading partners. Tensions between China and its neighbours over territorial claims, and the prospect of even closer relations between China, Russia, Iran and North Korea, add further global and economic uncertainty. Additionally, continued weakening in the Chinese economy could negatively impact global economic growth. The Russia-Ukraine conflict has continued to produce turmoil in the geopolitical landscape, with ongoing impacts to the global economy and markets. Despite recent diplomatic efforts, the duration and path of the conflict remains uncertain and could continue to exacerbate global tensions, energy and other commodity shortages, supply chain disruptions, inflationary pressures, weakening sentiment and growth prospects, market volatility, cyberattacks and the proliferation of sanctions and trade measures. In particular, European countries continue to face uncertainty given their potential exposure to the conflict and to U.S. foreign policy changes, including through the countries’ military and trade relationships with impacted regions. Geopolitical tensions in the Middle East and other regions could also add to economic and market uncertainties. For example, ongoing tensions related to Iran’s nuclear program or those between Israel and Iran and its proxies could broaden or escalate. This could destabilize global security, markets and economic growth, along with key commodity markets. In addition, an uncertain geopolitical or economic environment could lead to increases in polarization, social unrest or terrorism, each of which could have direct or indirect impacts to the bank. More broadly, the future of global trade remains uncertain, as countries look to decrease reliance on the global supply chain and nations with differing values. Increased global polarization; protectionist measures, including protectionist trade policies, the imposition of tariffs and the re-negotiation of trade agreements; and economic nationalism could reshape global alliances and financial systems as the supply of critical goods of economic and national importance (e.g., energy, critical minerals, semiconductors) remains one of the top priorities of governments. Furthermore, a volatile geopolitical environment could generate an increase in espionage and foreign interference activities that indirectly or directly impact the financial services sector. We will continue to monitor these developments and others and will assess the implications they have on us. | |
Environmental and social (E&S) risk  |
We, like other organizations, are subject to regulatory requirements and stakeholder expectations to address E&S risks. E&S risks are unique and transverse in nature and may impact our Principal Risks in different ways and to varying degrees, including but not limited to strategic, operational, credit and compliance risks. For details on how we are managing E&S risk, refer to the Overview of other risks – Environmental and social risk section and the Legal and regulatory environment risk section. | |
Digital disruption and innovation  |
As the demand for digital banking services grows, the need to meet the rapidly evolving needs of clients and compete with traditional and non-traditional competitors has increased our strategic and reputation risks. Additional risks continue to emerge as demographic trends, evolving client expectations, the increased power to analyze data and the emergence of disruptors are creating competitive pressures across a number of sectors. Moreover, established technology companies, new competitors, digital assets and other products and regulatory changes continue to foster new business models that could challenge traditional banks and financial products. The regulatory landscape of digital assets, in particular as it relates to stablecoins, has evolved materially in the past year across multiple jurisdictions. RBC is closely monitoring and assessing emerging risks associated with wider adoption of stablecoins by the market and the related regulatory requirements. Finally, while the adoption of new technologies, such as AI (including GenAI) and machine learning, presents opportunities for us, it is resulting or could result in new and complex strategic, operational, regulatory, compliance and related reputational risks that would need to be managed effectively. RBC has established risk and governance processes to provide oversight and support in the implementation of AI use cases throughout the organization. | |
Privacy and data related risks  |
The protection and responsible use of Personal Information (PI) are critical to maintaining our clients’ trust. PI is information entrusted to RBC that identifies an individual or can be reasonably used to identify an individual and can relate to current, former and prospective clients, employees and contractors. In addition, the management and governance of our data also remains a top risk given the high value attributed to our data for the insights it can generate for clients and communities. Resulting implications from failing to manage data and privacy risks could include financial loss, theft of intellectual property and/or confidential information, litigation, enhanced regulatory attention and penalties, reputational damage and damaged client and employee trust. With the proliferation of AI, privacy regulators globally have begun issuing guidance around ensuring appropriate use of AI when processing personal information, in addition to guardrails around transparency and ensuring the rights of the individual are respected in the context of AI systems. Adherence to these guidelines and guardrails and trusted integration into existing privacy programs continues to be a focal area for RBC. For details on how we are managing these risks, refer to the Operational risk section. |
| Top & emerging risks |
Description | |
| Regulatory changes  |
The ongoing introduction of new or revised regulations requires enhanced focus across the organization on meeting additional or modified regulatory requirements and expectations across the multiple jurisdictions in which we operate. Regulatory reforms that have been implemented or are being implemented across multiple jurisdictions, such as in areas of digital and operational resilience, data and technology reforms, including AI, cyber security, capital, anti-money laundering and consumer protection continue to impact our operations and strategies. For more details, refer to the Overview of other risks – Legal and regulatory environment risk section. | |
| Culture and conduct risks  |
Our Purpose, vision, values and risk management principles define RBC’s culture. We demonstrate our culture through our conduct – the behaviours, decisions and actions or inactions of the organization and our employees. Culture and conduct risks are considered top risks for the financial services industry due to the impact that our choices, behaviours and overall risk governance can have on outcomes for our clients, shareholders and other stakeholders. We embed client considerations into our decision-making processes and continue to focus on the fair treatment of clients which also aligns with regulatory direction. We seek to be responsive to evolving employee needs while expecting employees to always act with integrity. Regulators continue to focus on conduct risks, and heightened expectations generally from regulators could lead to investigations, remediation requirements, higher compliance costs and enforcement actions and fines, and potential criminal prosecutions or imposition of sanctions, which may involve prohibitions or restrictions on some of our activities. While we take steps to continue to strengthen our conduct practices and prevent and detect risk outcomes that are not in keeping with our responsibilities to our stakeholders, such outcomes may not always be prevented or detected. Additionally, RBC continues to focus efforts on enhancing and fostering a strong risk culture. A strong risk culture reinforces risk-aware mindsets, competencies and behaviours by promoting responsible risk-taking decisions across the bank. For more details, refer to the Culture and conduct risk section. |
| The shaded text along with the tables specifically marked with an asterisk (*) in the following sections of the MD&A represent our disclosures on credit, market and liquidity and funding risks in accordance with IFRS 7 , Financial Instruments: Disclosures |
| Principal Risks |
| Credit risk |
• |
Ensuring credit quality is not compromised for growth; |
• |
Managing credit risks in transactions, relationships and portfolios; |
• |
Avoiding excessive concentrations in correlated credit risks; |
• |
Using our credit risk rating and scoring systems or other approved credit risk assessment or rating methodologies, policies and tools; |
• |
Pricing appropriately for the credit risk taken; |
• |
Detecting and preventing inappropriate credit risk through effective systems and controls; |
• |
Applying consistent credit risk exposure measurements; |
• |
Ongoing credit risk monitoring and administration; |
• |
Transferring credit risk to third parties where appropriate through approved credit risk mitigation techniques (e.g., sale, hedging, insurance, securitization); and |
• |
Avoiding activities that are inconsistent with our values, Code of Conduct or policies. |
| • | Probability of default (PD): An estimated percentage that represents the likelihood of default within a given time period of an obligor for a specific rating grade or for a particular pool of exposure. |
| • | Exposure at default (EAD): An amount expected to be owed by an obligor at the time of default. |
| • | Loss given default (LGD): An estimated percentage of EAD that is not expected to be recovered during the collections and recovery process following a default. |
| • | Basel PDs are based on long-run averages over an entire economic cycle. IFRS PDs are based on current conditions, adjusted for estimates of future conditions that will impact PD under probability-weighted macroeconomic scenarios. |
| • | Basel PDs consider the probability of default over the next 12 months. IFRS PDs consider the probability of default over the next 12 months only for instruments in stage 1. Expected credit losses for instruments in stage 2 are calculated using lifetime PDs. |
| • | Basel LGDs are based on severe but plausible downturn economic conditions. IFRS LGDs are based on current conditions, adjusted for estimates of future conditions that will impact LGD under probability-weighted macroeconomic scenarios. |
| • | Loans and acceptances outstanding, undrawn commitments, and other exposures, including contingent liabilities such as letters of credit and guarantees, debt securities carried at FVOCI or amortized cost and deposits with financial institutions. Undrawn commitments represent an estimate of the contractual amount that may be drawn upon at the time of default of an obligor. |
| • | Repo-style transactions, which include repurchase and reverse repurchase agreements and securities lending and borrowing transactions. For repo-style transactions, gross exposure represents the amount at which securities were initially financed, before taking collateral into account. |
| • | Derivative amounts which represent the credit equivalent amount, as defined by OSFI as the replacement cost plus an add-on amount for potential future credit exposure, scaled by a regulatory factor. For further details on replacement cost and credit equivalent amounts, refer to Note 9 of our 2025 Annual Consolidated Financial Statements. |
| Internal ratings map* |
Table 39 |
Ratings |
PD Bands |
|||||||||||
Business and Bank |
Sovereign |
BRR |
S&P |
Moody’s |
Description | |||||||
| 1 | 0.0000% – 0.0500% | 0.0000% – 0.0150% | 1+ | AAA | Aaa | Investment Grade | ||||||
| 2 | 0.0000% – 0.0500% | 0.0151% – 0.0250% | 1H | AA+ | Aa1 | |||||||
| 3 | 0.0000% – 0.0500% | 0.0251% – 0.0350% | 1M | AA | Aa2 | |||||||
| 4 | 0.0000% – 0.0500% | 0.0351% – 0.0450% | 1L | AA- | Aa3 | |||||||
| 5 | 0.0000% – 0.0550% | 0.0451% – 0.0550% | 2+H | A+ | A1 | |||||||
| 6 | 0.0551% – 0.0650% | 2+M | A | A2 | ||||||||
| 7 | 0.0651% – 0.0750% | 2+L | A- | A3 | ||||||||
| 8 | 0.0751% – 0.0850% | 2H | BBB+ | Baa1 | ||||||||
| 9 | 0.0851% – 0.1030% | 2M | BBB | Baa2 | ||||||||
| 10 | 0.1031% – 0.1775% | 2L | BBB- | Baa3 | ||||||||
| 11 | 0.1776% – 0.3470% | 2-H |
BB+ | Ba1 | Non-investment Grade | |||||||
| 12 | 0.3471% – 0.6460% | 2-M |
BB | Ba2 | ||||||||
| 13 | 0.6461% – 1.0620% | 2-L |
BB- | Ba3 | ||||||||
| 14 | 1.0621% – 1.5520% | 3+H | B+ | B1 | ||||||||
| 15 | 1.5521% – 2.2165% | 3+M | B | B2 | ||||||||
| 16 | 2.2166% – 4.5070% | 3+L | B- | B3 | ||||||||
| 17 | 4.5071% – 7.1660% | 3H | CCC+ | Caa1 | ||||||||
| 18 | 7.1661% – 13.1760% | 3M | CCC | Caa2 | ||||||||
| 19 | 13.1761% – 24.9670% | 3L | CCC- | Caa3 | ||||||||
| 20 | 24.9671% – 99.9990% | 4 | CC | Ca | ||||||||
| 21 | 100% | 5 | D | C | Impaired | |||||||
| 22 | 100% | 6 | D | C | ||||||||
| * | This table represents an integral part of our 2025 Annual Consolidated Financial Statements. |
| • | The use of standardized agreements such as the International Swaps and Derivatives Association Master Agreement and Credit Support Annex; |
| • | Generally restricting eligible collateral to high-quality liquid assets, primarily cash and highly-rated government securities, subject to appropriate haircuts; and |
| • | The use of initial margin and variation margin arrangements in accordance with regulatory requirements and internal risk standards. |
| • | Specific wrong-way risk, which exists when our exposure to a particular counterparty is positively correlated with the PD of the counterparty due to the nature of our transactions with them (e.g., loans collateralized by shares or debt issued by the counterparty or a related party). Specific wrong-way risk trades are permitted only on an exception basis and when explicitly pre-approved by GRM. Factors considered in reviewing such trades include the counterparty’s credit quality and collateral practices, the underlying exposure of the transaction and the existence of credit mitigation. |
| • | General wrong-way risk, which exists when our exposure to a particular counterparty is positively correlated with the PD of the counterparty due to general macroeconomic or market factors. General wrong-way risk can arise in various circumstances, depending on the transaction, collateral type, and the nature of the counterparty. We monitor general wrong-way risk using a variety of metrics including but not limited to correlation analysis between relevant macroeconomic or market factors and counterparty credit risk exposure. |
| Internal ratings map* |
Table 40 | |
PD bands |
Description | |
| 0.050% – 3.965% | Low risk | |
| 3.966% – 7.428% | Medium risk | |
| 7.429% – 99.99% | High risk | |
| 100% | Impaired/Default | |
| * | This table represents an integral part of our 2025 Annual Consolidated Financial Statements. |
| • | We employ a risk-based approach to property valuation. Property valuation methods include automated valuation models, which rely on market data such as comparable sales or regional price trends, and appraisals. |
| • | We continue to actively manage our mortgage portfolio and perform stress testing, based on a combination of increasing unemployment, rising interest rates and a downturn in real estate markets. |
| • | We seek to be in compliance with regulatory requirements that govern residential mortgage underwriting practices, including LTV parameters and property valuation requirements. |
| Credit risk exposure by portfolio, sector and geography |
Table 4 1 |
As at |
||||||||||||||||||||||||||||||||||||||||||||||||||||||||
| October 31 2025 |
October 31 2024 |
|||||||||||||||||||||||||||||||||||||||||||||||||||||||
Credit risk |
Counterparty credit risk |
Credit risk (1), (2) |
Counterparty credit risk (5) |
|||||||||||||||||||||||||||||||||||||||||||||||||||||
| On-balance sheet amount |
Off-balance sheet amount |
Repo-style transactions |
Total exposure |
On-balance sheet amount |
Off-balance sheetamount (3) |
Repo-style transactions |
Total exposure |
|||||||||||||||||||||||||||||||||||||||||||||||||
(Millions of Canadian dollars) |
Undrawn |
Other |
Derivatives |
Undrawn |
Other (4) |
Derivatives |
||||||||||||||||||||||||||||||||||||||||||||||||||
| Retail |
||||||||||||||||||||||||||||||||||||||||||||||||||||||||
| Residential secured (6) |
$ |
514,623 |
$ |
132,502 |
$ |
– |
$ |
– |
$ |
– |
$ |
647,125 |
$ |
498,014 |
$ |
124,743 |
$ |
– |
$ |
– |
$ |
– |
$ |
622,757 |
||||||||||||||||||||||||||||||||
| Qualifying revolving (7) |
36,407 |
104,369 |
– |
– |
– |
140,776 |
33,571 |
95,776 |
– |
– |
– |
129,347 |
||||||||||||||||||||||||||||||||||||||||||||
| Other retail |
57,003 |
22,522 |
164 |
– |
– |
79,689 |
53,257 |
21,530 |
162 |
– |
– |
74,949 |
||||||||||||||||||||||||||||||||||||||||||||
| Total retail |
$ |
608,033 |
$ |
259,393 |
$ |
164 |
$ |
– |
$ |
– |
$ |
867,590 |
$ |
584,842 |
$ |
242,049 |
$ |
162 |
$ |
– |
$ |
– |
$ |
827,053 |
||||||||||||||||||||||||||||||||
| Wholesale |
||||||||||||||||||||||||||||||||||||||||||||||||||||||||
| Agriculture |
$ |
14,181 |
$ |
3,344 |
$ |
86 |
$ |
– |
$ |
263 |
$ |
17,874 |
$ |
13,257 |
$ |
3,241 |
$ |
77 |
$ |
– |
$ |
210 |
$ |
16,785 |
||||||||||||||||||||||||||||||||
| Automotive |
14,188 |
9,602 |
677 |
– |
1,053 |
25,520 |
14,424 |
9,605 |
639 |
– |
1,454 |
26,122 |
||||||||||||||||||||||||||||||||||||||||||||
| Banking |
96,268 |
3,674 |
1,797 |
97,585 |
32,577 |
231,901 |
87,601 |
3,187 |
2,967 |
91,791 |
32,949 |
218,495 |
||||||||||||||||||||||||||||||||||||||||||||
| Consumer discretionary |
28,435 |
11,544 |
893 |
– |
1,779 |
42,651 |
24,516 |
11,719 |
918 |
– |
1,242 |
38,395 |
||||||||||||||||||||||||||||||||||||||||||||
| Consumer staples |
11,355 |
10,393 |
957 |
– |
2,299 |
25,004 |
10,094 |
8,631 |
795 |
– |
1,907 |
21,427 |
||||||||||||||||||||||||||||||||||||||||||||
| Oil and gas |
6,377 |
8,671 |
1,520 |
– |
2,312 |
18,880 |
6,365 |
8,688 |
2,002 |
– |
2,052 |
19,107 |
||||||||||||||||||||||||||||||||||||||||||||
| Financial services |
62,170 |
29,087 |
4,508 |
78,257 |
33,739 |
207,761 |
51,313 |
23,405 |
4,103 |
73,020 |
29,958 |
181,799 |
||||||||||||||||||||||||||||||||||||||||||||
| Financing products |
3,938 |
1,180 |
2,134 |
1,339 |
1,713 |
10,304 |
3,945 |
1,235 |
2,388 |
604 |
1,684 |
9,856 |
||||||||||||||||||||||||||||||||||||||||||||
| Forest products |
2,499 |
1,524 |
373 |
– |
76 |
4,472 |
2,225 |
1,589 |
387 |
– |
84 |
4,285 |
||||||||||||||||||||||||||||||||||||||||||||
| Governments |
330,943 |
8,762 |
2,251 |
18,150 |
10,031 |
370,137 |
283,893 |
7,891 |
2,149 |
13,334 |
7,933 |
315,200 |
||||||||||||||||||||||||||||||||||||||||||||
| Industrial products |
15,966 |
12,871 |
1,121 |
– |
922 |
30,880 |
15,526 |
12,463 |
940 |
– |
1,052 |
29,981 |
||||||||||||||||||||||||||||||||||||||||||||
| Information technology |
6,308 |
9,360 |
230 |
– |
845 |
16,743 |
6,353 |
7,892 |
251 |
42 |
976 |
15,514 |
||||||||||||||||||||||||||||||||||||||||||||
| Investments |
32,124 |
7,769 |
794 |
19 |
344 |
41,050 |
30,015 |
7,151 |
786 |
103 |
99 |
38,154 |
||||||||||||||||||||||||||||||||||||||||||||
| Mining and metals |
2,795 |
4,004 |
1,848 |
– |
520 |
9,167 |
2,821 |
3,950 |
1,684 |
– |
427 |
8,882 |
||||||||||||||||||||||||||||||||||||||||||||
| Public works and infrastructure |
2,786 |
2,499 |
1,513 |
– |
341 |
7,139 |
2,871 |
2,329 |
1,383 |
– |
300 |
6,883 |
||||||||||||||||||||||||||||||||||||||||||||
| Real estate and related |
123,801 |
24,890 |
2,289 |
169 |
1,478 |
152,627 |
115,332 |
26,197 |
2,209 |
83 |
1,115 |
144,936 |
||||||||||||||||||||||||||||||||||||||||||||
| Other services |
37,857 |
17,367 |
3,293 |
– |
1,621 |
60,138 |
35,980 |
15,870 |
3,461 |
– |
1,236 |
56,547 |
||||||||||||||||||||||||||||||||||||||||||||
| Telecommunication and media |
9,123 |
6,837 |
151 |
– |
2,674 |
18,785 |
7,814 |
7,210 |
159 |
– |
2,874 |
18,057 |
||||||||||||||||||||||||||||||||||||||||||||
| Transportation |
9,594 |
7,608 |
2,042 |
– |
2,450 |
21,694 |
10,517 |
7,235 |
1,533 |
– |
2,470 |
21,755 |
||||||||||||||||||||||||||||||||||||||||||||
| Utilities |
14,281 |
23,822 |
6,302 |
– |
5,845 |
50,250 |
14,652 |
21,110 |
5,993 |
– |
5,451 |
47,206 |
||||||||||||||||||||||||||||||||||||||||||||
| Other sectors |
7,632 |
1,526 |
1,467 |
276 |
31,090 |
41,991 |
11,119 |
2,578 |
1,887 |
227 |
24,520 |
40,331 |
||||||||||||||||||||||||||||||||||||||||||||
| Total wholesale |
$ |
832,621 |
$ |
206,334 |
$ |
36,246 |
$ |
195,795 |
$ |
133,972 |
$ |
1,404,968 |
$ |
750,633 |
$ |
193,176 |
$ |
36,711 |
$ |
179,204 |
$ |
119,993 |
$ |
1,279,717 |
||||||||||||||||||||||||||||||||
| Total exposure (1) |
$ |
1,440,654 |
$ |
465,727 |
$ |
36,410 |
$ |
195,795 |
$ |
133,972 |
$ |
2,272,558 |
$ |
1,335,475 |
$ |
435,225 |
$ |
36,873 |
$ |
179,204 |
$ |
119,993 |
$ |
2,106,770 |
||||||||||||||||||||||||||||||||
| By geography (8) |
||||||||||||||||||||||||||||||||||||||||||||||||||||||||
| Canada |
$ |
883,575 |
$ |
335,487 |
$ |
15,107 |
$ |
76,722 |
$ |
61,861 |
$ |
1,372,752 |
$ |
845,343 |
$ |
320,434 |
$ |
15,533 |
$ |
72,852 |
$ |
51,427 |
$ |
1,305,589 |
||||||||||||||||||||||||||||||||
| U.S. |
421,280 |
96,502 |
16,939 |
60,424 |
25,020 |
620,165 |
360,803 |
84,633 |
15,277 |
56,415 |
22,201 |
539,329 |
||||||||||||||||||||||||||||||||||||||||||||
| Europe |
58,568 |
24,150 |
2,141 |
40,398 |
31,158 |
156,415 |
55,936 |
21,879 |
3,432 |
31,987 |
31,555 |
144,789 |
||||||||||||||||||||||||||||||||||||||||||||
| Other International |
77,231 |
9,588 |
2,223 |
18,251 |
15,933 |
123,226 |
73,393 |
8,279 |
2,631 |
17,950 |
14,810 |
117,063 |
||||||||||||||||||||||||||||||||||||||||||||
| Total exposure (1) |
$ |
1,440,654 |
$ |
465,727 |
$ |
36,410 |
$ |
195,795 |
$ |
133,972 |
$ |
2,272,558 |
$ |
1,335,475 |
$ |
435,225 |
$ |
36,873 |
$ |
179,204 |
$ |
119,993 |
$ |
2,106,770 |
||||||||||||||||||||||||||||||||
(1) |
Excludes securitization, banking book equities and other assets not subject to the standardized or IRB approach. |
(2) |
EAD for standardized exposures are reported net of allowance for impaired assets and EAD for IRB exposures are reported gross of all ACL and partial write-offs as per regulatory definitions. |
(3) |
EAD for undrawn credit commitments and other off-balance sheet amounts are reported after the application of credit conversion factors. |
(4) |
Includes other off-balance sheet exposures such as letters of credit and guarantees. |
(5) |
Counterparty credit risk EAD reflects exposure amounts after netting. Collateral is included in EAD for repo-style transactions to the extent allowed by regulatory guidelines. Exchange traded derivatives are included in Other sectors. |
(6) |
Includes residential mortgages and home equity lines of credit. |
(7) |
Includes credit cards, unsecured lines of credit and overdraft protection products. |
(8) |
Geographic profile is based on country of residence of the borrower. |
Net International wholesale exposure by region, asset type and client type (1), (2) |
Table 42 |
| As at | ||||||||||||||||||||||||||||||||||||||||||||
October 31 2025 |
October 31 2024 |
|||||||||||||||||||||||||||||||||||||||||||
Asset type |
Client type |
|||||||||||||||||||||||||||||||||||||||||||
| (Millions of Canadian dollars) | Loans Outstanding |
Securities |
Repo-style transactions |
Derivatives |
Financials |
Sovereign |
Corporate |
Total |
Total | |||||||||||||||||||||||||||||||||||
Europe (excluding U.K.) |
$ |
18,894 |
$ |
25,402 |
$ |
8,612 |
$ |
3,307 |
$ |
31,708 |
$ |
7,757 |
$ |
16,750 |
$ |
56,215 |
$ | 52,307 | ||||||||||||||||||||||||||
U.K. |
14,302 |
22,914 |
5,789 |
2,363 |
18,939 |
14,219 |
12,210 |
45,368 |
36,311 | |||||||||||||||||||||||||||||||||||
Caribbean |
6,712 |
10,877 |
3,230 |
1,970 |
9,747 |
4,763 |
8,279 |
22,789 |
22,612 | |||||||||||||||||||||||||||||||||||
Asia-Pacific |
7,502 |
31,708 |
5,295 |
1,646 |
20,670 |
20,543 |
4,938 |
46,151 |
43,874 | |||||||||||||||||||||||||||||||||||
Other (4) |
3,095 |
1,605 |
3,273 |
141 |
2,844 |
1,915 |
3,355 |
8,114 |
8,022 | |||||||||||||||||||||||||||||||||||
Net International exposure (5) |
$ |
50,505 |
$ |
92,506 |
$ |
26,199 |
$ |
9,427 |
$ |
83,908 |
$ |
49,197 |
$ |
45,532 |
$ |
178,637 |
$ | 163,126 | ||||||||||||||||||||||||||
| (1) | Geographic profile is based on country of risk, which reflects our assessment of the geographic risk associated with a given exposure. Typically, this is the residence of the borrower. |
| (2) | Exposures are calculated on a fair value basis and net of collateral, which includes $467 billion against repo-style transactions (October 31, 2024 – $459 billion) and $20 billion against derivatives (October 31, 2024 – $16 billion). |
| (3) | Securities include $26 billion of trading securities (October 31, 2024 – $14 billion), $24 billion of deposits (October 31, 2024 – $29 billion), and $43 billion of investment securities (October 31, 2024 – $44 billion). |
| (4) | Includes exposures in the Middle East, Africa and Latin America. |
| (5) | Excludes $7,643 million (October 31, 2024 – $6,950 million) of exposures to supranational agencies. |
Residential mortgages and home equity lines of credit |
Table 43 |
As at October 31, 2025 |
||||||||||||||||||||||||||||||||||||
(Millions of Canadian dollars, except percentage amounts) |
Residential mortgages |
Home equity lines of credit (2) |
||||||||||||||||||||||||||||||||||
Insured (3) |
Uninsured |
Total |
Total |
|||||||||||||||||||||||||||||||||
Region (4) |
||||||||||||||||||||||||||||||||||||
Canada |
||||||||||||||||||||||||||||||||||||
Atlantic provinces |
$ |
9,143 |
42 |
% |
$ |
12,883 |
58 |
% |
$ |
22,026 |
$ |
1,745 |
||||||||||||||||||||||||
Quebec |
11,504 |
24 |
35,859 |
76 |
47,363 |
3,537 |
||||||||||||||||||||||||||||||
Ontario |
30,857 |
13 |
198,588 |
87 |
229,445 |
18,623 |
||||||||||||||||||||||||||||||
Alberta |
17,888 |
40 |
26,517 |
60 |
44,405 |
4,646 |
||||||||||||||||||||||||||||||
Saskatchewan and Manitoba |
8,299 |
39 |
12,813 |
61 |
21,112 |
1,728 |
||||||||||||||||||||||||||||||
B.C. and territories |
12,041 |
13 |
77,954 |
87 |
89,995 |
8,384 |
||||||||||||||||||||||||||||||
Total Canada (5) |
89,732 |
20 |
364,614 |
80 |
454,346 |
38,663 |
||||||||||||||||||||||||||||||
U.S. |
– |
– |
35,673 |
100 |
35,673 |
2,227 |
||||||||||||||||||||||||||||||
Other International |
– |
– |
3,394 |
100 |
3,394 |
1,387 |
||||||||||||||||||||||||||||||
Total International |
– |
– |
39,067 |
100 |
39,067 |
3,614 |
||||||||||||||||||||||||||||||
Total |
$ |
89,732 |
18 |
% |
$ |
403,681 |
82 |
% |
$ |
493,413 |
$ |
42,277 |
||||||||||||||||||||||||
| As at October 31, 2024 | ||||||||||||||||||||||||||||||||||||
(Millions of Canadian dollars, except percentage amounts) |
Residential mortgages | Home equity lines of credit (2) |
||||||||||||||||||||||||||||||||||
| Insured (3) |
Uninsured | Total | Total | |||||||||||||||||||||||||||||||||
Region (4) |
||||||||||||||||||||||||||||||||||||
Canada |
||||||||||||||||||||||||||||||||||||
Atlantic provinces |
$ | 8,692 | 43 | % | $ | 11,688 | 57 | % | $ | 20,380 | $ | 1,704 | ||||||||||||||||||||||||
Quebec |
11,781 | 25 | 35,129 | 75 | 46,910 | 3,346 | ||||||||||||||||||||||||||||||
Ontario |
32,011 | 14 | 189,638 | 86 | 221,649 | 18,173 | ||||||||||||||||||||||||||||||
Alberta |
18,804 | 43 | 24,459 | 57 | 43,263 | 4,448 | ||||||||||||||||||||||||||||||
Saskatchewan and Manitoba |
8,549 | 41 | 12,258 | 59 | 20,807 | 1,718 | ||||||||||||||||||||||||||||||
B.C. and territories |
12,607 | 14 | 75,575 | 86 | 88,182 | 8,061 | ||||||||||||||||||||||||||||||
Total Canada (5) |
92,444 | 21 | 348,747 | 79 | 441,191 | 37,450 | ||||||||||||||||||||||||||||||
U.S. |
– | – | 33,092 | 100 | 33,092 | 2,144 | ||||||||||||||||||||||||||||||
Other International |
– | – | 3,261 | 100 | 3,261 | 1,421 | ||||||||||||||||||||||||||||||
Total International |
– | – | 36,353 | 100 | 36,353 | 3,565 | ||||||||||||||||||||||||||||||
Total |
$ | 92,444 | 19 | % | $ | 385,100 | 81 | % | $ | 477,544 | $ | 41,015 | ||||||||||||||||||||||||
| (1) | Disclosure is provided in accordance with the requirements of OSFI’s Guideline B-20 (Residential Mortgage Underwriting Practices and Procedures). |
| (2) | Includes $42,260 million and $17 million of uninsured and insured home equity lines of credit, respectively (October 31, 2024 – $40,998 million and $17 million, respectively), reported within the personal loan category. The amounts in the U.S. and Other International include term loans collateralized by residential properties. |
| (3) | Insured residential mortgages are mortgages whereby our exposure to default is mitigated by insurance through the Canadian Mortgage and Housing Corporation or other private mortgage default insurers. |
| (4) | Region is based upon the address of the property mortgaged. The Atlantic provinces comprise Newfoundland and Labrador, Prince Edward Island, Nova Scotia and New Brunswick; B.C. and territories comprise British Columbia, Nunavut, Northwest Territories and Yukon. |
| (5) | Total consolidated residential mortgages in Canada of $454 billion (October 31, 2024 – $441 billion) includes $12 billion (October 31, 2024 – $12 billion) of mortgages with commercial clients in Commercial Banking, of which $9 billion (October 31, 2024 – $9 billion) are insured mortgages, and $17 billion (October 31, 2024 – $18 billion) of residential mortgages in Capital Markets, of which $17 billion (October 31, 2024 – $18 billion) are held for securitization purposes. All of the residential mortgages held for securitization purposes are insured (October 31, 2024 – all insured). |
Residential mortgages portfolio by amortization period |
Table 44 |
| As at | ||||||||||||||||||||||||||
October 31 2025 |
October 31 2024 |
|||||||||||||||||||||||||
Canada (2) |
U.S. and other International |
Total |
Canada (2) |
U.S. and other International |
Total | |||||||||||||||||||||
Amortization period |
||||||||||||||||||||||||||
≤ 25 years |
76% |
38% |
73% |
62% | 31% | 60% | ||||||||||||||||||||
> 25 years ≤ 30 years |
24 |
62 |
27 |
28 | 69 | 30 | ||||||||||||||||||||
> 30 years ≤ 35 years |
– |
– |
– |
10 | – | 10 | ||||||||||||||||||||
Total |
100% |
100% |
100% |
100% | 100% | 100% | ||||||||||||||||||||
| (1) | Disclosure is provided in accordance with the requirements of OSFI’s Guideline B-20 (Residential Mortgage Underwriting Practices and Procedures). |
| (2) | Our policy is to originate mortgages with amortization periods of 30 years or less. Amortization periods greater than 30 years reflect the impact of increases in interest rates on our variable rate mortgage portfolios. For these loans, the amortization period resets to the original amortization schedule upon renewal. We do not originate mortgage products with a structure that would result in negative amortization, as payments on variable rate mortgages automatically increase to ensure accrued interest is covered. |
Average LTV ratios |
Table 45 |
| For the year ended | ||||||||||||||||||
October 31 2025 |
October 31 2024 |
|||||||||||||||||
Uninsured |
Uninsured | |||||||||||||||||
Residential mortgages (2) |
RBC Homeline Plan products (3) |
Residential mortgages (2) |
RBC Homeline Plan products (3) |
|||||||||||||||
Average of newly originated and acquired for the period, by region (4) |
||||||||||||||||||
Atlantic provinces |
70% |
70% |
68% | 68% | ||||||||||||||
Quebec |
70 |
70 |
64 | 67 | ||||||||||||||
Ontario |
70 |
65 |
63 | 60 | ||||||||||||||
Alberta |
72 |
70 |
66 | 67 | ||||||||||||||
Saskatchewan and Manitoba |
72 |
73 |
69 | 70 | ||||||||||||||
B.C. and territories |
67 |
63 |
51 | 60 | ||||||||||||||
U.S. |
72 |
n.m. |
72 | n.m. | ||||||||||||||
Other International |
71 |
n.m. |
70 | n.m. | ||||||||||||||
Average of newly originated and acquired for the period (5), (6), (7) |
70% |
67% |
60% | 61% | ||||||||||||||
Total Personal Banking – Canada residential mortgages portfolio (8) |
60% |
49% |
56% | 47% | ||||||||||||||
| (1) | Disclosure is provided in accordance with the requirements of OSFI’s Guideline B-20 (Residential Mortgage Underwriting Practices and Procedures). |
| (2) | Residential mortgages exclude residential mortgages within the RBC Homeline Plan products. |
| (3) | RBC Homeline Plan products comprise both residential mortgages and home equity lines of credit. |
| (4) | Region is based upon the address of the property mortgaged. The Atlantic provinces comprise Newfoundland and Labrador, Prince Edward Island, Nova Scotia and New Brunswick; B.C. and territories comprise British Columbia, Nunavut, Northwest Territories and Yukon. |
| (5) | The average LTV ratios for newly originated and acquired uninsured residential mortgages and RBC Homeline Plan products are calculated on a weighted basis by mortgage amounts at origination. |
| (6) | For newly originated mortgages and RBC Homeline Plan products, LTV is calculated based on the total facility amount for the residential mortgage and RBC Homeline Plan product divided by the value of the related residential property. |
| (7) | The year ended October 31, 2024 includes the impact of the HSBC Canada portfolio acquired in the second quarter of 2024. Excluding the acquired HSBC Canada portfolio, the average of newly originated and acquired residential mortgages and RBC Homeline Plan products for the year ended October 31, 2024 was 70% and 65%, respectively. |
| (8) | Weighted by mortgage balances and adjusted for property values based on the Teranet – National Bank House Price Index |
| n.m. | not meaningful |
Gross impaired loans (GIL) |
Table 46 |
| As at and for the year ended | ||||||||
(Millions of Canadian dollars, except percentage amounts) |
October 31 2025 |
October 31 2024 |
||||||
Personal Banking (1) |
$ |
2,091 |
$ | 1,652 | ||||
Commercial Banking (1) |
3,362 |
2,372 | ||||||
Wealth Management |
609 |
508 | ||||||
Capital Markets |
2,620 |
1,335 | ||||||
Total GIL |
$ |
8,682 |
$ | 5,867 | ||||
Impaired loans, beginning balance |
$ |
5,867 |
$ | 3,704 | ||||
Classified as impaired during the period (new impaired) (1) |
9,687 |
6,272 | ||||||
Net repayments (1) |
(1,381 |
) |
(848 | ) | ||||
Amounts written off |
(3,326 |
) |
(2,521 | ) | ||||
Other (2) |
(2,165 |
) |
(740 | ) | ||||
Impaired loans, balance at end of period |
$ |
8,682 |
$ | 5,867 | ||||
GIL as a % of related loans and acceptances |
||||||||
Total GIL as a % of related loans and acceptances |
0.83% |
0.59% | ||||||
Personal Banking (1) |
0.38% |
0.31% | ||||||
Personal Banking – Canada |
0.34% |
0.26% | ||||||
Commercial Banking (1) |
1.74% |
1.29% | ||||||
Wealth Management |
0.47% |
0.42% | ||||||
Capital Markets |
1.52% |
0.88% | ||||||
| (1) | Certain GIL movements for Personal Banking – Canada and Commercial Banking are generally allocated to new impaired, as Net repayments and certain Other movements are not reasonably determinable. |
| (2) | Includes return to performing status during the period, recoveries of loans and advances previously written off, sold, amounts related to foreclosed properties held as investment properties and interests in joint ventures for certain co-lending arrangements, foreign exchange translation and other movements. |
Allowance for credit losses |
Table 47 | |||
| As at | ||||||||
(Millions of Canadian dollars) |
October 31 2025 |
October 31 2024 |
||||||
Personal Banking |
$ |
3,739 |
$ | 3,273 | ||||
Commercial Banking |
2,300 |
1,626 | ||||||
Wealth Management |
496 |
466 | ||||||
Capital Markets |
923 |
986 | ||||||
Corporate Support and other |
1 |
1 | ||||||
ACL on loans |
7,459 |
6,352 | ||||||
ACL on other financial assets (1) |
11 |
12 | ||||||
Total ACL |
$ |
7,470 |
$ | 6,364 | ||||
ACL on loans is comprised of: |
||||||||
Retail |
$ |
3,454 |
$ | 3,011 | ||||
Wholesale |
2,019 |
1,825 | ||||||
ACL on performing loans |
$ |
5,473 |
$ | 4,836 | ||||
ACL on impaired loans |
1,986 |
1,516 | ||||||
| (1) | ACL on other financial assets mainly represents allowances on debt securities measured at FVOCI and amortized cost, accounts receivable and financial guarantees. |
| Market risk |
| 1. | Positions whose revaluation gains and losses are reported in revenue, which includes: |
| a) | Changes in the fair value of instruments classified or designated as FVTPL, and |
| b) | Hedge ineffectiveness. |
| 2. | CET1 capital, which includes: |
| a) | All of the above, plus |
| b) | Changes in the fair value of FVOCI securities where revaluation gains and losses are reported as OCI, |
| c) | Changes in the Canadian dollar value of investments in foreign subsidiaries, net of hedges, due to foreign exchange translation, and |
| d) | Changes in the fair value of employee benefit plan deficits. |
| 3. | CET1 ratio, which includes: |
| a) | All of the above, plus |
| b) | Changes in RWA resulting from changes in traded market risk factors, and |
| c) | Changes in the Canadian dollar value of RWA due to foreign exchange translation. |
| 4. | The economic value of the Bank, which includes: |
| a) | Points 1 and 2 above, plus |
| b) | Changes in the economic value of other non-trading positions, net interest income and fee based income, as a result of changes in market risk factors. |
| • | VaR will not be predictive of future losses if the realized market movements differ significantly from the historical periods used to compute it. |
| • | VaR projects potential losses over a one-day holding period and does not project potential losses for risk positions held over longer time periods. |
| • | VaR is measured using positions at close of business and does not include the impact of trading and hedging activity over the course of a day. |
1 |
Trading portfolios are comprised of trading instruments in accordance with OSFI’s Capital Adequacy Requirements (CAR) Guideline. Trading involves market-making, positioning and arbitrage activities conducted primarily within our Global Markets business in the Capital Markets segment. |
| Market risk measures* |
Table 48 |
| October 31, 2025 |
October 31, 2024 |
|||||||||||||||||||||||||||||||
For the year ended |
For the year ended | |||||||||||||||||||||||||||||||
| (Millions of Canadian dollars) | As at |
Average |
High |
Low |
As at | Average | High | Low | ||||||||||||||||||||||||
| Equity |
$ |
17 |
$ |
16 |
$ |
30 |
$ |
11 |
$ | 23 | $ | 14 | $ | 26 | $ | 6 | ||||||||||||||||
| Foreign exchange |
5 |
4 |
13 |
2 |
6 | 5 | 10 | 2 | ||||||||||||||||||||||||
| Commodities |
8 |
7 |
11 |
3 |
11 | 6 | 11 | 4 | ||||||||||||||||||||||||
| Interest rate (1) |
33 |
23 |
33 |
17 |
23 | 30 | 44 | 19 | ||||||||||||||||||||||||
| Credit specific (2) |
5 |
7 |
10 |
5 |
8 | 8 | 9 | 7 | ||||||||||||||||||||||||
| Diversification (3) |
(38 |
) |
(32 |
) |
n.m. |
n.m. |
(37 | ) | (34 | ) | n.m. | n.m. | ||||||||||||||||||||
| Trading VaR |
$ |
30 |
$ |
25 |
$ |
35 |
$ |
18 |
$ | 34 | $ | 29 | $ | 41 | $ | 20 | ||||||||||||||||
| Total VaR |
$ |
40 |
$ |
36 |
$ |
56 |
$ |
22 |
$ | 34 | $ | 70 | $ | 138 | $ | 26 | ||||||||||||||||
| * | This table represents an integral part of our 2025 Annual Consolidated Financial Statements. |
| (1) | General credit spread risk and funding spread risk associated with uncollateralized derivatives are included under interest rate VaR. |
| (2) | Credit specific risk captures issuer-specific credit spread volatility. |
| (3) | Trading VaR is less than the sum of the individual risk factor VaR results due to risk factor diversification. |
| n.m. | not meaningful |
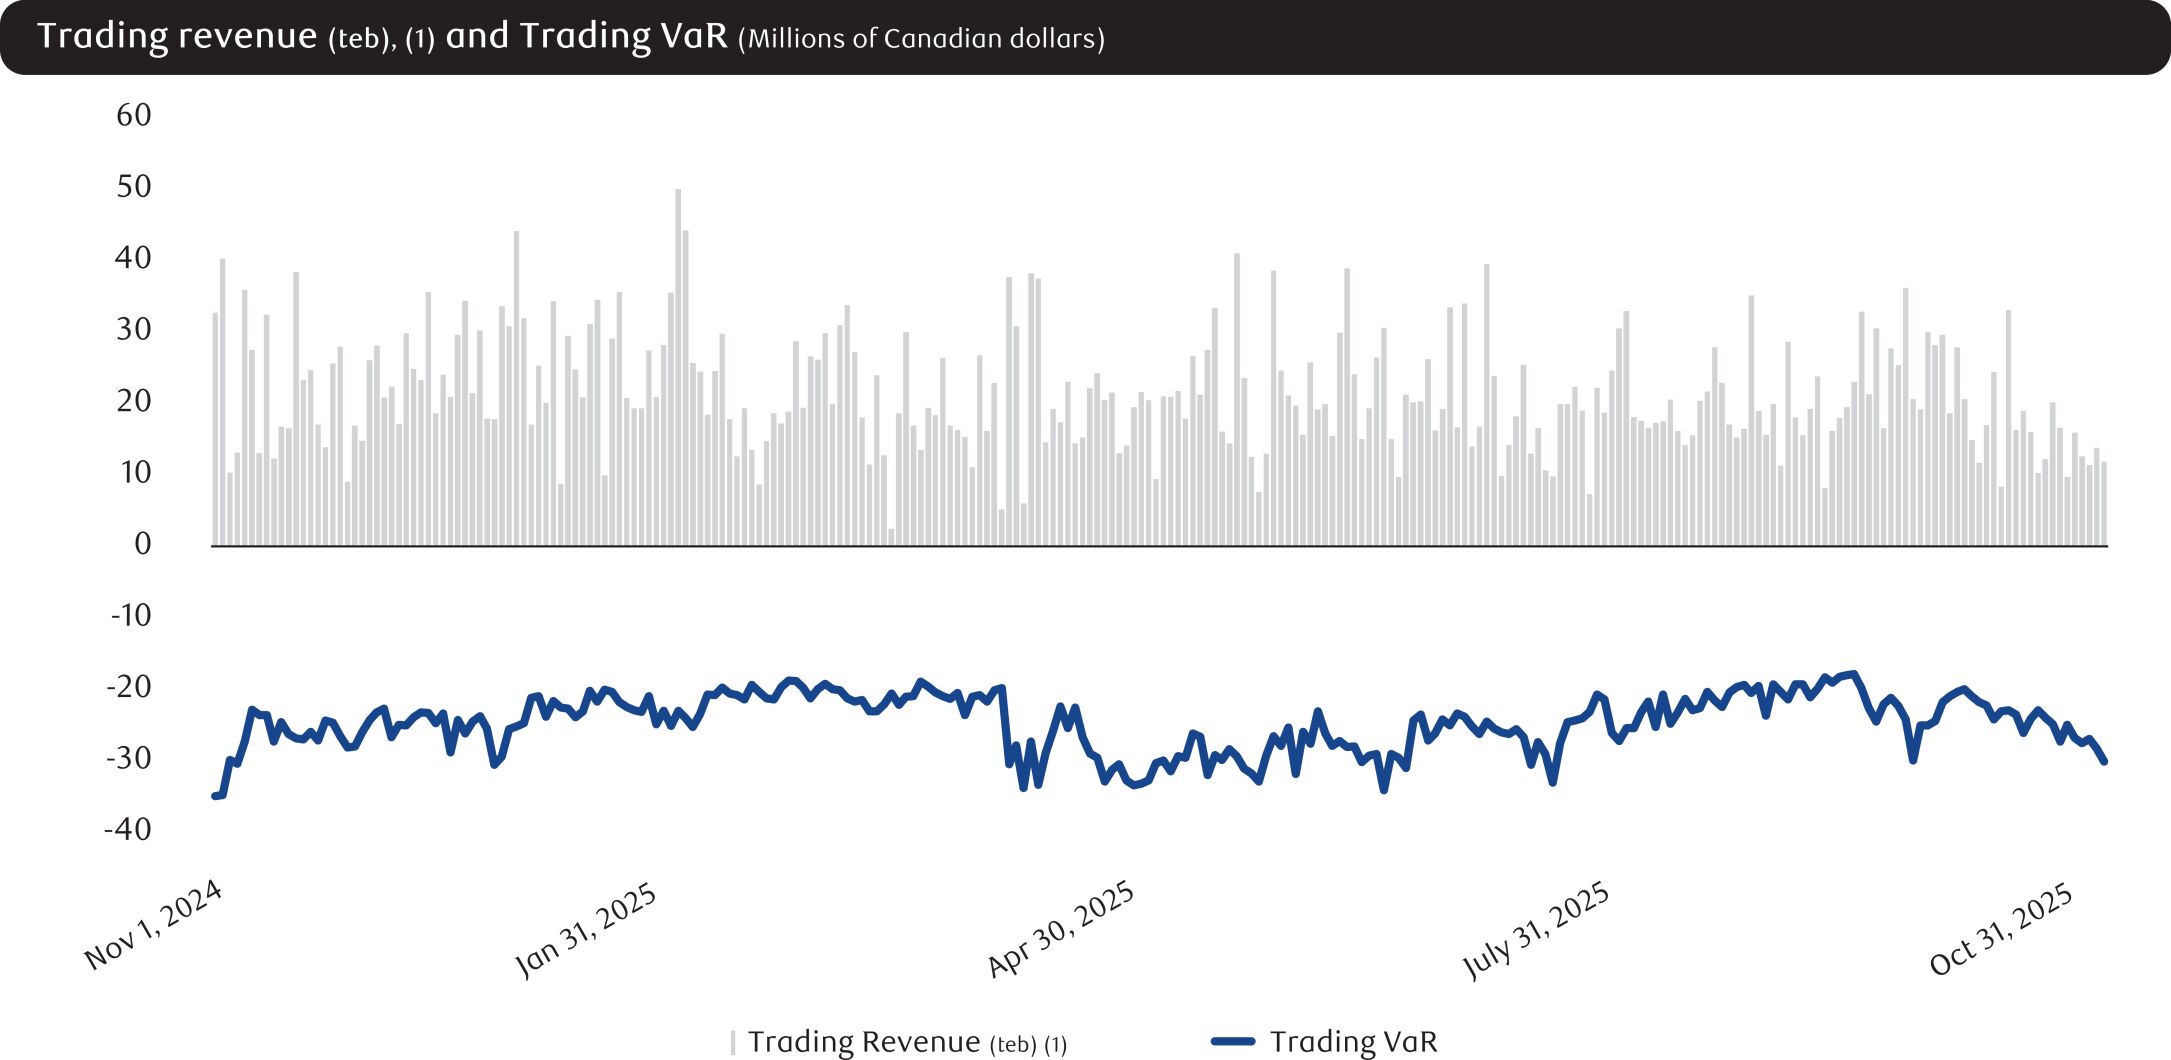
(1) |
Trading revenue (teb) in the chart above excludes the impact of loan underwriting commitments. |
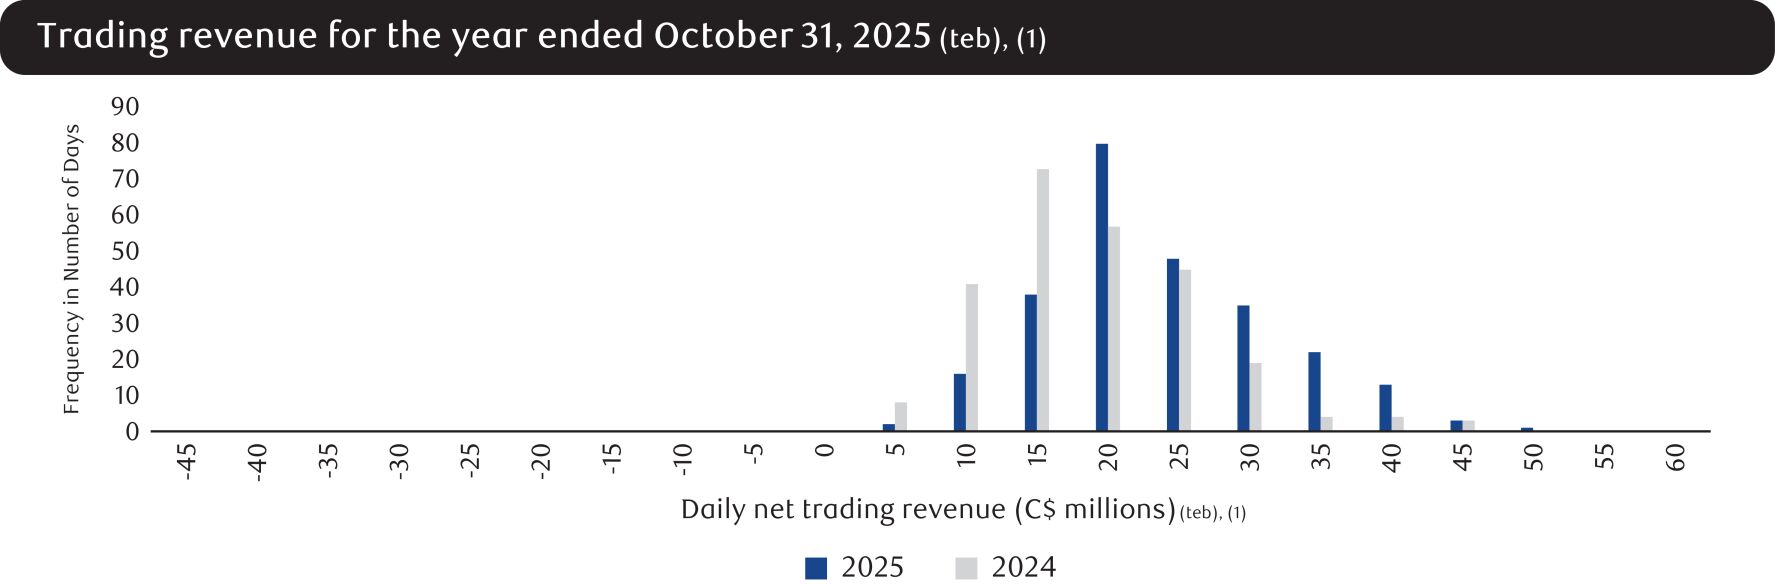
| (1) | Trading revenue (teb) amounts in the chart above exclude the impact of loan underwriting commitments and structured entities. |
2 |
IRRBB positions include the impact of derivatives in hedge accounting relationships, FVOCI securities used for interest rate risk management and economic hedges. |
Market risk – IRRBB measures* |
Table 49 | |||
October 31 2025 |
October 31 2024 |
|||||||||||||||||||||||||||||||||||
EVE risk |
NII risk |
|||||||||||||||||||||||||||||||||||
| (Millions of Canadian dollars) | Canadian dollar impact |
U.S. dollar and other impact |
Total |
Canadian dollar impact |
U.S. dollar and other impact |
Total |
EVE risk | NII risk (1) | ||||||||||||||||||||||||||||
Before-tax impact of: |
||||||||||||||||||||||||||||||||||||
100 bps increase in rates |
$ |
(2,228 |
) |
$ |
(420 |
) |
$ |
(2,648 |
) |
$ |
105 |
$ |
92 |
$ |
197 |
$ | (2,076 | ) | $ | 400 | ||||||||||||||||
100 bps decrease in rates |
2,037 |
(105 |
) |
1,932 |
(210 |
) |
(163 |
) |
(373 |
) |
1,663 | (502 | ) | |||||||||||||||||||||||
| * | This table represents an integral part of our 2025 Annual Consolidated Financial Statements. |
| (1) | Represents the 12-month NII exposure to an instantaneous and sustained shift in interest rates. |
| (2) | Effective the third quarter of 2025, EVE and NII risk for currencies other than the Canadian and U.S. dollar are presented within the U.S. dollar and other impact category. Previously, the impact of other currencies was presented in the Canadian dollar impact category. |
| Linkage of market risk to selected balance sheet items |
Table 5 0 |
| As at October 31, 2025 | ||||||||||||||
Market risk measure |
||||||||||||||
(Millions of Canadian dollars) |
Balance sheet amount |
Traded risk (1) |
Non-traded risk (2) |
Non-traded risk primary risk sensitivity | ||||||||||
| Assets subject to market risk |
||||||||||||||
| Cash and due from banks |
$ |
37,024 |
$ |
– |
$ |
37,024 |
Interest rate | |||||||
| Interest-bearing deposits with banks |
50,364 |
6 |
50,358 |
Interest rate | ||||||||||
| Securities |
||||||||||||||
| Trading |
219,067 |
188,249 |
30,818 |
Interest rate, credit spread | ||||||||||
| Investment, net of applicable allowance |
342,721 |
– |
342,721 |
Interest rate, credit spread, equity | ||||||||||
| Assets purchased under reverse repurchase agreements and securities borrowed |
309,683 |
251,147 |
58,536 |
Interest rate | ||||||||||
| Loans |
||||||||||||||
| Retail |
652,344 |
2 |
652,342 |
Interest rate | ||||||||||
| Wholesale |
397,171 |
3,271 |
393,900 |
Interest rate | ||||||||||
| Allowance for loan losses |
(7,093 |
) |
– |
(7,093 |
) |
Interest rate | ||||||||
| Other |
||||||||||||||
| Derivatives |
177,206 |
171,721 |
5,485 |
Interest rate, foreign exchange | ||||||||||
| Other assets |
138,647 |
62,521 |
76,126 |
Interest rate | ||||||||||
| Assets not subject to market risk (3) |
7,872 |
|||||||||||||
| Total assets |
$ |
2,325,006 |
$ |
676,917 |
$ |
1,640,217 |
||||||||
| Liabilities subject to market risk |
||||||||||||||
| Deposits |
$ |
1,515,616 |
$ |
74,278 |
$ |
1,441,338 |
Interest rate | |||||||
| Other |
||||||||||||||
| Obligations related to securities sold short |
49,891 |
49,428 |
463 |
|||||||||||
| Obligations related to assets sold under repurchase agreements and securities loaned |
289,516 |
252,956 |
36,560 |
Interest rate | ||||||||||
| Derivatives |
183,953 |
180,047 |
3,906 |
Interest rate, foreign exchange | ||||||||||
| Other liabilities |
108,398 |
49,489 |
58,909 |
Interest rate | ||||||||||
| Subordinated debentures |
13,961 |
– |
13,961 |
Interest rate | ||||||||||
| Liabilities not subject to market risk (4) |
24,520 |
|||||||||||||
| Total liabilities |
$ |
2,185,855 |
$ |
606,198 |
$ |
1,555,137 |
||||||||
| Total equity |
139,151 |
|||||||||||||
| Total liabilities and equity |
$ |
2,325,006 |
||||||||||||
(1) |
Traded risk includes positions that are classified or designated as FVTPL and positions whose revaluation gains and losses are reported in revenue within our trading portfolios. Market risk measures of VaR and stress tests are used as risk controls for traded risk. |
(2) |
Non-traded risk includes positions used in the management of IRRBB and other non-trading portfolios. Other material non-trading portfolios include positions from RBC Insurance and investment securities, net of applicable allowance, not included in IRRBB. |
(3) |
Assets not subject to market risk primarily include insurance-related assets. |
(4) |
Liabilities not subject to market risk primarily include insurance contract liabilities. |
| As at October 31, 2024 | ||||||||||||||||
| Market risk measure | ||||||||||||||||
(Millions of Canadian dollars) |
Balance sheet amount |
Traded risk (1) |
Non-traded risk (2) |
Non-traded risk primary risk sensitivity |
||||||||||||
| Assets subject to market risk |
||||||||||||||||
| Cash and due from banks |
$ | 56,723 | $ | – | $ | 56,723 | Interest rate | |||||||||
| Interest-bearing deposits with banks |
66,020 | 3 | 66,017 | Interest rate | ||||||||||||
| Securities |
||||||||||||||||
| Trading |
183,300 | 161,031 | 22,269 | Interest rate, credit spread | ||||||||||||
| Investment, net of applicable allowance |
256,618 | – | 256,618 | Interest rate, credit spread, equity | ||||||||||||
| Assets purchased under reverse repurchase agreements and securities borrowed |
350,803 | 299,032 | 51,771 | Interest rate | ||||||||||||
| Loans |
||||||||||||||||
| Retail |
626,978 | – | 626,978 | Interest rate | ||||||||||||
| Wholesale |
360,439 | 3,152 | 357,287 | Interest rate | ||||||||||||
| Allowance for loan losses |
(6,037 | ) | – | (6,037 | ) | Interest rate | ||||||||||
| Other |
||||||||||||||||
| Derivatives |
150,612 | 147,017 | 3,595 | Interest rate, foreign exchange | ||||||||||||
| Other assets |
115,133 | 47,936 | 67,197 | Interest rate | ||||||||||||
| Assets not subject to market risk (3) |
10,993 | |||||||||||||||
| Total assets |
$ | 2,171,582 | $ | 658,171 | $ | 1,502,418 | ||||||||||
| Liabilities subject to market risk |
||||||||||||||||
| Deposits |
$ | 1,409,531 | $ | 63,706 | $ | 1,345,825 | Interest rate | |||||||||
| Other |
||||||||||||||||
| Obligations related to securities sold short |
35,286 | 34,985 | 301 | |||||||||||||
| Obligations related to assets sold under repurchase agreements and securities loaned |
305,321 | 280,386 | 24,935 | Interest rate | ||||||||||||
| Derivatives |
163,763 | 157,587 | 6,176 | Interest rate, foreign exchange | ||||||||||||
| Other liabilities |
94,666 | 39,802 | 54,864 | Interest rate | ||||||||||||
| Subordinated debentures |
13,546 | – | 13,546 | Interest rate | ||||||||||||
| Liabilities not subject to market risk (4) |
22,277 | |||||||||||||||
| Total liabilities |
$ | 2,044,390 | $ | 576,466 | $ | 1,445,647 | ||||||||||
| Total equity |
127,192 | |||||||||||||||
| Total liabilities and equity |
$ | 2,171,582 | ||||||||||||||
| (1) | Traded risk includes positions that are classified or designated as FVTPL and positions whose revaluation gains and losses are reported in revenue within our trading portfolios. Market risk measures of VaR and stress tests are used as risk controls for traded risk. |
| (2) | Non-traded risk includes positions used in the management of IRRBB and other non-trading portfolios. Other material non-trading portfolios include positions from RBC Insurance and investment securities, net of applicable allowance, not included in IRRBB. |
| (3) | Assets not subject to market risk primarily include insurance-related assets. |
| (4) | Liabilities not subject to market risk primarily include insurance contract liabilities. |
| Liquidity and funding risk |
| • | The Board, the Risk Committee of the Board, the GRC and the ALCO regularly review information on our consolidated liquidity position; |
| • | The PRC approves the Liquidity Risk Policy, which establishes minimum risk control elements in accordance with the Board-approved risk appetite and the LRMF, and the Pledging Policy, which outlines the requirements and authorities for the management of our pledging activities; |
| • | The ALCO annually approves the Enterprise Liquidity Contingency Plan (ELCP) and provides strategic direction and oversight to Corporate Treasury, other functions, and business segments on the management of liquidity and funding. |
| • | Maintaining a sufficient buffer of cash, central bank reserves and unencumbered marketable securities, supported by a demonstrated capacity to monetize these securities during stress; |
| • | Access to a broad range of funding sources, including a stable base of core client deposits and a diversified wholesale funding mix; |
| • | Access to central bank funding facilities in Canada and the U.S., and select other jurisdictions in which we operate; |
| • | Timely and granular risk measurement and reporting to control and monitor liquidity sources and uses, and inform liquidity risk management decisions; |
| • | A comprehensive program for liquidity stress testing and crisis management; |
| • | Governance of pledging activity through limits and designated liquid asset buffers to address potential increased pledging activity; |
| • | Achieving an appropriate balance between the level of exposure allowed under our risk appetite and the cost of risk mitigation; |
| • | Transparent liquidity transfer pricing and cost allocation mechanisms to align risk management with business strategies; and |
| • | A three-lines-of-defence |
| Liquidity reserve |
Table 51 |
| As at October 31, 2025 |
||||||||||||||||||||
| (Millions of Canadian dollars) | Bank-owned liquid assets |
Securities received as collateral from securities financing and derivative transactions |
Total liquid assets |
Encumbered liquid assets |
Unencumbered liquid assets |
|||||||||||||||
| Cash and deposits with banks |
$ |
87,388 |
$ |
– |
$ |
87,388 |
$ |
3,195 |
$ |
84,193 |
||||||||||
| Securities issued or guaranteed by sovereigns, central banks or multilateral development banks (1) |
436,725 |
352,312 |
789,037 |
434,060 |
354,977 |
|||||||||||||||
| Other securities |
179,279 |
156,840 |
336,119 |
207,703 |
128,416 |
|||||||||||||||
| Other liquid assets (2) |
50,082 |
– |
50,082 |
40,974 |
9,108 |
|||||||||||||||
| Total liquid assets |
$ |
753,474 |
$ |
509,152 |
$ |
1,262,626 |
$ |
685,932 |
$ |
576,694 |
||||||||||
| As at October 31, 2024 | ||||||||||||||||||||
| (Millions of Canadian dollars) | Bank-owned liquid assets |
Securities received as collateral from securities financing and derivative transactions |
Total liquid assets |
Encumbered liquid assets |
Unencumbered liquid assets |
|||||||||||||||
| Cash and deposits with banks |
$ | 122,743 | $ | – | $ | 122,743 | $ | 3,269 | $ | 119,474 | ||||||||||
| Securities issued or guaranteed by sovereigns, central banks or multilateral development banks (1) |
323,826 | 385,479 | 709,305 | 426,552 | 282,753 | |||||||||||||||
| Other securities |
165,875 | 126,205 | 292,080 | 163,635 | 128,445 | |||||||||||||||
| Other liquid assets (2) |
37,601 | – | 37,601 | 31,583 | 6,018 | |||||||||||||||
| Total liquid assets |
$ | 650,045 | $ | 511,684 | $ | 1,161,729 | $ | 625,039 | $ | 536,690 | ||||||||||
| As at | ||||||||||||||||||||
(Millions of Canadian dollars) |
October 31 2025 |
October 31 2024 |
||||||||||||||||||
| Royal Bank of Canada |
$ |
279,012 |
$ | 243,915 | ||||||||||||||||
| Foreign branches |
77,977 |
69,723 | ||||||||||||||||||
| Subsidiaries |
219,705 |
223,052 | ||||||||||||||||||
| Total unencumbered liquid assets |
$ |
576,694 |
$ | 536,690 | ||||||||||||||||
| (1) | Includes liquid securities issued by provincial governments and U.S. government-sponsored entities working under U.S. Federal government’s conservatorship (e.g., Federal National Mortgage Association and Federal Home Loan Mortgage Corporation). |
| (2) | Encumbered liquid assets amount represents cash collateral and margin deposit amounts pledged related to OTC and exchange-traded derivative transactions. |
| Asset encumbrance |
Table 52 |
As at October 31, 2025 |
||||||||||||||||||||||||||||||||||||
Total Assets |
Encumbered |
Unencumbered |
||||||||||||||||||||||||||||||||||
(Millions of Canadian dollars) |
Bank-owned assets |
Securities received as collateral from securities financing and derivative transactions |
Total |
Pledged as collateral |
Other |
Available as collateral |
Other |
|||||||||||||||||||||||||||||
| Cash and deposits with banks |
$ |
87,388 |
$ |
– |
$ |
87,388 |
$ |
– |
$ |
3,195 |
$ |
84,193 |
$ |
– |
||||||||||||||||||||||
| Securities (4) |
575,466 |
573,672 |
1,149,138 |
670,404 |
33,437 |
441,458 |
3,839 |
|||||||||||||||||||||||||||||
| Loans, net of allowance for loan losses |
||||||||||||||||||||||||||||||||||||
| Mortgage securities |
54,607 |
– |
54,607 |
26,714 |
– |
27,893 |
– |
|||||||||||||||||||||||||||||
| Mortgage loans |
438,012 |
– |
438,012 |
64,928 |
– |
41,010 |
332,074 |
|||||||||||||||||||||||||||||
| Other loans |
549,803 |
– |
549,803 |
5,244 |
– |
26,496 |
518,063 |
|||||||||||||||||||||||||||||
| Derivatives |
177,206 |
– |
177,206 |
– |
– |
– |
177,206 |
|||||||||||||||||||||||||||||
| Others (5) |
146,519 |
– |
146,519 |
40,974 |
– |
9,108 |
96,437 |
|||||||||||||||||||||||||||||
| Total |
$ |
2,029,001 |
$ |
573,672 |
$ |
2,602,673 |
$ |
808,264 |
$ |
36,632 |
$ |
630,158 |
$ |
1,127,619 |
||||||||||||||||||||||
As at October 31, 2024 |
||||||||||||||||||||||||||||||||||||
Total Assets |
Encumbered |
Unencumbered |
||||||||||||||||||||||||||||||||||
(Millions of Canadian dollars) |
Bank-owned assets |
Securities received as collateral from securities financing and derivative transactions |
Total |
Pledged as collateral |
Other (1) |
Available as collateral (2) |
Other (3) |
|||||||||||||||||||||||||||||
| Cash and deposits with banks |
$ |
122,743 |
$ |
– |
$ |
122,743 |
$ |
– |
$ |
3,269 |
$ |
119,474 |
$ |
– |
||||||||||||||||||||||
| Securities (4) |
450,719 |
571,869 |
1,022,588 |
614,654 |
31,156 |
373,206 |
3,572 |
|||||||||||||||||||||||||||||
| Loans, net of allowance for loan losses (6) |
||||||||||||||||||||||||||||||||||||
| Mortgage securities |
57,450 |
– |
57,450 |
27,927 |
– |
29,523 |
– |
|||||||||||||||||||||||||||||
| Mortgage loans |
419,522 |
– |
419,522 |
71,307 |
– |
40,851 |
307,364 |
|||||||||||||||||||||||||||||
| Other loans |
504,408 |
– |
504,408 |
6,343 |
– |
25,250 |
472,815 |
|||||||||||||||||||||||||||||
| Derivatives |
150,612 |
– |
150,612 |
– |
– |
– |
150,612 |
|||||||||||||||||||||||||||||
| Others (5) |
126,126 |
– |
126,126 |
31,583 |
– |
6,018 |
88,525 |
|||||||||||||||||||||||||||||
| Total |
$ |
1,831,580 |
$ |
571,869 |
$ |
2,403,449 |
$ |
751,814 |
$ |
34,425 |
$ |
594,322 |
$ |
1,022,888 |
||||||||||||||||||||||
(1) |
Includes assets restricted from use to generate secured funding due to legal or other constraints. |
(2) |
Represents assets that are immediately available for use as collateral, including NHA MBS, our unencumbered mortgage loans that qualify as eligible collateral at FHLB, as well as loans that qualify as eligible collateral for discount window facility available to us and lodged at the FRBNY. |
(3) |
Other unencumbered assets are not subject to any restrictions on their use to secure funding or as collateral but would not be considered immediately available. |
(4) |
Includes bank-owned liquid assets and securities received as collateral from off-balance sheet securities financing, derivative transactions and margin lending. Includes $33 billion (October 31, 2024 – $31 billion) of collateral received through reverse repurchase transactions that cannot be rehypothecated in its current legal form. |
(5) |
The Pledged as collateral amount represents cash collateral and margin deposit amounts pledged related to OTC and exchange-traded derivative transactions. |
(6) |
Effective the first quarter of 2025, mortgage securities, mortgage loans and other loans are presented net of allowance for loan losses. Comparative amounts have been revised from those previously presented to conform to this presentation. |
| Funding strategy Maintaining a diversified funding base is a key strategy for managing our liquidity risk profile. Core funding, comprising capital, longer-term wholesale liabilities and a diversified pool of personal as well as the stable portion of our commercial and institutional deposits, is the foundation of our structural liquidity position. Wholesale funding activities are well-diversified by geography, investor segment, instrument, currency, structure and maturity. We maintain an ongoing presence in different funding markets, which allows us to continuously monitor market developments and trends, identify opportunities and risks and take appropriate and timely actions. We continuously evaluate opportunities to expand into new markets and untapped investor segments since diversification expands our wholesale funding flexibility, minimizes funding concentration and dependency and generally reduces financing costs. We regularly assess our funding concentration and have implemented limits on certain funding sources to support diversification of our funding base. |
| We use residential mortgage and credit card securitization programs as a source of funding and for liquidity and asset/liability management purposes. Our total secured long-term funding includes outstanding MBS sold, covered bonds that are collateralized with residential mortgages and securities backed by credit card receivables. |
| Long-term funding sources* (1) |
Table 5 3 |
| As at | ||||||||||||
(Millions of Canadian dollars) |
October 31 2025 |
October 31 2024 |
||||||||||
| Unsecured long-term funding |
$ |
169,621 |
$ | 150,682 | ||||||||
| Secured long-term funding |
76,550 |
83,353 | ||||||||||
| Subordinated debentures |
13,941 |
13,714 | ||||||||||
$ |
260,112 |
$ | 247,749 | |||||||||
| * | This table represents an integral part of our 2025 Annual Consolidated Financial Statements. |
| (1) | Based on original term to maturity greater than 1 year. |
| Programs by geography |
Table 5 4 |
Canada |
U.S. |
Europe/Asia | ||
| • Canadian Shelf Program – $25 billion |
• U.S. Shelf Program – US$75 billion |
• European Debt Issuance Program – US$75 billion | ||
| • Global Covered Bond Program – € 75 billion | ||||
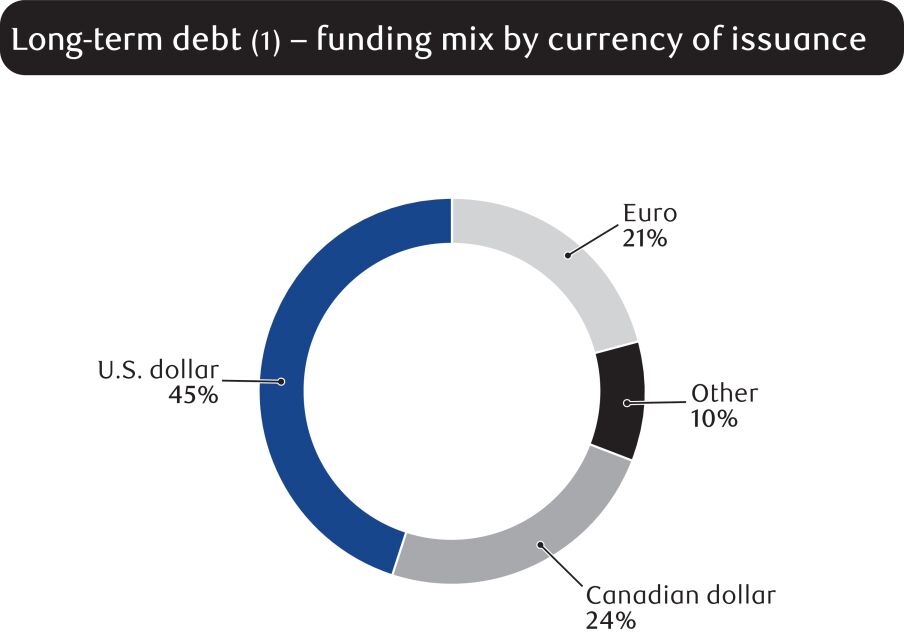 |
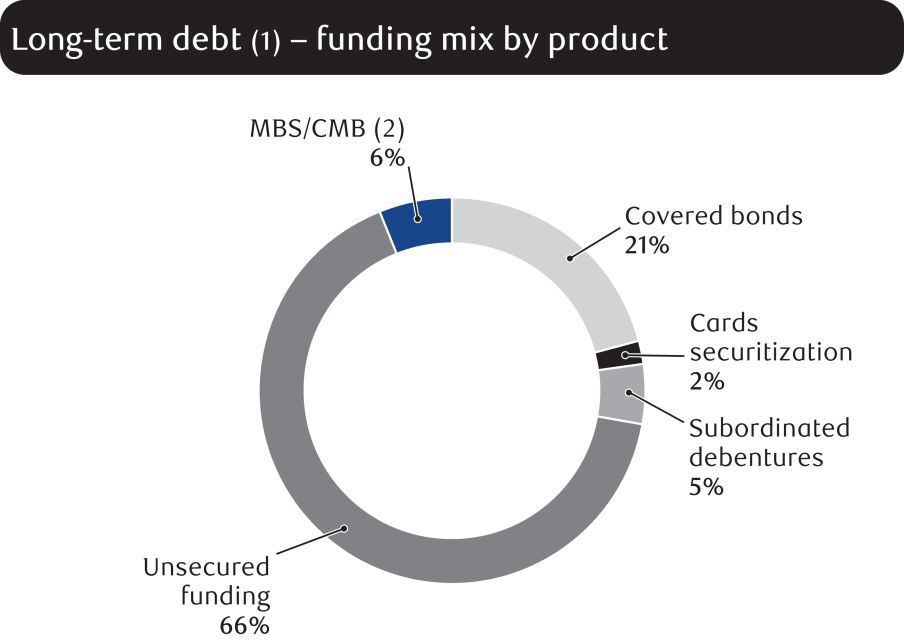 | |
| (1) Includes unsecured and secured long-term funding and subordinated debentures with an original term to maturity greater than 1 year |
(1) Includes unsecured and secured long-term funding and subordinated debentures with an original term to maturity greater than 1 year (2) Mortgage-backed securities and Canada Mortgage Bonds | |
| Composition of wholesale funding (1) |
Table 5 5 |
| As at October 31, 2025 |
||||||||||||||||||||||||||||||||
| (Millions of Canadian dollars) | Less than 1 month |
1 to 3 months |
3 to 6 months |
6 to 12 months |
Less than 1 year sub-total |
1 year to 2 years |
2 years and greater |
Total |
||||||||||||||||||||||||
| Deposits from banks (2) |
$ |
3,255 |
$ |
311 |
$ |
243 |
$ |
1,014 |
$ |
4,823 |
$ |
– |
$ |
– |
$ |
4,823 |
||||||||||||||||
| Certificates of deposit and commercial paper (3) |
15,877 |
20,614 |
38,985 |
38,595 |
114,071 |
– |
– |
114,071 |
||||||||||||||||||||||||
| Asset-backed commercial paper (4) |
4,989 |
5,324 |
8,027 |
1,680 |
20,020 |
– |
– |
20,020 |
||||||||||||||||||||||||
| Senior unsecured medium-term notes (5) |
2,412 |
4,858 |
8,257 |
22,164 |
37,691 |
29,161 |
63,988 |
130,840 |
||||||||||||||||||||||||
| Senior unsecured structured notes (6) |
5,050 |
1,841 |
2,581 |
2,986 |
12,458 |
3,243 |
13,430 |
29,131 |
||||||||||||||||||||||||
| Mortgage securitization |
– |
509 |
200 |
1,202 |
1,911 |
2,479 |
12,249 |
16,639 |
||||||||||||||||||||||||
| Covered bonds/asset-backed securities (7) |
– |
3,257 |
3,233 |
13,136 |
19,626 |
20,277 |
20,010 |
59,913 |
||||||||||||||||||||||||
| Subordinated liabilities |
– |
2,103 |
– |
– |
2,103 |
– |
11,838 |
13,941 |
||||||||||||||||||||||||
| Other (8) |
11 |
60 |
2,876 |
90 |
3,037 |
256 |
23,181 |
26,474 |
||||||||||||||||||||||||
| Total |
$ |
31,594 |
$ |
38,877 |
$ |
64,402 |
$ |
80,867 |
$ |
215,740 |
$ |
55,416 |
$ |
144,696 |
$ |
415,852 |
||||||||||||||||
| Of which: |
||||||||||||||||||||||||||||||||
| – Secured |
$ |
4,989 |
$ |
9,106 |
$ |
14,264 |
$ |
16,018 |
$ |
44,377 |
$ |
22,756 |
$ |
36,883 |
$ |
104,016 |
||||||||||||||||
| – Unsecured |
26,605 |
29,771 |
50,138 |
64,849 |
171,363 |
32,660 |
107,813 |
311,836 |
||||||||||||||||||||||||
As at October 31, 2024 |
||||||||||||||||||||||||||||||||
| (Millions of Canadian dollars) | Less than 1 month |
1 to 3 months |
3 to 6 months |
6 to 12 months |
Less than 1 year sub-total |
1 year to 2 years |
2 years and greater |
Total | ||||||||||||||||||||||||
| Deposits from banks (2) |
$ | 7,248 | $ | 118 | $ | 120 | $ | 1,025 | $ | 8,511 | $ | – | $ | – | $ | 8,511 | ||||||||||||||||
| Certificates of deposit and commercial paper (3) |
8,377 | 10,413 | 16,882 | 37,702 | 73,374 | 139 | – | 73,513 | ||||||||||||||||||||||||
| Asset-backed commercial paper (4) |
4,140 | 3,951 | 7,167 | 2,286 | 17,544 | – | – | 17,544 | ||||||||||||||||||||||||
| Senior unsecured medium-term notes (5) |
5,436 | 7,786 | 7,253 | 12,750 | 33,225 | 20,453 | 57,351 | 111,029 | ||||||||||||||||||||||||
| Senior unsecured structured notes (6), (9) |
1,354 | 1,698 | 3,638 | 3,404 | 10,094 | 4,414 | 13,125 | 27,633 | ||||||||||||||||||||||||
| Mortgage securitization |
41 | 509 | 1,296 | 946 | 2,792 | 2,143 | 11,949 | 16,884 | ||||||||||||||||||||||||
| Covered bonds/asset-backed securities (7) |
– | 2,243 | 1,514 | 7,451 | 11,208 | 19,017 | 36,245 | 66,470 | ||||||||||||||||||||||||
| Subordinated liabilities |
– | – | – | – | – | 2,088 | 11,626 | 13,714 | ||||||||||||||||||||||||
| Other (8), (10) |
– | 116 | 108 | 64 | 288 | 160 | 20,671 | 21,119 | ||||||||||||||||||||||||
| Total |
$ | 26,596 | $ | 26,834 | $ | 37,978 | $ | 65,628 | $ | 157,036 | $ | 48,414 | $ | 150,967 | $ | 356,417 | ||||||||||||||||
| Of which: |
||||||||||||||||||||||||||||||||
| – Secured (10) |
$ | 4,180 | $ | 6,788 | $ | 9,977 | $ | 10,683 | $ | 31,628 | $ | 21,160 | $ | 53,266 | $ | 106,054 | ||||||||||||||||
| – Unsecured (9), (10) |
22,416 | 20,046 | 28,001 | 54,945 | 125,408 | 27,254 | 97,701 | 250,363 | ||||||||||||||||||||||||
(1) |
Excludes repos. |
(2) |
Excludes deposits associated with services we provide to banks (e.g., custody, cash management). |
(3) |
Includes bearer deposit notes (unsecured). |
(4) |
Only includes consolidated liabilities, including our collateralized commercial paper program. |
(5) |
Includes deposit notes and floating rate notes (unsecured). |
(6) |
Includes notes where the payout is tied to movements in foreign exchange, commodities and equities. |
(7) |
Includes covered bonds collateralized with residential mortgages and securities backed by credit card receivables. |
(8) |
Includes tender option bonds (secured) of $4,581 million (October 31, 2024 – $5,157 million), other long-term structured deposits (unsecured) of $18,851 million (October 31, 2024 – $15,770 million), FHLB advances (secured) of $2,804 million (October 31, 2024 – $nil) and wholesale guaranteed interest certificates of $238 million (October 31, 2024 – $192 million). |
(9) |
Effective the first quarter of 2025, we updated the scope of senior unsecured structured notes to better reflect the distribution channel used to issue these notes. Comparative amounts have been revised from those previously presented to conform to this presentation. |
(10) |
Comparative amounts have been revised from those previously presented. |
Credit ratings (1) |
Table 56 |
As at December 2, 2025 |
||||||||||
Short-term debt |
Legacy senior long-term debt (2) |
Senior long-term debt (3) |
Outlook |
|||||||
Moody’s (4) |
P-1 |
Aa1 |
A1 |
stable |
||||||
Standard & Poor’s (5) |
A-1+ |
AA- |
A |
stable |
||||||
Fitch Ratings (6) |
F1+ |
AA |
AA- |
stable |
||||||
DBRS (7) |
R-1 (high) |
AA (high) |
AA |
stable |
||||||
| (1) | Credit ratings are not recommendations to purchase, sell or hold a financial obligation in as much as they do not comment on market price or suitability for a particular investor. Ratings are determined by the rating agencies based on criteria established from time to time by them, and are subject to revision or withdrawal at any time by the rating organization. |
| (2) | Includes senior long-term debt issued prior to September 23, 2018 and senior long-term debt issued on or after September 23, 2018 which is excluded from the Bail-in regime. |
| (3) | Includes senior long-term debt issued on or after September 23, 2018 which is subject to conversion under the Bail-in regime. |
| (4) | On October 9, 2025, Moody’s announced completion of a periodic review of our ratings. There were no changes to our ratings. |
| (5) | On June 25, 2024, Standard & Poor’s affirmed our ratings with a stable outlook. |
| (6) | On June 3, 2025, Fitch Ratings affirmed our ratings with a stable outlook. |
| (7) | On May 9, 2025, DBRS affirmed our ratings with a stable outlook. |
Additional contractual obligations for rating downgrades |
Table 57 |
| As at | ||||||||||||||||||||||||||||
October 31 2025 |
October 31 2024 |
|||||||||||||||||||||||||||
| (Millions of Canadian dollars) | One-notch downgrade |
Two-notch downgrade |
Three-notch downgrade |
One-notch downgrade |
Two-notch downgrade |
Three-notch downgrade |
||||||||||||||||||||||
Contractual derivatives funding or margin requirements |
$ |
275 |
$ |
137 |
$ |
209 |
$ | 232 | $ | 100 | $ | 199 | ||||||||||||||||
Other contractual funding or margin requirements (1) |
41 |
55 |
188 |
41 | 63 | 16 | ||||||||||||||||||||||
| (1) | Includes GICs issued by our municipal markets business out of New York. |
Liquidity coverage ratio common disclosure template (1) |
Table 58 |
| For the three months ended | ||||||||
October 31 2025 |
||||||||
| (Millions of Canadian dollars, except percentage amounts) | Total unweighted value (average) |
Total weighted value (average) |
||||||
High-quality liquid assets |
||||||||
Total high-quality liquid assets (HQLA) |
$ |
458,576 |
||||||
Cash outflows |
||||||||
Retail deposits and deposits from small business customers, of which: |
$ |
414,423 |
$ |
38,905 |
||||
Stable deposits (3) |
135,160 |
4,055 |
||||||
Less stable deposits |
279,263 |
34,850 |
||||||
Unsecured wholesale funding, of which: |
527,534 |
246,338 |
||||||
Operational deposits (all counterparties) and deposits in networks of cooperative banks (4) |
185,037 |
43,435 |
||||||
Non-operational deposits |
317,728 |
178,134 |
||||||
Unsecured debt |
24,769 |
24,769 |
||||||
Secured wholesale funding |
51,152 |
|||||||
Additional requirements, of which: |
445,456 |
94,078 |
||||||
Outflows related to derivative exposures and other collateral requirements |
89,493 |
24,955 |
||||||
Outflows related to loss of funding on debt products |
12,465 |
12,465 |
||||||
Credit and liquidity facilities |
343,498 |
56,658 |
||||||
Other contractual funding obligations (5) |
22,841 |
22,841 |
||||||
Other contingent funding obligations (6) |
918,796 |
15,617 |
||||||
Total cash outflows |
$ |
468,931 |
||||||
Cash inflows |
||||||||
Secured lending (e.g., reverse repos) |
$ |
405,984 |
$ |
72,484 |
||||
Inflows from fully performing exposures |
23,609 |
10,168 |
||||||
Other cash inflows |
24,760 |
24,760 |
||||||
Total cash inflows |
$ |
107,412 |
||||||
Total adjusted value |
||||||||
Total HQLA |
$ |
458,576 |
||||||
Total net cash outflows |
361,519 |
|||||||
Liquidity coverage ratio |
127% |
|||||||
July 31 2025 |
||||||||
| (Millions of Canadian dollars, except percentage amounts) | Total adjusted value |
|||||||
Total HQLA |
$ | 462,083 | ||||||
Total net cash outflows |
358,716 | |||||||
Liquidity coverage ratio |
129% | |||||||
| (1) | The LCR is calculated in accordance with OSFI’s LAR guideline, which, in turn, reflects liquidity-related requirements issued by the BCBS. The LCR for the quarter ended October 31, 2025 is calculated as an average of 63 daily positions. |
| (2) | With the exception of other contingent funding obligations, unweighted inflow and outflow amounts are items maturing or callable in 30 days or less. Other contingent funding obligations also include debt securities with remaining maturity greater than 30 days. |
| (3) | As defined by the BCBS, stable deposits from retail and small business customers are deposits that are insured and are either held in transactional accounts or the bank has an established relationship with the client making the withdrawal unlikely. |
| (4) | Operational deposits from customers other than retail and small and medium-sized enterprises, are deposits which clients need to keep with the bank in order to facilitate their access and ability to use payment and settlement systems primarily for clearing, custody and cash management activities. |
| (5) | Other contractual funding obligations primarily include outflows from unsettled securities trades and outflows from obligations related to securities sold short. |
| (6) | Other contingent funding obligations include outflows related to other off-balance sheet facilities that carry low LCR runoff factors (0% – 5%). |
Net Stable Funding Ratio common disclosure template (1) |
Table 59 |
As at October 31, 2025 |
||||||||||||||||||||
Unweighted value by residual maturity |
Weighted value |
|||||||||||||||||||
| (Millions of Canadian dollars, except percentage amounts) | No maturity |
< 6 months |
6 months to < 1 year |
≥ 1 year |
||||||||||||||||
Available Stable Funding (ASF) Item |
||||||||||||||||||||
Capital: |
$ |
140,356 |
$ |
– |
$ |
– |
$ |
12,006 |
$ |
152,362 |
||||||||||
Regulatory Capital |
140,356 |
– |
– |
12,006 |
152,362 |
|||||||||||||||
Other Capital Instruments |
– |
– |
– |
– |
– |
|||||||||||||||
Retail deposits and deposits from small business customers: |
350,015 |
127,044 |
57,491 |
68,303 |
550,273 |
|||||||||||||||
Stable deposits (3) |
106,148 |
54,260 |
28,305 |
29,640 |
208,918 |
|||||||||||||||
Less stable deposits |
243,867 |
72,784 |
29,186 |
38,663 |
341,355 |
|||||||||||||||
Wholesale funding: |
403,214 |
437,990 |
98,516 |
170,704 |
437,157 |
|||||||||||||||
Operational deposits (4) |
194,308 |
– |
– |
– |
97,154 |
|||||||||||||||
Other wholesale funding |
208,906 |
437,990 |
98,516 |
170,704 |
340,003 |
|||||||||||||||
Liabilities with matching interdependent assets (5) |
– |
1,644 |
2,191 |
21,993 |
– |
|||||||||||||||
Other liabilities: |
61,160 |
306,298 |
22,909 |
|||||||||||||||||
NSFR derivative liabilities |
58,238 |
|||||||||||||||||||
All other liabilities and equity not included in the above categories |
61,160 |
224,884 |
532 |
22,644 |
22,909 |
|||||||||||||||
Total ASF |
$ |
1,162,701 |
||||||||||||||||||
Required Stable Funding (RSF) Item |
||||||||||||||||||||
Total NSFR high-quality liquid assets (HQLA) |
$ |
46,235 |
||||||||||||||||||
Deposits held at other financial institutions for operational purposes |
– |
2,041 |
– |
– |
1,020 |
|||||||||||||||
Performing loans and securities: |
315,100 |
298,690 |
153,486 |
543,646 |
826,048 |
|||||||||||||||
Performing loans to financial institutions secured by Level 1 HQLA |
71 |
89,523 |
19,004 |
13 |
14,739 |
|||||||||||||||
Performing loans to financial institutions secured by non-Level 1 HQLA and unsecured performing loans to financial institutions |
10,158 |
102,048 |
23,946 |
30,734 |
63,748 |
|||||||||||||||
Performing loans to non-financial corporate clients, loans to retail and small business customers, and loans to sovereigns, central banks and PSEs, of which: |
205,779 |
56,029 |
39,956 |
178,150 |
372,669 |
|||||||||||||||
With a risk weight of less than or equal to 35% under the Basel II standardized approach for credit risk |
– |
– |
– |
11,122 |
7,229 |
|||||||||||||||
Performing residential mortgages, of which: |
41,373 |
47,988 |
67,366 |
309,202 |
301,295 |
|||||||||||||||
With a risk weight of less than or equal to 35% under the Basel II standardized approach for credit risk |
36,581 |
47,937 |
67,312 |
302,107 |
291,138 |
|||||||||||||||
Securities that are not in default and do not qualify as HQLA, including exchange-traded equities |
57,719 |
3,102 |
3,214 |
25,547 |
73,597 |
|||||||||||||||
Assets with matching interdependent liabilities (5) |
– |
1,644 |
2,191 |
21,993 |
– |
|||||||||||||||
Other assets: |
9,202 |
446,594 |
124,399 |
|||||||||||||||||
Physical traded commodities, including gold |
9,108 |
7,742 |
||||||||||||||||||
Assets posted as initial margin for derivative contracts and contributions to default funds of CCPs |
31,704 |
26,948 |
||||||||||||||||||
NSFR derivative assets |
58,310 |
72 |
||||||||||||||||||
NSFR derivative liabilities before deduction of variation margin posted |
105,160 |
5,258 |
||||||||||||||||||
All other assets not included in the above categories |
94 |
176,044 |
216 |
75,160 |
84,379 |
|||||||||||||||
Off-balance sheet items |
1,008,453 |
38,292 |
||||||||||||||||||
Total RSF |
$ |
1,035,994 |
||||||||||||||||||
Net Stable Funding Ratio (%) |
112% |
|||||||||||||||||||
| As at July 31, 2025 | ||||||||||||||||||||
| (Millions of Canadian dollars, except percentage amounts) | Weighted value |
|||||||||||||||||||
Total ASF |
$ | 1,135,007 | ||||||||||||||||||
Total RSF |
997,710 | |||||||||||||||||||
Net Stable Funding Ratio (%) |
114% | |||||||||||||||||||
| (1) | The NSFR is calculated in accordance with OSFI’s Liquidity Adequacy Requirements (LAR) guideline, which, in turn, reflects liquidity-related requirements issued by the BCBS. |
| (2) | Totals for the following rows encompass the residual maturity categories of less than 6 months, 6 months to less than 1 year, and greater than or equal to 1 year in accordance with the requirements of the common disclosure template prescribed by OSFI: Other liabilities, NSFR derivative liabilities, Other assets, Assets posted as initial margin for derivative contracts and contributions to default funds of CCPs, NSFR derivative assets, NSFR derivative liabilities before deduction of variation margin posted, and Off-balance sheet items. |
| (3) | As defined by the BCBS, stable deposits from retail and small business customers are deposits that are insured and are either held in transactional accounts or the bank has an established relationship with the client making the withdrawal unlikely. |
| (4) | Operational deposits from customers other than retail and small and medium-sized enterprises, are deposits which clients need to keep with the bank in order to facilitate their access and ability to use payment and settlement systems primarily for clearing, custody and cash management activities. |
| (5) | Interdependent assets and liabilities represent National Housing Act Mortgage-Backed Securities (NHA MBS) liabilities, including liabilities arising from transactions involving the Canada Mortgage Bond program and their corresponding encumbered mortgages. |
Contractual maturities of financial assets, financial liabilities and off-balance sheet items |
Table 60 |
As at October 31, 2025 |
||||||||||||||||||||||||||||||||||||||||
| (Millions of Canadian dollars) | Less than 1 month |
1 to 3 months |
3 to 6 months |
6 to 9 months |
9 to 12 months |
1 year to 2 years |
2 years to 5 years |
5 years and greater |
With no specific maturity |
Total |
||||||||||||||||||||||||||||||
Assets |
||||||||||||||||||||||||||||||||||||||||
Cash and deposits with banks |
$ |
84,814 |
$ |
17 |
$ |
– |
$ |
– |
$ |
6 |
$ |
– |
$ |
– |
$ |
– |
$ |
2,551 |
$ |
87,388 |
||||||||||||||||||||
Securities |
||||||||||||||||||||||||||||||||||||||||
Trading (1) |
100,479 |
905 |
1,362 |
1,395 |
849 |
220 |
455 |
14,329 |
99,073 |
219,067 |
||||||||||||||||||||||||||||||
Investment, net of applicable allowance |
4,740 |
8,258 |
17,570 |
12,021 |
20,806 |
82,377 |
85,610 |
109,883 |
1,456 |
342,721 |
||||||||||||||||||||||||||||||
Assets purchased under reverse repurchase agreements and securities borrowed (2) |
138,208 |
57,226 |
45,999 |
20,873 |
22,499 |
51 |
– |
– |
24,827 |
309,683 |
||||||||||||||||||||||||||||||
Loans, net of applicable allowance |
22,203 |
34,947 |
49,746 |
66,956 |
55,741 |
297,199 |
302,691 |
83,739 |
129,200 |
1,042,422 |
||||||||||||||||||||||||||||||
Other |
||||||||||||||||||||||||||||||||||||||||
Derivatives |
13,116 |
26,962 |
15,562 |
10,433 |
7,553 |
19,937 |
36,149 |
47,494 |
– |
177,206 |
||||||||||||||||||||||||||||||
Other financial assets |
52,621 |
5,568 |
2,636 |
769 |
766 |
452 |
148 |
4,582 |
5,327 |
72,869 |
||||||||||||||||||||||||||||||
Total financial assets |
416,181 |
133,883 |
132,875 |
112,447 |
108,220 |
400,236 |
425,053 |
260,027 |
262,434 |
2,251,356 |
||||||||||||||||||||||||||||||
Other non-financial assets |
4,137 |
2,055 |
2,568 |
364 |
1,436 |
2,661 |
4,479 |
6,413 |
49,537 |
73,650 |
||||||||||||||||||||||||||||||
Total assets |
$ |
420,318 |
$ |
135,938 |
$ |
135,443 |
$ |
112,811 |
$ |
109,656 |
$ |
402,897 |
$ |
429,532 |
$ |
266,440 |
$ |
311,971 |
$ |
2,325,006 |
||||||||||||||||||||
Liabilities and equity |
||||||||||||||||||||||||||||||||||||||||
Deposits (3) |
||||||||||||||||||||||||||||||||||||||||
Unsecured borrowing |
$ |
106,190 |
$ |
80,883 |
$ |
105,974 |
$ |
83,764 |
$ |
71,428 |
$ |
61,413 |
$ |
91,338 |
$ |
54,701 |
$ |
750,271 |
$ |
1,405,962 |
||||||||||||||||||||
Secured borrowing |
5,217 |
7,526 |
9,546 |
2,938 |
2,949 |
6,814 |
12,108 |
9,099 |
– |
56,197 |
||||||||||||||||||||||||||||||
Covered bonds |
– |
3,259 |
3,214 |
5,088 |
6,416 |
19,323 |
11,929 |
4,228 |
– |
53,457 |
||||||||||||||||||||||||||||||
Other |
||||||||||||||||||||||||||||||||||||||||
Obligations related to securities sold short |
43,223 |
1,234 |
834 |
2,593 |
1,357 |
650 |
– |
– |
– |
49,891 |
||||||||||||||||||||||||||||||
Obligations related to assets sold under repurchase agreements and securities loaned (2) |
166,329 |
71,225 |
16,610 |
6,446 |
4,214 |
1,672 |
– |
– |
23,020 |
289,516 |
||||||||||||||||||||||||||||||
Derivatives |
13,292 |
28,955 |
17,532 |
11,248 |
8,664 |
20,821 |
36,809 |
46,632 |
– |
183,953 |
||||||||||||||||||||||||||||||
Other financial liabilities |
46,292 |
3,296 |
5,329 |
1,406 |
1,449 |
929 |
2,105 |
21,337 |
2,418 |
84,561 |
||||||||||||||||||||||||||||||
Subordinated debentures |
– |
2,091 |
– |
– |
– |
– |
– |
11,870 |
– |
13,961 |
||||||||||||||||||||||||||||||
Total financial liabilities |
380,543 |
198,469 |
159,039 |
113,483 |
96,477 |
111,622 |
154,289 |
147,867 |
775,709 |
2,137,498 |
||||||||||||||||||||||||||||||
Other non-financial liabilities |
1,426 |
6,513 |
435 |
239 |
223 |
2,261 |
1,860 |
23,506 |
11,894 |
48,357 |
||||||||||||||||||||||||||||||
Equity |
– |
– |
– |
– |
– |
– |
– |
– |
139,151 |
139,151 |
||||||||||||||||||||||||||||||
Total liabilities and equity |
$ |
381,969 |
$ |
204,982 |
$ |
159,474 |
$ |
113,722 |
$ |
96,700 |
$ |
113,883 |
$ |
156,149 |
$ |
171,373 |
$ |
926,754 |
$ |
2,325,006 |
||||||||||||||||||||
Off-balance sheet items |
||||||||||||||||||||||||||||||||||||||||
Financial guarantees |
$ |
1,125 |
$ |
2,829 |
$ |
4,578 |
$ |
4,545 |
$ |
4,543 |
$ |
2,562 |
$ |
6,055 |
$ |
2,662 |
$ |
29 |
$ |
28,928 |
||||||||||||||||||||
Commitments to extend credit |
5,744 |
10,299 |
17,664 |
18,365 |
22,554 |
70,723 |
239,678 |
30,846 |
4,050 |
419,923 |
||||||||||||||||||||||||||||||
Other credit-related commitments |
82,651 |
1,751 |
2,287 |
3,360 |
2,673 |
880 |
715 |
125 |
86,828 |
181,270 |
||||||||||||||||||||||||||||||
Other commitments |
6 |
10 |
17 |
17 |
18 |
63 |
162 |
213 |
687 |
1,193 |
||||||||||||||||||||||||||||||
Total off-balance sheet items |
$ |
89,526 |
$ |
14,889 |
$ |
24,546 |
$ |
26,287 |
$ |
29,788 |
$ |
74,228 |
$ |
246,610 |
$ |
33,846 |
$ |
91,594 |
$ |
631,314 |
||||||||||||||||||||
| (1) | With the exception of debt securities within the Insurance segment, trading debt securities classified as FVTPL have been included in the less than 1 month category as there is no expectation to hold these assets to their contractual maturity. |
| (2) | Open reverse repo and repo contracts, which have no set maturity date and are typically short-term, have been included in the with no specific maturity category. |
| (3) | A major portion of relationship-based deposits are repayable on demand or at short notice on a contractual basis while, in practice, these customer balances form a core base for our operations and liquidity needs, as explained in the preceding Deposit and funding profile section. |
| As at October 31, 2024 | ||||||||||||||||||||||||||||||||||||||||
| (Millions of Canadian dollars) | Less than 1 month |
1 to 3 months |
3 to 6 months |
6 to 9 months |
9 to 12 months |
1 year to 2 years |
2 years to 5 years |
5 years and greater |
With no specific maturity |
Total | ||||||||||||||||||||||||||||||
Assets |
||||||||||||||||||||||||||||||||||||||||
Cash and deposits with banks |
$ | 120,584 | $ | 6 | $ | – | $ | – | $ | – | $ | – | $ | – | $ | – | $ | 2,153 | $ | 122,743 | ||||||||||||||||||||
Securities |
||||||||||||||||||||||||||||||||||||||||
Trading (1) |
80,203 | 148 | 380 | 22 | 34 | 229 | 707 | 11,903 | 89,674 | 183,300 | ||||||||||||||||||||||||||||||
Investment, net of applicable allowance |
5,974 | 7,588 | 6,782 | 12,445 | 9,746 | 51,674 | 67,730 | 93,451 | 1,228 | 256,618 | ||||||||||||||||||||||||||||||
Assets purchased under reverse repurchase agreements and securities borrowed (2) |
170,052 | 65,837 | 57,921 | 15,720 | 20,727 | 181 | – | – | 20,365 | 350,803 | ||||||||||||||||||||||||||||||
Loans, net of applicable allowance (3) |
24,706 | 32,131 | 45,916 | 52,362 | 50,303 | 287,726 | 288,213 | 79,641 | 120,382 | 981,380 | ||||||||||||||||||||||||||||||
Other |
||||||||||||||||||||||||||||||||||||||||
Derivatives |
13,657 | 19,365 | 9,293 | 6,548 | 5,797 | 17,376 | 31,389 | 47,187 | – | 150,612 | ||||||||||||||||||||||||||||||
Other financial assets |
42,601 | 4,575 | 2,168 | 423 | 671 | 175 | 743 | 1,829 | 4,229 | 57,414 | ||||||||||||||||||||||||||||||
Total financial assets |
457,777 | 129,650 | 122,460 | 87,520 | 87,278 | 357,361 | 388,782 | 234,011 | 238,031 | 2,102,870 | ||||||||||||||||||||||||||||||
Other non-financial assets |
11,393 | 2,158 | 1,450 | 259 | 233 | 1,941 | 3,122 | 9,501 | 38,655 | 68,712 | ||||||||||||||||||||||||||||||
Total assets |
$ | 469,170 | $ | 131,808 | $ | 123,910 | $ | 87,779 | $ | 87,511 | $ | 359,302 | $ | 391,904 | $ | 243,512 | $ | 276,686 | $ | 2,171,582 | ||||||||||||||||||||
Liabilities and equity |
||||||||||||||||||||||||||||||||||||||||
Deposits (4) |
||||||||||||||||||||||||||||||||||||||||
Unsecured borrowing |
$ | 122,083 | $ | 72,933 | $ | 83,574 | $ | 84,252 | $ | 77,207 | $ | 55,196 | $ | 85,458 | $ | 44,264 | $ | 668,975 | $ | 1,293,942 | ||||||||||||||||||||
Secured borrowing |
4,437 | 6,000 | 9,513 | 3,939 | 1,956 | 7,447 | 14,969 | 9,050 | – | 57,311 | ||||||||||||||||||||||||||||||
Covered bonds |
– | 2,245 | 1,498 | 4,019 | 2,230 | 17,134 | 27,207 | 3,945 | – | 58,278 | ||||||||||||||||||||||||||||||
Other |
||||||||||||||||||||||||||||||||||||||||
Obligations related to securities sold short |
35,286 | – | – | – | – | – | – | – | – | 35,286 | ||||||||||||||||||||||||||||||
Obligations related to assets sold under repurchase agreements and securities loaned (2) |
221,377 | 38,828 | 14,726 | 7,586 | 2 | 466 | – | – | 22,336 | 305,321 | ||||||||||||||||||||||||||||||
Derivatives |
13,153 | 23,372 | 12,176 | 11,160 | 8,025 | 18,305 | 32,865 | 44,707 | – | 163,763 | ||||||||||||||||||||||||||||||
Other financial liabilities |
40,944 | 3,334 | 2,917 | 2,060 | 2,024 | 1,073 | 2,404 | 16,788 | 1,293 | 72,837 | ||||||||||||||||||||||||||||||
Subordinated debentures |
– | – | – | – | – | 2,025 | – | 11,521 | – | 13,546 | ||||||||||||||||||||||||||||||
Total financial liabilities |
437,280 | 146,712 | 124,404 | 113,016 | 91,444 | 101,646 | 162,903 | 130,275 | 692,604 | 2,000,284 | ||||||||||||||||||||||||||||||
Other non-financial liabilities |
1,501 | 5,769 | 452 | 231 | 198 | 1,664 | 1,821 | 21,425 | 11,045 | 44,106 | ||||||||||||||||||||||||||||||
Equity |
– | – | – | – | – | – | – | – | 127,192 | 127,192 | ||||||||||||||||||||||||||||||
Total liabilities and equity |
$ | 438,781 | $ | 152,481 | $ | 124,856 | $ | 113,247 | $ | 91,642 | $ | 103,310 | $ | 164,724 | $ | 151,700 | $ | 830,841 | $ | 2,171,582 | ||||||||||||||||||||
Off-balance sheet items |
||||||||||||||||||||||||||||||||||||||||
Financial guarantees |
$ | 917 | $ | 2,929 | $ | 4,485 | $ | 3,818 | $ | 4,368 | $ | 1,563 | $ | 7,140 | $ | 1,977 | $ | 25 | $ | 27,222 | ||||||||||||||||||||
Commitments to extend credit |
7,317 | 9,060 | 15,891 | 17,305 | 20,109 | 63,200 | 217,555 | 25,580 | 2,950 | 378,967 | ||||||||||||||||||||||||||||||
Other credit-related commitments |
51,645 | 1,600 | 2,360 | 2,927 | 2,534 | 460 | 1,299 | 113 | 81,379 | 144,317 | ||||||||||||||||||||||||||||||
Other commitments |
7 | 12 | 19 | 20 | 19 | 70 | 179 | 260 | 926 | 1,512 | ||||||||||||||||||||||||||||||
Total off-balance sheet items |
$ | 59,886 | $ | 13,601 | $ | 22,755 | $ | 24,070 | $ | 27,030 | $ | 65,293 | $ | 226,173 | $ | 27,930 | $ | 85,280 | $ | 552,018 | ||||||||||||||||||||
| (1) | With the exception of debt securities within the Insurance segment, trading debt securities classified as FVTPL have been included in the less than 1 month category as there is no expectation to hold these assets to their contractual maturity. |
| (2) | Open reverse repo and repo contracts, which have no set maturity date and are typically short-term, have been included in the with no specific maturity category. |
| (3) | Comparative amounts have been revised from those previously presented. |
| (4) | A major portion of relationship-based deposits are repayable on demand or at short notice on a contractual basis while, in practice, these customer balances form a core base for our operations and liquidity needs, as explained in the preceding Deposit and funding profile section. |
| Contractual maturities of financial liabilities and off-balance sheet items – undiscounted basis* |
Table 61 |
As at October 31, 2025 |
||||||||||||||||||||||||
| (Millions of Canadian dollars) | On demand |
Within 1 year |
1 year to 2 years |
2 years to 5 years |
5 years and greater |
Total |
||||||||||||||||||
| Financial liabilities |
||||||||||||||||||||||||
| Deposits (1) |
$ |
673,197 |
$ |
572,391 |
$ |
87,107 |
$ |
114,183 |
$ |
72,916 |
$ |
1,519,794 |
||||||||||||
| Other |
||||||||||||||||||||||||
| Obligations related to securities sold short |
– |
49,241 |
650 |
– |
– |
49,891 |
||||||||||||||||||
| Obligations related to assets sold under repurchase agreements and securities loaned |
23,020 |
264,838 |
1,672 |
– |
– |
289,530 |
||||||||||||||||||
| Other liabilities |
1,842 |
57,701 |
1,010 |
2,503 |
21,082 |
84,138 |
||||||||||||||||||
| Lease liabilities |
– |
694 |
799 |
1,947 |
1,877 |
5,317 |
||||||||||||||||||
| Subordinated debentures |
– |
2,091 |
– |
– |
11,880 |
13,971 |
||||||||||||||||||
698,059 |
946,956 |
91,238 |
118,633 |
107,755 |
1,962,641 |
|||||||||||||||||||
| Off-balance sheet items |
||||||||||||||||||||||||
| Financial guarantees (2) |
$ |
26,806 |
$ |
1,772 |
$ |
240 |
$ |
110 |
$ |
– |
$ |
28,928 |
||||||||||||
| Other commitments (3) |
– |
68 |
63 |
162 |
213 |
506 |
||||||||||||||||||
| Commitments to extend credit (2) |
4,206 |
134,908 |
61,746 |
207,249 |
11,814 |
419,923 |
||||||||||||||||||
31,012 |
136,748 |
62,049 |
207,521 |
12,027 |
449,357 |
|||||||||||||||||||
| Total financial liabilities and off-balance sheet items |
$ |
729,071 |
$ |
1,083,704 |
$ |
153,287 |
$ |
326,154 |
$ |
119,782 |
$ |
2,411,998 |
||||||||||||
As at October 31, 2024 |
||||||||||||||||||||||||
| (Millions of Canadian dollars) | On demand |
Within 1 year |
1 year to 2 years |
2 years to 5 years |
5 years and greater |
Total | ||||||||||||||||||
| Financial liabilities |
||||||||||||||||||||||||
| Deposits (1) |
$ | 585,524 | $ | 560,583 | $ | 79,909 | $ | 127,421 | $ | 58,193 | $ | 1,411,630 | ||||||||||||
| Other |
||||||||||||||||||||||||
| Obligations related to securities sold short |
– | 35,326 | – | – | – | 35,326 | ||||||||||||||||||
| Obligations related to assets sold under repurchase agreements and securities loaned |
22,336 | 282,478 | 466 | – | – | 305,280 | ||||||||||||||||||
| Other liabilities |
563 | 51,216 | 382 | 742 | 15,011 | 67,914 | ||||||||||||||||||
| Lease liabilities |
– | 709 | 631 | 1,566 | 1,767 | 4,673 | ||||||||||||||||||
| Subordinated debentures |
– | – | 2,026 | – | 11,530 | 13,556 | ||||||||||||||||||
| 608,423 | 930,312 | 83,414 | 129,729 | 86,501 | 1,838,379 | |||||||||||||||||||
| Off-balance sheet items |
||||||||||||||||||||||||
| Financial guarantees (2) |
$ | 25,553 | $ | 1,485 | $ | 10 | $ | 174 | $ | – | $ | 27,222 | ||||||||||||
| Other commitments (3) |
– | 77 | 70 | 179 | 260 | 586 | ||||||||||||||||||
| Commitments to extend credit (2) |
3,081 | 121,652 | 54,443 | 190,073 | 9,718 | 378,967 | ||||||||||||||||||
| 28,634 | 123,214 | 54,523 | 190,426 | 9,978 | 406,775 | |||||||||||||||||||
| Total financial liabilities and off-balance sheet items |
$ | 637,057 | $ | 1,053,526 | $ | 137,937 | $ | 320,155 | $ | 96,479 | $ | 2,245,154 | ||||||||||||
| * | This table represents an integral part of our 2025 Annual Consolidated Financial Statements. |
| (1) | A major portion of relationship-based deposits are repayable on demand or at short notice on a contractual basis while, in practice, these customer balances form a core base for our operations and liquidity needs, as explained in the preceding Deposit and funding profile. |
| (2) | We believe that it is highly unlikely that all or substantially all of these guarantees and commitments will be drawn or settled within one year, and contracts may expire without being drawn or settled. The management of the liquidity risk associated with potential extensions of funds is outlined in the preceding Risk measurement and internal liquidity reporting section. |
| (3) | Includes commitments related to short-term and low-dollar value leases, leases not yet commenced, and lease payments related to non-recoverable tax. |
| Insurance risk |
| Operational risk |
| • | Risk identification and assessment tools, including the collection and analysis of risk event data, help risk owners understand and proactively manage operational risk exposures. Risk assessments are intended to ensure alignment between risk exposures and efforts to manage them. Management uses outputs of these tools to make informed risk decisions. |
| • | Risk monitoring tools alert management to changes in the operational risk profile. When paired with escalation and monitoring triggers, risk monitoring tools can identify risk trends, warn management of risk levels that approach or exceed defined limits, as well as prompt actions and mitigation plans to be undertaken. |
| • | Risk capital measurement is designed to provide credible estimation of potential risk exposure, including surfacing risk vulnerabilities, and informs strategic and capital planning decisions, which are ultimately intended to ensure that the bank is sufficiently resilient to withstand operational risk losses both in normal times and under stress situations. |
| • | Risk reporting and communication processes seek to ensure that relevant operational risk information is made available to management in a timely manner to support risk-informed business decisions. |
Operational risk |
Management strategy | |
Information technology and cybersecurity risk |
Information technology risk is the risk associated with the use, ownership, operation and adoption of information systems that can result in business interruptions, client service disruptions and loss of confidential information causing financial loss, reputational damage and regulatory fines and penalties. We maintain a risk driven program to address the risks following our operational risk framework supported by a global team of technology risk management experts. Cybersecurity risk is the risk to the business associated with cyberattacks initiated to disrupt or disable our operations or to expose or damage data. We have a dedicated team of technology and cybersecurity professionals that manage a comprehensive program that seeks to protect the organization against breaches and other incidents by ensuring appropriate security and operational controls are in place. We continue to strengthen our cyber-control framework and to improve our resilience and cybersecurity capabilities including through 24-hour monitoring, cyber intelligence analysis of internal and external threats and alerting of potentially suspicious security events and incidents. Throughout the year, we continued to invest in our cybersecurity program. In addition, scenario-based testing, assessments and simulations were conducted to test our resiliency strategy. | |
Information management and privacy risk  |
Information management risk is the risk of failing to manage information appropriately through its lifecycle due to inadequate processes, controls and technology resulting in legal and regulatory consequences, reputational damage and/or financial loss. We continue to invest in the Enterprise Chief Data Office (CDO) and functional and regional data management and data governance units to promote awareness of and effectively manage information management risk. Managing information management risk is fundamental to become a data-driven organization that uses data effectively and efficiently to improve client experience and decision-making. Privacy risk is defined as the risk of improper creation or collection, use, disclosure, retention or destruction of PI, including the failure to safeguard PI against unauthorized access. PI is information entrusted to RBC that identifies an individual or can be reasonably used to identity an individual. PI can relate to current, former and prospective clients, employees and contractors. The collection, use and sharing of data, as well as the management and governance of data, are increasingly important as we continue to invest in digital solutions and innovation, as well as expanding our business activities, which is also reflected through regulatory developments relating to data privacy. GRM partners with cross-functional teams to develop and implement enterprise-wide standards and practices that describe how data is obtained, used, protected, managed and governed. | |
Financial crimes risk  |
Financial crimes risk is the risk that our products, services and delivery channels are misused to facilitate the laundering of proceeds of crime, financing of terrorist activity, bribery, corruption and other activities that may violate applicable economic sanctions. We maintain an enterprise-wide program designed to deter, detect and report suspected money laundering and terrorist financing or suspicious activities across our organization, while seeking to ensure compliance with the laws and regulations of the various jurisdictions in which we operate. Our Enterprise Financial Crimes program is dedicated to the continuous development and maintenance of robust policies, guidelines, training, risk-assessment tools and models to enable our employees to manage evolving money laundering and terrorist financing risks, economic sanctions and regulatory expectations. The Enterprise Financial Crimes program is regularly evaluated in an effort to ensure it remains current and aligned with industry standards, best practices and all applicable laws, regulations and guidance. Risks of non-compliance can include enforcement actions (which may involve substantial fines or limitations on our business activities), criminal prosecutions and reputational damage. | |
Third-party risk  |
Third-party risk is a risk that arises if and when there is a failure to effectively manage third parties which may expose us to service disruptions, regulatory action, financial loss, litigation or reputational damage. We have a risk-based, enterprise-wide program designed to provide oversight for third-party relationships, ensure compliance with global regulatory expectations and enable effective responses to events that can cause service disruptions, financial loss or various other risks that could impact us. Our approach to third-party risk mitigation is outlined in policies and standards that establish the requirements for identifying and managing risks throughout the engagement with a third-party (including risks resultant from supplier concentration and through fourth parties across the supply chain). Third-party providers critical to our operations are actively monitored for their ability to deliver services to us, including impacts resultant from suppliers of our third-party providers (i.e., fourth parties). | |
Business continuity risk  |
Business continuity risk is the risk of being unable to maintain, continue or restore essential business operations during and/or after an event that prevents us from conducting business in the normal course. Exposure to disruptive operational events interrupts the continuity of our business operations and could negatively impact our financial results, reputation, client outcomes and/or result in harm to our employees. These operational events could result from the impact of severe weather, outbreak of a pandemic or other health crisis, failed processes, technology failures or cyber threats. Our risk-based enterprise-wide business continuity management program considers multiple scenarios to address the consequences of a disruption and its effects on the availability of our people, processes, facilities, technology and third-party arrangements. Our approach to, and requirements for, business continuity management are outlined in policies and standards embedded across the organization and the related risks are regularly measured, monitored, reported and integrated into our operational risk management and control framework. | |
Operational risk |
Management strategy | |
Fraud risk  |
Fraud risk is the risk of intentional unauthorized activities designed to obtain benefits from RBC or assets under our care, or from using RBC products. Fraud may be perpetrated by external parties (external fraud) or by individuals inside the organization (internal fraud). It typically results in financial loss, reputational damage or other harm to victims and involves intent to deceive for improper or illegal gain. Examples include theft of cash or assets and unauthorized transactions. To manage fraud risk effectively, we employ a comprehensive, multi-layered approach that includes prevention, detection and response strategies. This approach is supported by policies and procedures that clearly outline the responsibilities and expectations for all employees. Additionally, we implement robust technical controls, such as advanced fraud detection software, and internal business controls, including regular audits and compliance checks. These measures are designed to work together to provide a strong defense against fraud, to protect both the organization and our clients. | |
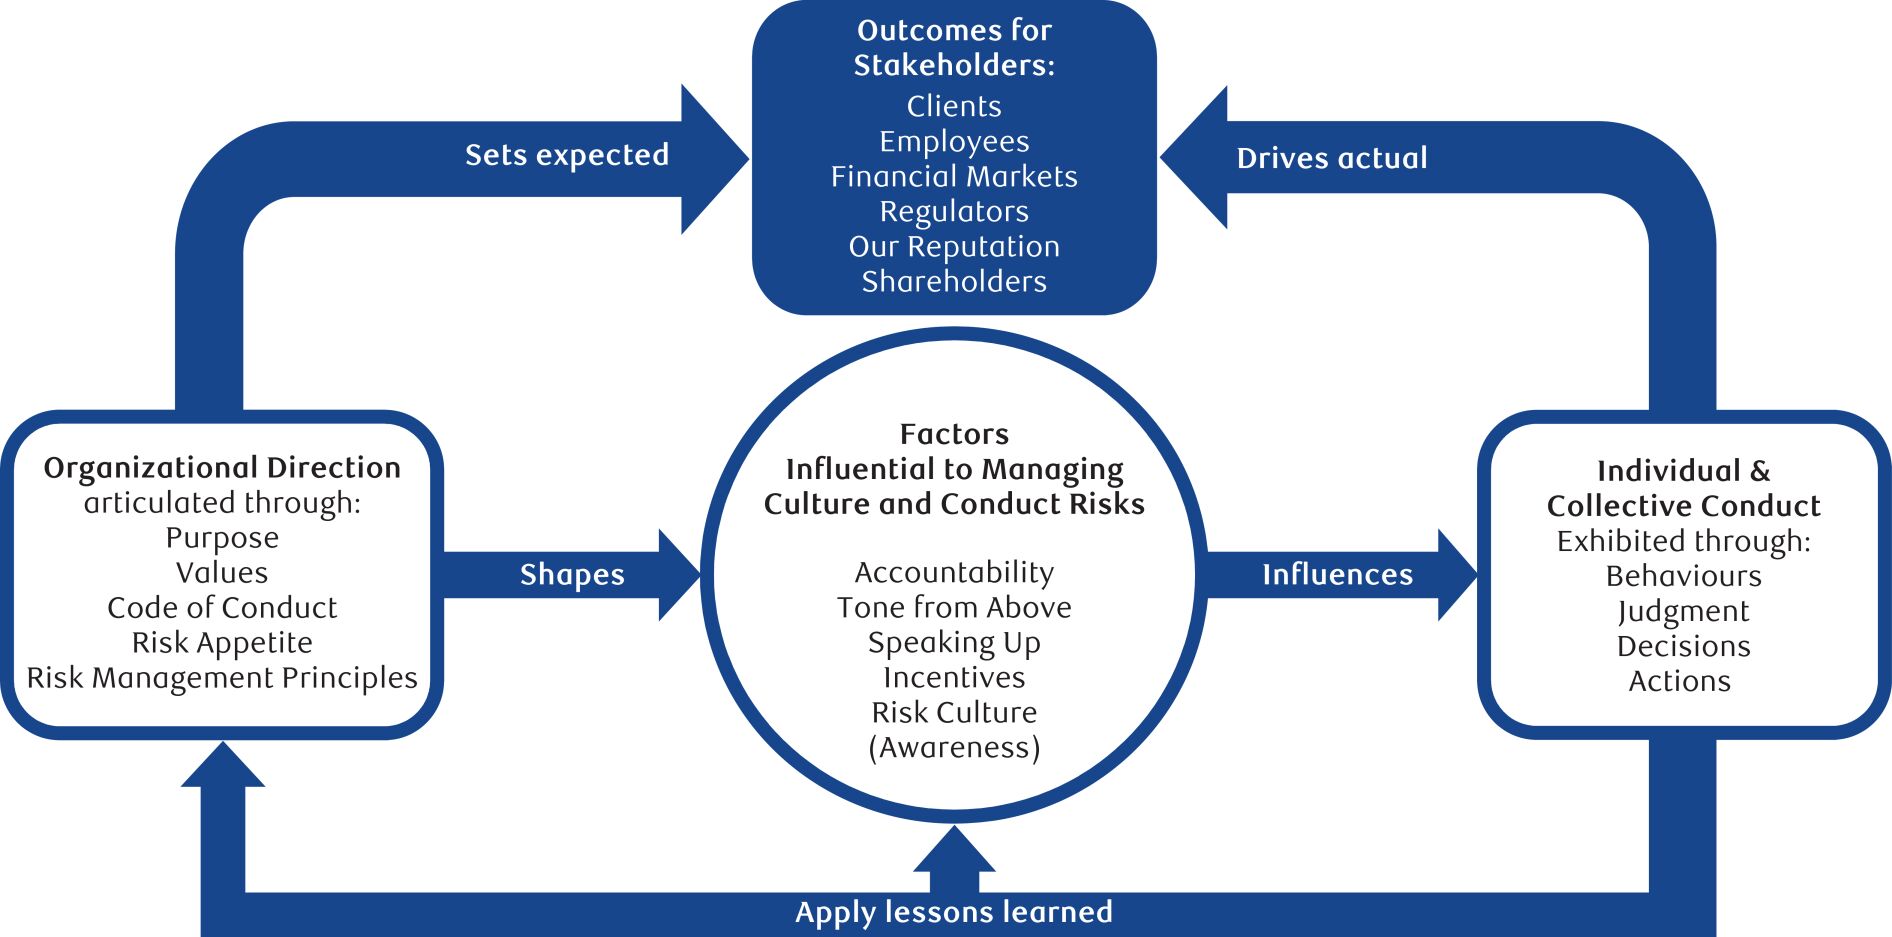
Compliance risk |
Reputation risk |
Strategic risk |
Overview of other risks |
Legal and regulatory environment risk |
| • | Failure to reach trade agreements and reliance on ad-hoc bilateral deals, which could lead to a shift away from global economic integration, negatively impact productivity and further hurt growth prospects, especially for emerging markets and developing economies; |
| • | Substantive projected fiscal deficits across major economies, which could lead to upward pressure on long-term interest rates, financial market instability and/or deceleration in growth, along with their associated impact on consumer and business confidence; |
| • | Diverging monetary policies in response to inflationary pressures, which could drive asset repricing, impact foreign exchange rates and capital flows and heighten financial market volatility; |
| • | Shifting global policy priorities, including ongoing uncertainty around U.S. trade, foreign relations, defense and immigration policies, which could disrupt global alliances and heighten economic, market and other risks, and intensifying political pressures on policy institutions and policymaking, which could weaken policy credibility, reduce investor confidence and heighten macroeconomic vulnerabilities; |
| • | Elevated asset valuations, including in technology and AI-linked sectors which could drive abrupt market corrections, dampen investment, tighten financial conditions and weaken business and consumer confidence; |
| • | An aging demographic in advanced economies, as well as changing immigration policies, which could have an associated long-term impact on labour supply, economic productivity and government fiscal capacity; |
| • | Ongoing conflicts including those between Russia and Ukraine, in the Middle East and Asia, and rising tensions between China and Taiwan, together with increased polarization and social unrest; and |
| • | Extreme weather-related events. |
Government fiscal, monetary and other policies |
Tax risk and transparency |
| • | Act with integrity and in a straightforward, open and honest manner in all tax matters; |
| • | Ensure tax strategy is aligned with our business strategy supporting only bona fide transactions with a business purpose and economic substance; |
| • | Ensure all intercompany transactions are conducted in accordance with applicable transfer pricing requirements; |
| • | Ensure our full compliance and full disclosure to tax authorities of our statutory obligations; and |
| • | Endeavour to work with the tax authorities to build positive long-term relationships and where disputes occur, address them constructively. |
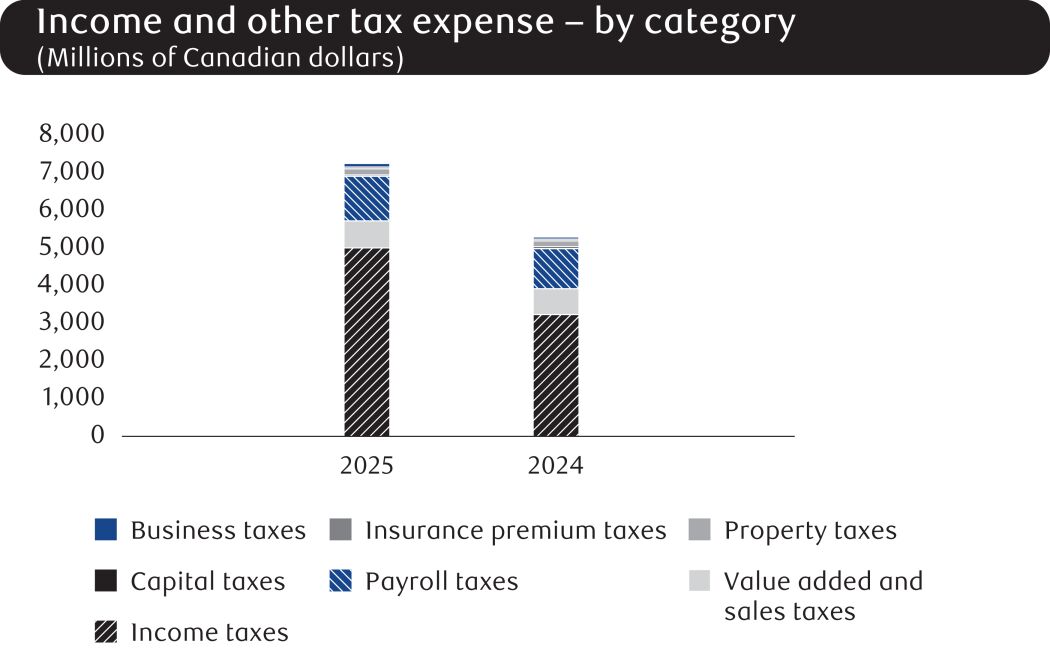 |
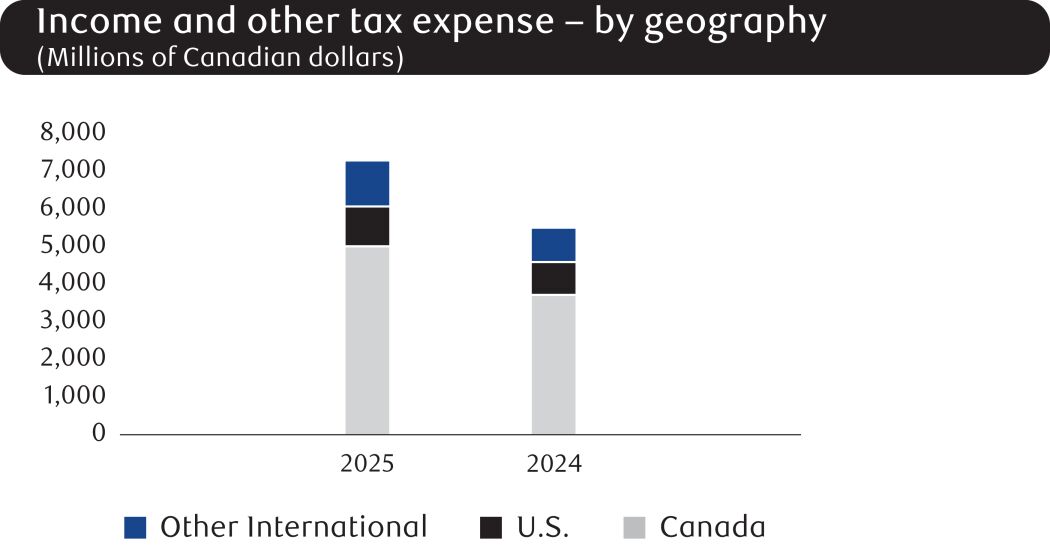 |
Environmental and social risk |
1 |
The E&S Risk Policy is not inclusive of the activities of, and assets under management by, RBC Global Asset Management ® (RBC GAM). RBC GAM has developed its own policy with respect to these matters. RBC GAM includes, but is not limited to, the following wholly owned indirect subsidiaries of the Bank: RBC Global Asset Management Inc. (including Phillips, Hager & North Investment Management), RBC Global Asset Management (U.S.) Inc., RBC Global Asset Management (UK) Limited, RBC Global Asset Management (Asia) Limited. |
Capital management |
2 |
For example, external factors that could cause our actual results to differ materially from such expectations include the availability, reliability, quality and verifiability of climate data; the adoption of new and the evolution of existing climate-related standards, protocols and methodologies; the failure of clients, customers or other third parties to implement or complete their transactions or their climate-related projects, programs and initiatives, or to do so when expected; the compliance of various third parties with our policies and procedures and their commitment to us; the actions, policies and engagement of various stakeholders; technological advancements; the evolution of markets and consumer behaviour, including the evolution and liquidity of the carbon markets; the status of adoption and implementation of decarbonization efforts and climate policies around the world; the challenges of balancing emission reduction targets with an orderly, just and inclusive transition; geopolitical factors that impact global energy needs; the legal and regulatory environment; and compliance considerations. |
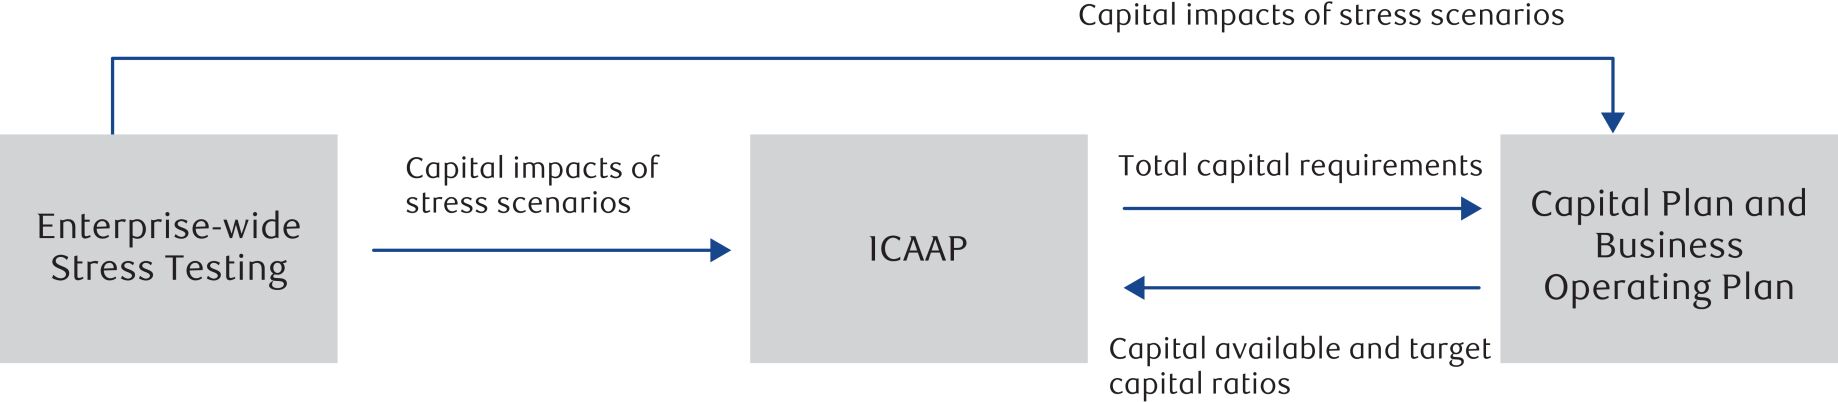
Basel III – OSFI regulatory targets |
Table 62 |
Basel III capital, leverage and TLAC ratios |
OSFI regulatory target requirements for large banks under Basel III |
Domestic Stability Buffer (3) |
Minimum including Capital Buffers, D-SIB/G-SIB surcharge and Domestic Stability Buffer as at October 31, 2025 (4) |
RBC capital, leverage and TLAC ratios as at October 31, 2025 |
||||||||||||||||||||||||||||
Minimum |
Capital Buffers |
Minimum including Capital Buffers |
D-SIB/G-SIB surcharge (1) |
Minimum including Capital Buffers and D-SIB/G-SIB surcharge (1), (2) |
||||||||||||||||||||||||||||
Common Equity Tier 1 |
4.5% | 2.6% | 7.1% | 1.0% | 8.1% | 3.5% | 11.6% | 13.5% | ||||||||||||||||||||||||
Tier 1 capital |
6.0% | 2.6% | 8.6% | 1.0% | 9.6% | 3.5% | 13.1% | 15.1% | ||||||||||||||||||||||||
Total capital |
8.0% | 2.6% | 10.6% | 1.0% | 11.6% | 3.5% | 15.1% | 16.8% | ||||||||||||||||||||||||
Leverage ratio |
3.0% | n.a. | 3.0% | 0.5% | 3.5% | n.a. | 3.5% | 4.4% | ||||||||||||||||||||||||
TLAC ratio |
21.6% | n.a. | 21.6% | n.a. | 21.6% | 3.5% | 25.1% | 31.5% | ||||||||||||||||||||||||
TLAC leverage ratio |
7.25% | n.a. | 7.25% | n.a. | 7.25% | n.a. | 7.25% | 9.2% | ||||||||||||||||||||||||
| (1) | A capital surcharge, equal to the higher of our D-SIB surcharge and the BCBS’s G-SIB surcharge, is applicable to risk-weighted capital. For leverage ratio, only 50% of our D-SIB surcharge for capital is the required surcharge. |
| (2) | The capital buffers include the capital conservation buffer of 2.5% and the countercyclical capital buffer (CCyB) as prescribed by OSFI. The CCyB, calculated in accordance with OSFI’s CAR guidelines, was 0.06% as at October 31, 2025 (October 31, 2024 – 0.08%). |
| (3) | The DSB can range from 0% to 4% of total RWA and is currently set at 3.5%. |
| (4) | Minimum target requirements reflect CCyB requirements as at October 31, 2025 which are subject to change based on exposures held at the reporting date. |
| n.a. | not applicable |
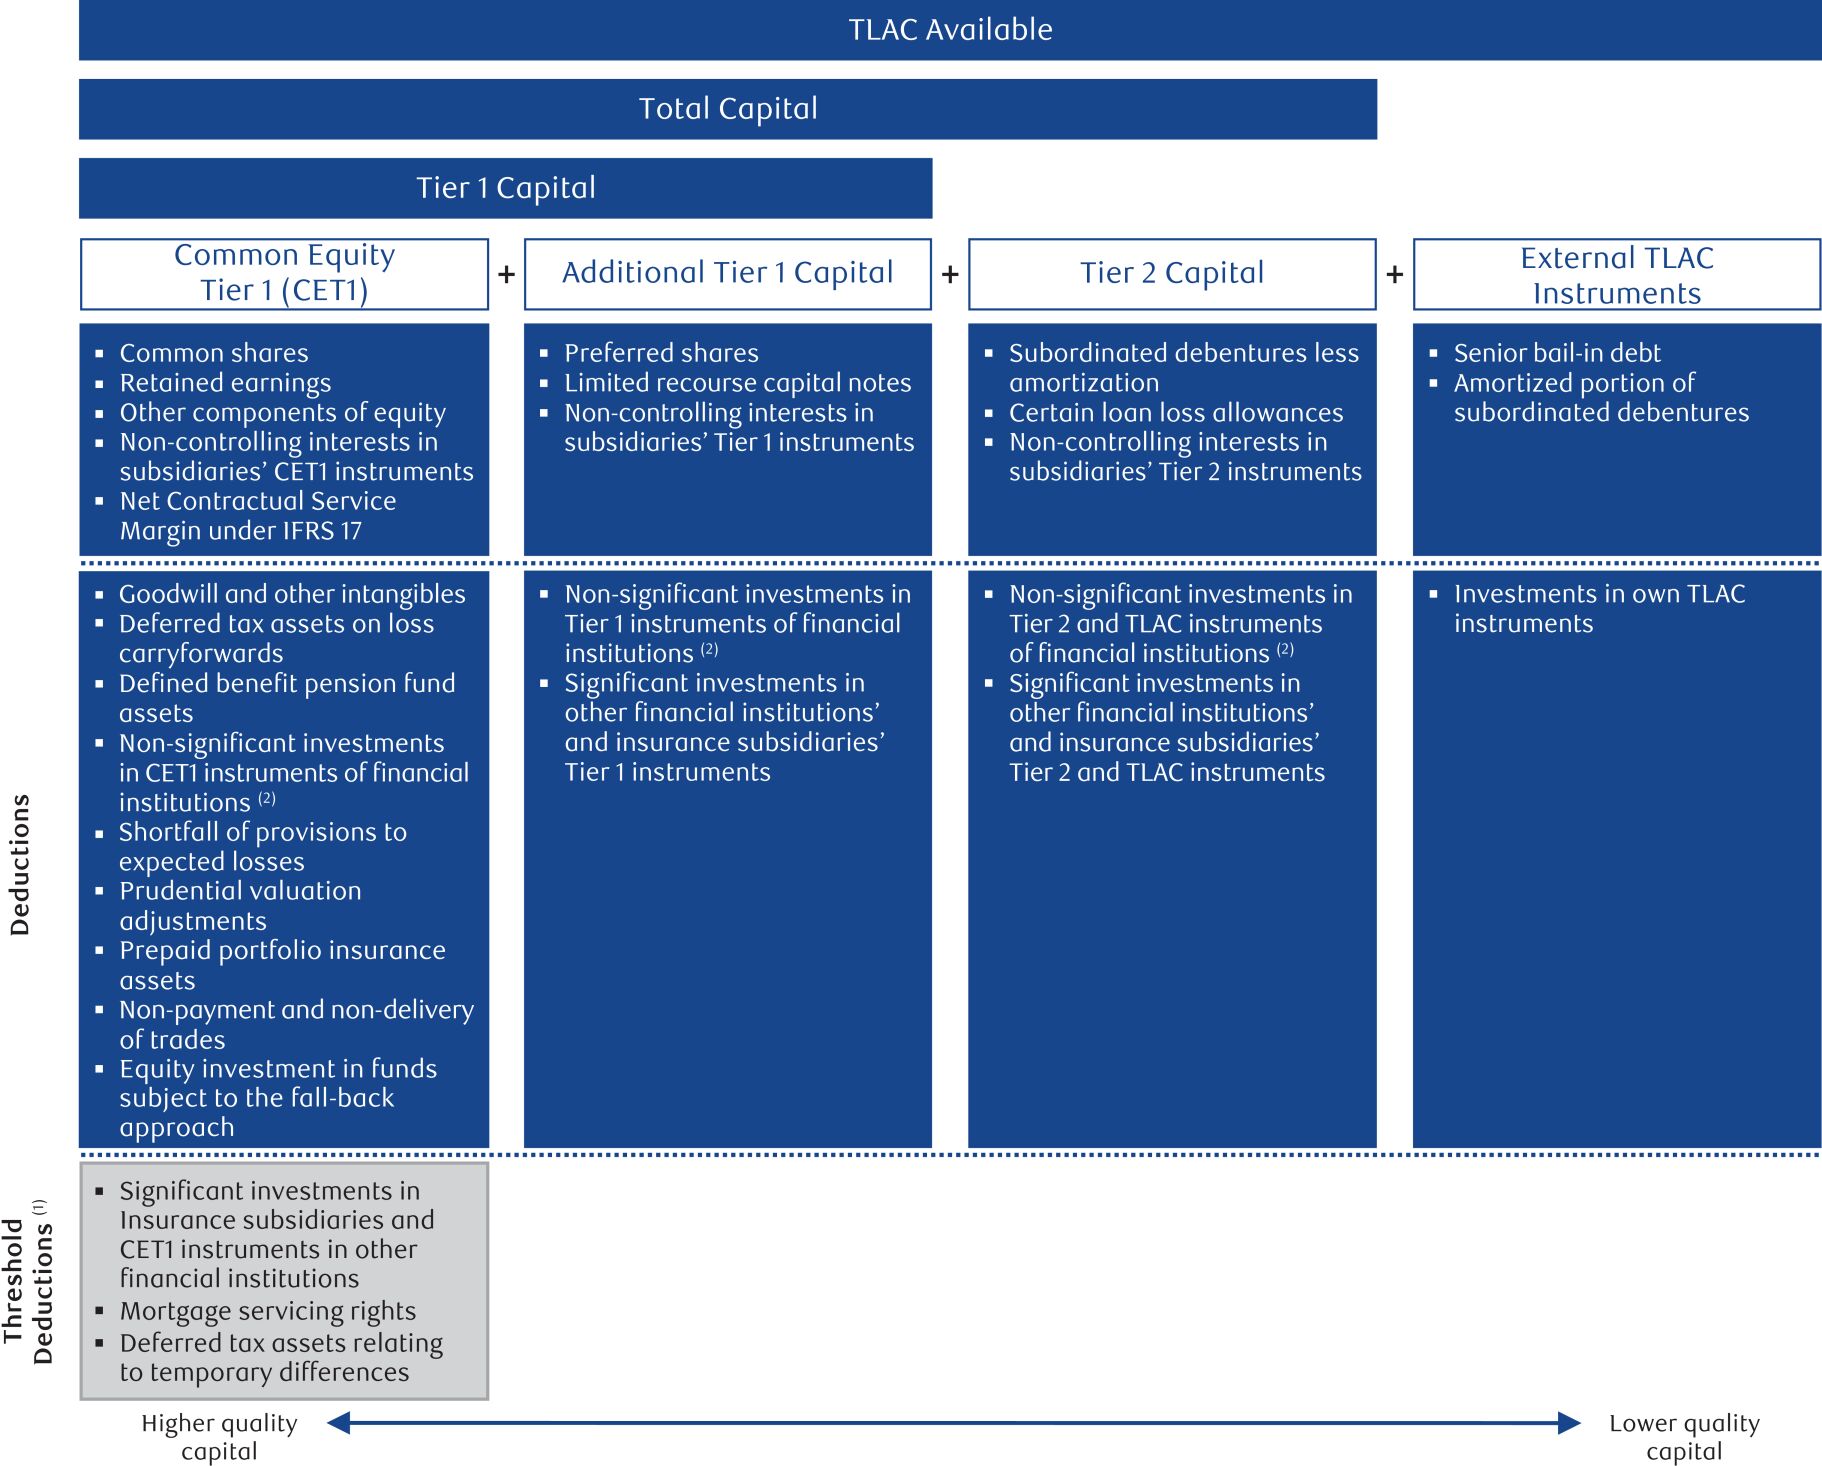
| (1) | First level: The amount by which each of the items exceeds a 10% threshold of CET1 capital (after all deductions but before threshold deductions) will be deducted from CET1 capital. Second level: The aggregate amount of the three items not deducted from the first level above and in excess of 15% of CET1 capital after regulatory adjustments will be deducted from capital, and the remaining balance not deducted will be risk-weighted at 250%. |
| (2) | Non-significant investments are subject to certain CAR criteria that drive the amount eligible for deduction. |
Regulatory capital, TLAC available, RWA and capital, leverage and TLAC ratios |
Table 63 |
| As at | ||||||||
(Millions of Canadian dollars, except percentage amounts) |
October 31 2025 |
October 31 2024 |
||||||
Capital (1) |
||||||||
CET1 capital |
$ |
98,748 |
$ | 88,936 | ||||
Tier 1 capital |
110,393 |
97,952 | ||||||
Total capital |
122,399 |
110,487 | ||||||
Risk-weighted assets (RWA) used in calculation of capital ratios (1) |
||||||||
Credit risk |
$ |
590,306 |
$ | 548,809 | ||||
Market risk |
41,506 |
33,930 | ||||||
Operational risk |
98,413 |
89,543 | ||||||
Total RWA |
$ |
730,225 |
$ | 672,282 | ||||
Capital ratios and Leverage ratio (1) |
||||||||
CET1 ratio |
13.5% |
13.2% | ||||||
Tier 1 capital ratio |
15.1% |
14.6% | ||||||
Total capital ratio |
16.8% |
16.4% | ||||||
Leverage ratio |
4.4% |
4.2% | ||||||
Leverage ratio exposure |
$ |
2,491,090 |
$ | 2,344,228 | ||||
TLAC available and ratios (2) |
||||||||
TLAC available |
$ |
230,385 |
$ | 196,659 | ||||
TLAC ratio |
31.5% |
29.3% | ||||||
TLAC leverage ratio |
9.2% |
8.4% | ||||||
| (1) | Capital, RWA, and capital ratios are calculated using OSFI’s CAR guideline and the Leverage ratio is calculated using OSFI’s LR guideline. Both the CAR guideline and LR guideline are based on the Basel III framework. |
| (2) | TLAC available and TLAC ratios are calculated using OSFI’s TLAC guideline. The TLAC standard is applied at the resolution entity level which for us is deemed to be Royal Bank of Canada and its subsidiaries. A resolution entity and its subsidiaries are collectively called a resolution group. The TLAC ratio and TLAC leverage ratio are calculated using TLAC available as a percentage of total RWA and leverage exposure, respectively. |
Regulatory capital and TLAC available |
Table 64 |
| As at | ||||||||
(Millions of Canadian dollars) |
October 31 2025 |
October 31 2024 |
||||||
CET1 capital: instruments and reserves and regulatory adjustments |
||||||||
Directly issued qualifying common share capital (and equivalent for non-joint stock companies) plus related stock surplus |
$ |
21,085 |
$ | 21,243 | ||||
Retained earnings |
96,606 |
88,317 | ||||||
Contractual service margins regulatory adjustment |
1,279 |
1,526 | ||||||
Accumulated other comprehensive income (and other reserves) |
9,726 |
8,498 | ||||||
Common share capital issued by subsidiaries and held by third parties (amount allowed in group CET1) |
14 |
11 | ||||||
Regulatory adjustments applied to CET1 under Basel III |
(29,962 |
) |
(30,659 | ) | ||||
Common Equity Tier 1 capital (CET1) |
$ |
98,748 |
$ |
88,936 |
||||
Additional Tier 1 capital: instruments and regulatory adjustments |
||||||||
Directly issued qualifying Additional Tier 1 instruments plus related stock surplus |
$ |
11,643 |
$ | 9,014 | ||||
Additional Tier 1 instruments issued by subsidiaries and held by third parties (amount allowed in group AT1) |
2 |
2 | ||||||
Additional Tier 1 capital (AT1) |
$ |
11,645 |
$ |
9,016 |
||||
Tier 1 capital (T1 = CET1 + AT1) |
$ |
110,393 |
$ |
97,952 |
||||
Tier 2 capital: instruments and provisions and regulatory adjustments |
||||||||
Directly issued qualifying Tier 2 instruments plus related stock surplus |
$ |
11,404 |
$ | 11,412 | ||||
Tier 2 instruments issued by subsidiaries and held by third parties (amount allowed in group Tier 2) |
4 |
3 | ||||||
Collective allowance |
598 |
1,120 | ||||||
Tier 2 capital (T2) |
$ |
12,006 |
$ |
12,535 |
||||
Total capital (T1 + T2) |
$ |
122,399 |
$ |
110,487 |
||||
External TLAC: instruments and regulatory adjustments |
||||||||
External TLAC instruments |
$ |
108,492 |
$ | 85,008 | ||||
Amortized portion of T2 instruments where remaining maturity > 1 year |
– |
1,670 | ||||||
Regulatory adjustments applied to TLAC under Basel III |
(506 |
) |
(506 | ) | ||||
TLAC available (Total capital + External TLAC) |
$ |
230,385 |
$ | 196,659 | ||||
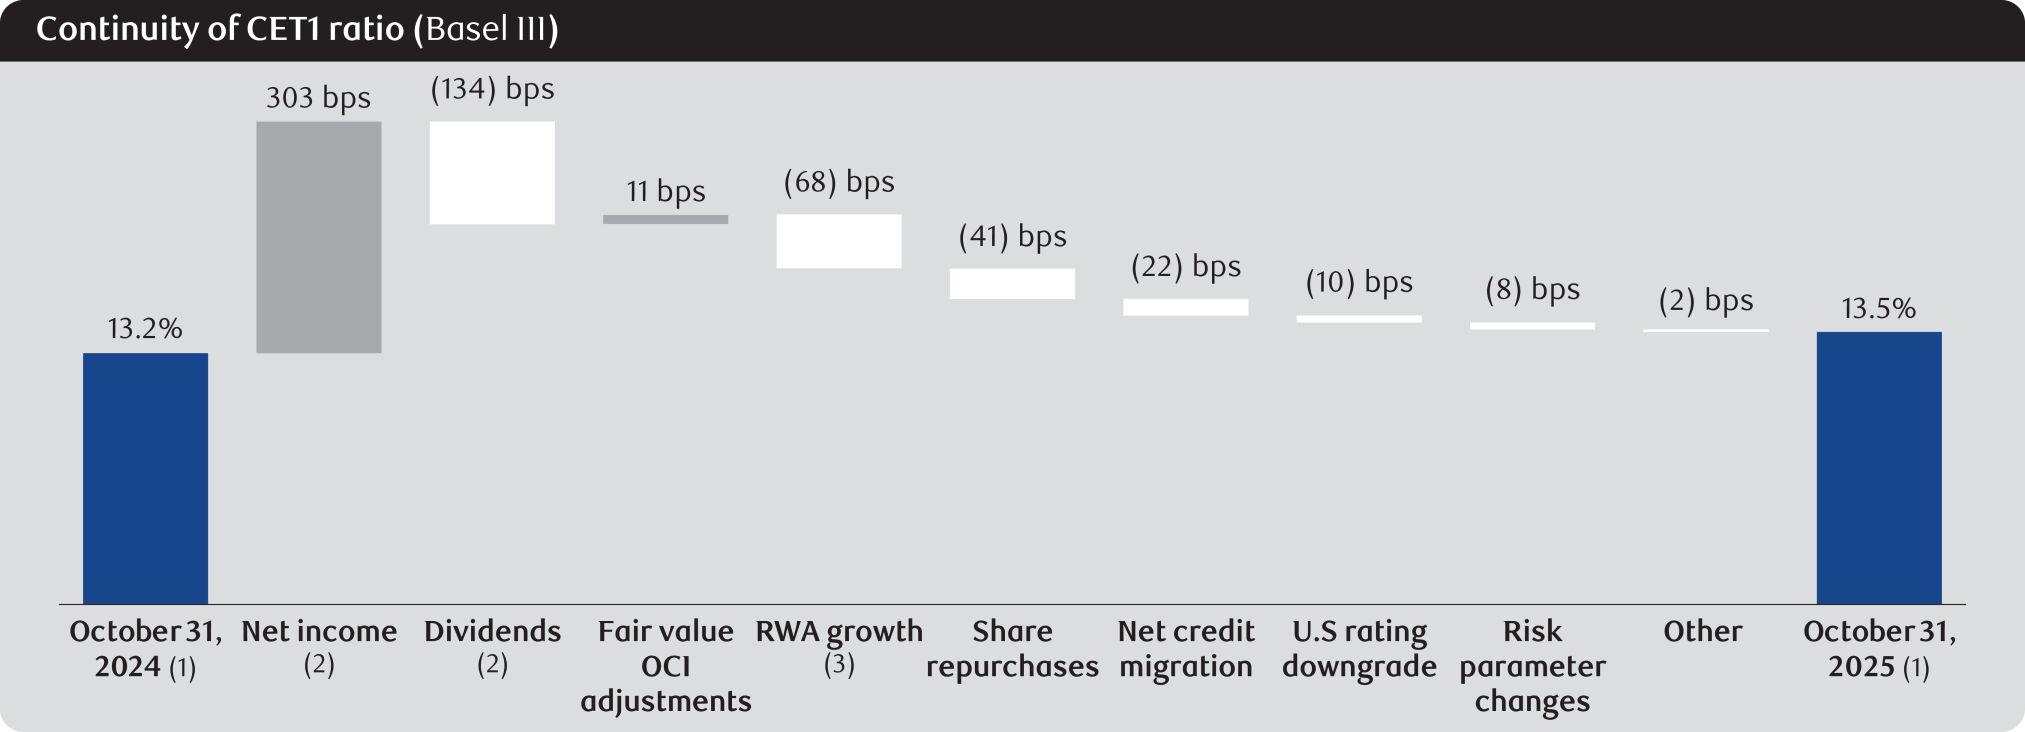
| (1) | Represents rounded figures. |
| (2) | Represents net internal capital generation of $11.4 billion or 169 bps consisting of Net income available to shareholders less common and preferred share dividends and distributions on other equity instruments. |
| (3) | Excludes the impact of foreign exchange translation (included in Other), net credit migration, U.S. rating downgrade and risk parameter changes. |
Total capital risk-weighted assets |
Table 65 | |||
2025 |
2024 | |||||||||||||||||||||||||||||||||
Average of risk- weights |
Risk-weighted assets All-in Basis |
|||||||||||||||||||||||||||||||||
| As at October 31 (Millions of Canadian dollars, except percentage amounts) |
Exposure |
Standardized approach |
Advanced approach (A-IRB) |
Foundation approach (F-IRB) |
Other |
Total |
Total | |||||||||||||||||||||||||||
Credit risk |
||||||||||||||||||||||||||||||||||
Lending-related and other |
||||||||||||||||||||||||||||||||||
Residential mortgages |
$ |
647,159 |
9% |
$ |
4,282 |
$ |
54,138 |
$ |
– |
$ |
– |
$ |
58,420 |
$ | 51,928 | |||||||||||||||||||
Other retail (personal, credit cards and small business treated as retail) |
220,490 |
32% |
5,401 |
64,729 |
– |
– |
70,130 |
62,679 | ||||||||||||||||||||||||||
Business (corporate, commercial, medium-sized enterprises and non-bank financial institutions) |
585,507 |
50% |
64,610 |
129,972 |
96,927 |
– |
291,509 |
282,595 | ||||||||||||||||||||||||||
Sovereign (government) |
422,984 |
4% |
2,151 |
15,046 |
– |
– |
17,197 |
14,116 | ||||||||||||||||||||||||||
Bank |
59,287 |
43% |
12,659 |
– |
12,640 |
– |
25,299 |
19,231 | ||||||||||||||||||||||||||
Total lending-related and other |
$ |
1,935,427 |
24% |
$ |
89,103 |
$ |
263,885 |
$ |
109,567 |
$ |
– |
$ |
462,555 |
$ | 430,549 | |||||||||||||||||||
Trading-related |
||||||||||||||||||||||||||||||||||
Repo-style transactions |
$ |
1,424,011 |
1% |
$ |
156 |
$ |
369 |
$ |
8,720 |
$ |
80 |
$ |
9,325 |
$ | 8,528 | |||||||||||||||||||
Derivatives – including CVA |
162,136 |
24% |
636 |
2,269 |
15,279 |
20,784 |
38,968 |
36,704 | ||||||||||||||||||||||||||
Total trading-related |
$ |
1,586,147 |
3% |
$ |
792 |
$ |
2,638 |
$ |
23,999 |
$ |
20,864 |
$ |
48,293 |
$ | 45,232 | |||||||||||||||||||
Total lending-related and other and trading-related |
$ |
3,521,574 |
15% |
$ |
89,895 |
$ |
266,523 |
$ |
133,566 |
$ |
20,864 |
$ |
510,848 |
$ | 475,781 | |||||||||||||||||||
Bank book equities |
7,481 |
198% |
14,828 |
– |
– |
– |
14,828 |
12,079 | ||||||||||||||||||||||||||
Securitization exposures |
93,423 |
17% |
9,594 |
6,704 |
– |
– |
16,298 |
15,181 | ||||||||||||||||||||||||||
Other assets |
37,770 |
128% |
n.a. |
n.a. |
n.a. |
48,332 |
48,332 |
45,768 | ||||||||||||||||||||||||||
Total credit risk |
$ |
3,660,248 |
16% |
$ |
114,317 |
$ |
273,227 |
$ |
133,566 |
$ |
69,196 |
$ |
590,306 |
$ | 548,809 | |||||||||||||||||||
Market risk |
||||||||||||||||||||||||||||||||||
Interest rate |
$ |
4,673 |
$ |
4,673 |
$ | 1,956 | ||||||||||||||||||||||||||||
Equity |
3,964 |
3,964 |
3,656 | |||||||||||||||||||||||||||||||
Foreign exchange |
2,698 |
2,698 |
2,787 | |||||||||||||||||||||||||||||||
Commodities |
1,136 |
1,136 |
1,787 | |||||||||||||||||||||||||||||||
Credit |
10,671 |
10,671 |
8,374 | |||||||||||||||||||||||||||||||
Default risk charge |
13,162 |
13,162 |
10,898 | |||||||||||||||||||||||||||||||
Other (3) |
5,202 |
5,202 |
4,472 | |||||||||||||||||||||||||||||||
Total market risk |
$ |
41,506 |
$ |
41,506 |
$ | 33,930 | ||||||||||||||||||||||||||||
Operational risk |
$ |
98,413 |
$ |
98,413 |
$ | 89,543 | ||||||||||||||||||||||||||||
Total risk-weighted assets |
$ |
3,660,248 |
$ |
254,236 |
$ |
273,227 |
$ |
133,566 |
$ |
69,196 |
$ |
730,225 |
$ | 672,282 | ||||||||||||||||||||
| (1) | Total exposure represents exposure at default (EAD) which is the expected gross exposure upon the default of an obligor. This amount excludes any allowance against impaired loans or partial write-offs and does not reflect the impact of credit risk mitigation. |
| (2) | Represents the average of counterparty risk weights within a particular category. |
| (3) | Represents the market risk RWA for the residual risk add-on charge under the standardized approach and the capital surcharge for movements between the trading book and banking book. |
| n.a. | not applicable |
Selected capital management activity |
Table 66 | |||||
For the year ended October 31, 2025 |
||||||||||||
| (Millions of Canadian dollars, except number of shares) | Issuance or redemption date |
Number of shares |
Amount |
|||||||||
Tier 1 capital |
||||||||||||
Common shares activity |
||||||||||||
Issued in connection with share-based compensation plans (1) |
796 |
$ |
77 |
|||||||||
Purchased for cancellation (2) |
(15,241 |
) |
(227 |
) | ||||||||
Issuance of LRCNs Series 5 (2), (3), (4) |
November 1, 2024 |
1,000 |
1,396 |
|||||||||
Redemption of preferred shares, Series BD (2), (3) |
May 24, 2025 |
(24,000 |
) |
(600 |
) | |||||||
Issuance of LRCNs Series 6 (2), (3), (4) |
June 11, 2025 |
1,250 |
1,708 |
|||||||||
Issuance of LRCNs Series 7 (2), (3), (4) |
September 23, 2025 |
1,350 |
1,869 |
|||||||||
Redemption of LRCNs Series 1 (2), (3), (4) |
October 24, 2025 |
(1,750 |
) |
(1,750 |
) | |||||||
Tier 2 capital |
||||||||||||
Redemption of December 23, 2029 subordinated debentures (3), (5) |
December 23, 2024 |
$ |
(1,500 |
) | ||||||||
Issuance of February 4, 2035 subordinated debentures (3), (5) |
January 29, 2025 |
1,500 |
||||||||||
Redemption of June 30, 2030 subordinated debentures (3), (5) |
June 30, 2025 |
(1,250 |
) | |||||||||
Issuance of July 3, 2035 subordinated debentures (3), (5) |
July 3, 2025 |
1,250 |
||||||||||
Issuance of July 17, 2035 subordinated debentures (3), (5) |
July 17, 2025 |
241 |
||||||||||
| (1) | Amounts include cash received for stock options exercised during the period and fair value adjustments to stock options. |
| (2) | For further details, refer to Note 19 of our 2025 Annual Consolidated Financial Statements. |
| (3) | Non-Viability Contingent Capital (NVCC) instruments. |
| (4) | For the LRCNs, the number of shares represents the number of notes issued. |
| (5) | For further details, refer to Note 18 of our 2025 Annual Consolidated Financial Statements. |
Selected share data (1) |
Table 67 | |||||||
2025 |
2024 | |||||||||||||||||||||||||||
| (Millions of Canadian dollars, except number of shares and as otherwise noted) |
Number of shares |
Amount |
Dividends declared per share |
Number of shares (000s) |
Amount | Dividends declared per share |
||||||||||||||||||||||
Common shares issued |
1,400,635 |
$ |
20,863 |
$ |
6.04 |
1,415,080 | $ | 21,013 | $ | 5.60 | ||||||||||||||||||
Treasury shares – common shares (2) |
(521 |
) |
(110 |
) |
(576 | ) | (61 | ) | ||||||||||||||||||||
Common shares outstanding |
1,400,114 |
$ |
20,753 |
1,414,504 | $ | 20,952 | ||||||||||||||||||||||
Stock options and awards |
||||||||||||||||||||||||||||
Outstanding |
7,490 |
7,375 | ||||||||||||||||||||||||||
Exercisable |
3,522 |
3,212 | ||||||||||||||||||||||||||
Available for grant |
16,381 |
2,291 | ||||||||||||||||||||||||||
First preferred shares issued |
||||||||||||||||||||||||||||
Non-cumulative Series BD (3), (4), (5) |
– |
– |
0.80 |
24,000 | 600 | 0.80 | ||||||||||||||||||||||
Non-cumulative Series BF (3), (4), (6) |
12,000 |
300 |
0.75 |
12,000 | 300 | 0.75 | ||||||||||||||||||||||
Non-cumulative Series BH (4), (7) |
6,000 |
150 |
1.23 |
6,000 | 150 | 1.23 | ||||||||||||||||||||||
Non-cumulative Series BI (4), (7) |
6,000 |
150 |
1.23 |
6,000 | 150 | 1.23 | ||||||||||||||||||||||
Non-cumulative Series BO (3), (4) |
14,000 |
350 |
1.47 |
14,000 | 350 | 1.40 | ||||||||||||||||||||||
Non-cumulative Series BT (3), (4), (6) |
750 |
750 |
4.20% |
750 | 750 | 4.20% | ||||||||||||||||||||||
Non-cumulative Series BU (3), (4), (6) |
750 |
750 |
7.408% |
750 | 750 | 7.408% | ||||||||||||||||||||||
Non-cumulative Series BW (3), (4), (6) |
600 |
600 |
6.698% |
600 | 600 | 6.698% | ||||||||||||||||||||||
Other equity instruments issued |
||||||||||||||||||||||||||||
LRCNs Series 1 (3), (4), (8), (9), (10) |
– |
– |
4.50% |
1,750 | 1,750 | 4.50% | ||||||||||||||||||||||
LRCNs Series 2 (3), (4), (8), (9), (11) |
1,250 |
1,250 |
4.00% |
1,250 | 1,250 | 4.00% | ||||||||||||||||||||||
LRCNs Series 3 (3), (4), (8), (9), (11) |
1,000 |
1,000 |
3.65% |
1,000 | 1,000 | 3.65% | ||||||||||||||||||||||
LRCNs Series 4 (3), (4), (8), (9), (11) |
1,000 |
1,370 |
7.50% |
1,000 | 1,370 | 7.50% | ||||||||||||||||||||||
LRCNs Series 5 (3), (4), (8), (9), (11) |
1,000 |
1,396 |
6.35% |
– | – | – | ||||||||||||||||||||||
LRCNs Series 6 (3), (4), (8), (9), (11) |
1,250 |
1,708 |
6.75% |
– | – | – | ||||||||||||||||||||||
LRCNs Series 7 (3), (4), (8), (9), (11) |
1,350 |
1,869 |
6.50% |
– | – | – | ||||||||||||||||||||||
Preferred shares and other equity instruments issued |
46,950 |
$ |
11,643 |
69,100 | $ | 9,020 | ||||||||||||||||||||||
Treasury instruments – preferred shares and other equity instruments (2) |
35 |
32 |
13 | 11 | ||||||||||||||||||||||||
Preferred shares and other equity instruments outstanding |
46,985 |
$ |
11,675 |
69,113 | $ | 9,031 | ||||||||||||||||||||||
Dividends on common shares |
$ |
8,502 |
$ | 7,916 | ||||||||||||||||||||||||
Dividends on preferred shares and distributions on other equity instruments (12) |
494 |
322 | ||||||||||||||||||||||||||
| (1) | For further details, refer to Note 19 of our 2025 Annual Consolidated Financial Statements. |
| (2) | Positive amounts represent a short position and negative amounts represent a long position. |
| (3) | Dividend rate will reset every five years. |
| (4) | NVCC instruments. |
| (5) | On May 24, 2025, we redeemed all 24 million of our issued and outstanding Non-Cumulative 5-Year Rate Reset First Preferred Shares Series BD at a price of $25 per share. |
| (6) | On November 24, 2025, we redeemed all 12 million of our issued and outstanding Non-Cumulative 5-Year Rate Reset First Preferred Shares Series BF at a price of $25 per share. |
| (7) | On October 24, 2025, we announced our intention to redeem all 6 million of our issued and outstanding Non-Cumulative Fixed Rate First Preferred Shares Series BH and all 6 million of our issued and outstanding Non-Cumulative Fixed Rate First Preferred Shares Series BI, at a price of $25 per share. |
| (8) | The dividends declared per share represent the per annum dividend rate applicable to the shares issued as at the reporting date. |
| (9) | For LRCN Series, the number of shares represent the number of notes issued and the dividends declared per share represent the annual interest rate percentage applicable to the notes issued as at the reporting date. |
| (10) | In connection with the redemption of LRCN Series 1, on October 24, 2025, we redeemed all $1,750 million of our issued and outstanding Non-Cumulative 5-Year Fixed Rate Reset First Preferred Shares Series BQ. |
| (11) | In connection with the issuance of LRCN Series 2, on November 2, 2020, we issued $1,250 million of Non-Cumulative 5-Year Fixed Rate Reset First Preferred Shares Series BR (Series BR); in connection with the issuance of LRCN Series 3, on June 8, 2021, we issued $1,000 million of Non-Cumulative 5-Year Fixed Rate Reset First Preferred Shares Series BS (Series BS); in connection with the issuance of LRCN Series 4 on April 24, 2024, we issued US$1,000 million of Non-Cumulative 5-Year Fixed Rate Reset First Preferred Shares Series BV (Series BV); in connection with the issuance of LRCN Series 5 on November 1, 2024, we issued US$1,000 million of Non-Cumulative 5-Year Fixed Rate Reset First Preferred Shares Series BX (Series BX); in connection with the issuance of LRCN Series 6 on June 11, 2025, we issued US$1,250 million of Non-Cumulative 5-Year Fixed Rate Reset First Preferred Shares Series BY (Series BY) ); and in connection with the issuance of LRCN Series 7 on September 23, 2025, we issued US$1,350 million of Non-Cumulative 5-Year Fixed Rate Reset First Preferred Shares Series BZ (Series BZ). The Series BR and BS preferred shares were issued at a price of $1,000 per share and the Series BV, BX, BY and BZ preferred shares were issued at a price of US$1,000 per share. The Series BR, BS, BV, BX, BY and BZ preferred shares were issued to a consolidated trust to be held as trust assets in connection with the LRCN series. For further details, refer to Note 19 of our 2025 Annual Consolidated Financial Statements. |
| (12) | Excludes distributions to non-controlling interests. |
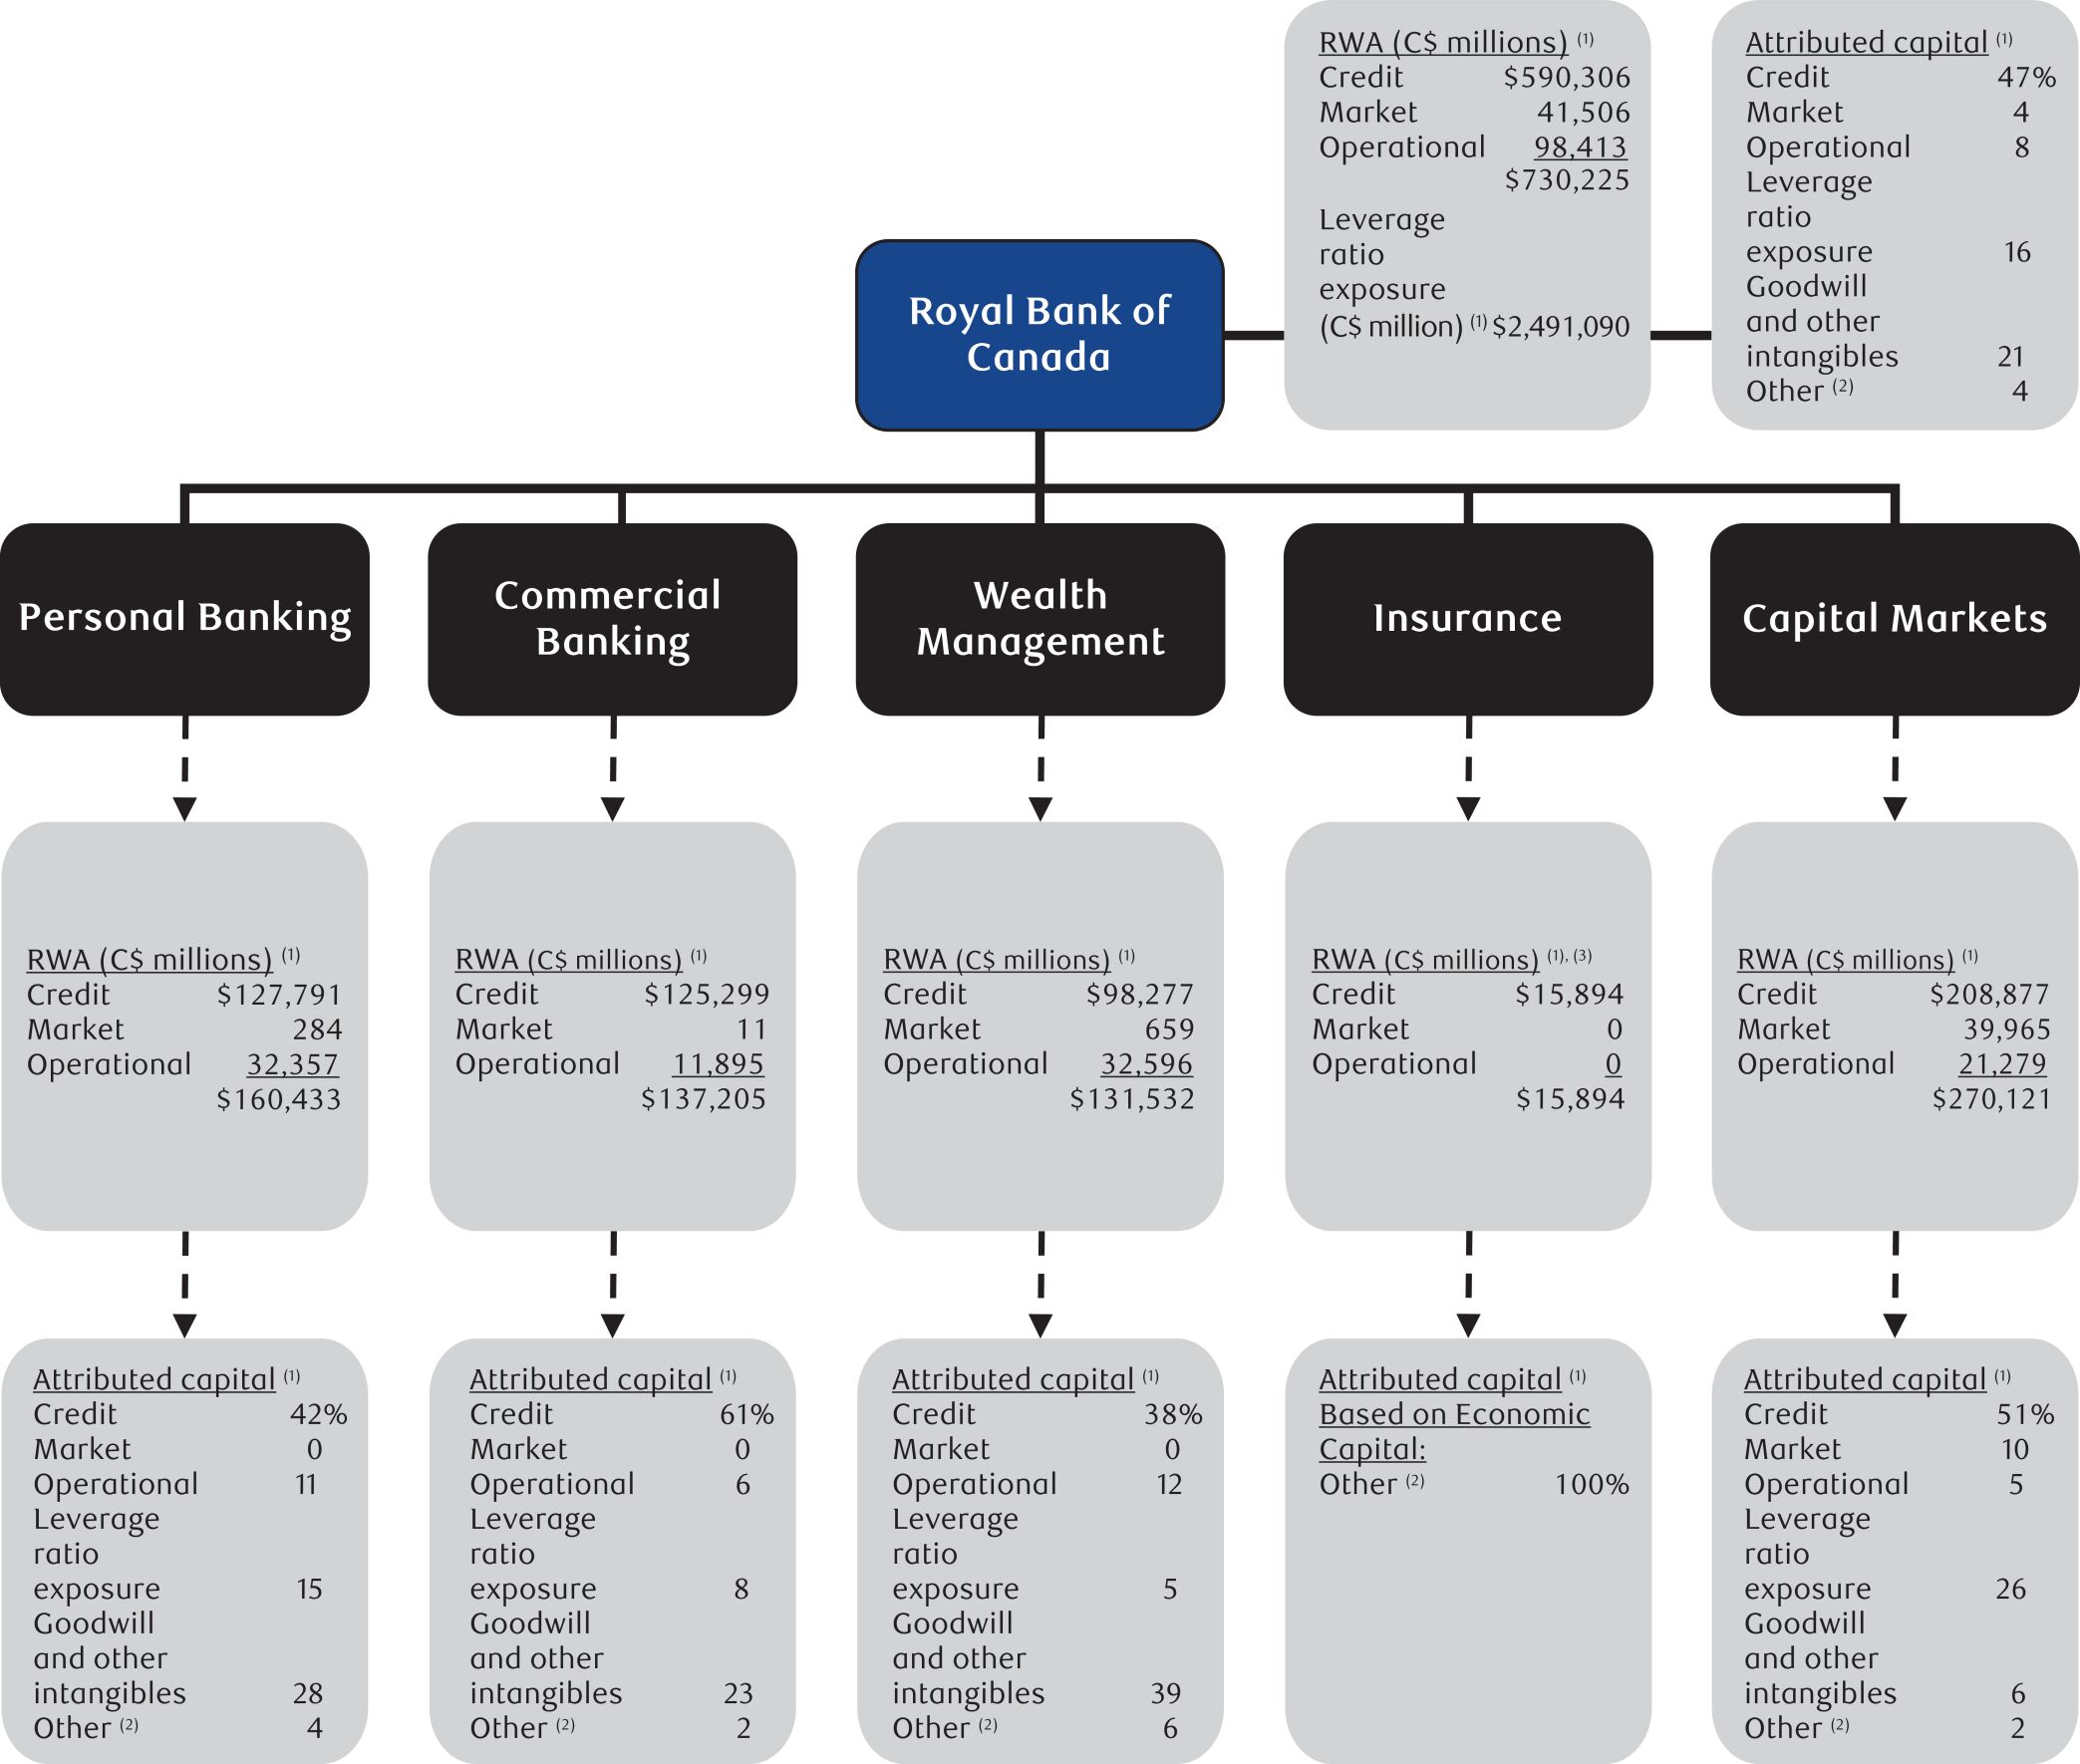
| (1) | RWA and Leverage ratio exposure amount represents period-end spot balances. Attributed Capital represents average balances. |
| (2) | Other includes (a) non-Insurance segments: equity required to underpin Basel III regulatory capital deductions other than Goodwill and other intangibles and (b) Insurance segment: equity required to underpin risks associated with the business. |
| (3) | Insurance RWA represents our investments in the insurance subsidiaries capitalized at the regulatory prescribed rate as required under the OSFI CAR guideline. |
| • | Consolidation: entities which we control are consolidated on our Consolidated Balance Sheets. |
| • | Deduction: certain holdings are deducted from our regulatory capital. These include all unconsolidated “substantial investments”, as defined by the Bank Act |
| • | Risk-weighting: equity investments that are not deducted from capital are risk-weighted at a prescribed rate for determination of capital charges. |
Accounting and control matters |
Critical accounting policies and estimates |
| • | Performing financial assets |
| • | Stage 1 – From initial recognition of a financial asset to the date on which the asset has experienced a significant increase in credit risk relative to its initial recognition, a loss allowance is recognized equal to the credit losses expected to result from defaults occurring over the 12 months following the reporting date. |
| • | Stage 2 – Following a significant increase in credit risk relative to the initial recognition of the financial asset, a loss allowance is recognized equal to the credit losses expected over the remaining lifetime of the asset. |
| • | Impaired financial assets |
| • | Stage 3 – When a financial asset is considered to be credit-impaired, a loss allowance is recognized equal to credit losses expected over the remaining lifetime of the asset. Interest income is calculated based on the carrying amount of the asset, net of the loss allowance, rather than on its gross carrying amount. |
Controls and procedures |
Related party transactions |
Supplementary information |
Selected annual information |
Table 68 |
(Millions of Canadian dollars, except per share amounts) |
2025 |
2024 | 2023 | |||||||||
Total revenue |
$ |
66,605 |
$ | 57,344 | $ | 51,464 | ||||||
Net income attributable to: |
||||||||||||
Shareholders |
20,362 |
16,230 | 14,605 | |||||||||
Non-controlling interest |
7 |
10 | 7 | |||||||||
$ |
20,369 |
$ | 16,240 | $ | 14,612 | |||||||
Basic earnings per share |
$ |
14.10 |
$ | 11.27 | $ | 10.33 | ||||||
Diluted earnings per share |
14.07 |
11.25 | 10.32 | |||||||||
Dividends declared per common shares |
6.04 |
5.60 | 5.34 | |||||||||
Total assets |
$ |
2,325,006 |
$ | 2,171,582 | $ | 2,006,531 | ||||||
Deposits |
1,515,616 |
1,409,531 | 1,231,687 | |||||||||
Net interest income on average assets and liabilities |
Table 69 | |||||||||||||||
| Average balances | Interest | Average rate | ||||||||||||||||||||||||||||||
(Millions of Canadian dollars, except for percentage amounts) |
2025 |
2024 | 2025 |
2024 | 2025 |
2024 | ||||||||||||||||||||||||||
Assets |
||||||||||||||||||||||||||||||||
Deposits with other banks |
||||||||||||||||||||||||||||||||
Canada |
$ |
19,134 |
$ | 13,170 | $ |
905 |
$ | 1,468 | 4.73% |
11.15% | ||||||||||||||||||||||
U.S. |
88,197 |
74,409 | 3,782 |
3,906 | 4.29 |
5.25 | ||||||||||||||||||||||||||
Other International |
8,568 |
7,527 | 674 |
748 | 7.87 |
9.94 | ||||||||||||||||||||||||||
115,899 |
95,106 | 5,361 |
6,122 | 4.63 |
6.44 | |||||||||||||||||||||||||||
Securities |
||||||||||||||||||||||||||||||||
Trading |
203,740 |
176,632 | 8,126 |
7,927 | 3.99 |
4.49 | ||||||||||||||||||||||||||
Investment, net of applicable allowance |
303,673 |
226,256 | 11,929 |
9,741 | 3.93 |
4.31 | ||||||||||||||||||||||||||
507,413 |
402,888 | 20,055 |
17,668 | 3.95 |
4.39 | |||||||||||||||||||||||||||
Asset purchased under reverse repurchase agreements and securities borrowed |
407,516 |
396,552 | 22,367 |
27,121 | 5.49 |
6.84 | ||||||||||||||||||||||||||
Loans (1) |
||||||||||||||||||||||||||||||||
Canada |
||||||||||||||||||||||||||||||||
Retail |
575,950 |
541,468 | 29,989 |
29,663 | 5.21 |
5.48 | ||||||||||||||||||||||||||
Wholesale |
197,115 |
165,911 | 13,697 |
12,295 | 6.95 |
7.41 | ||||||||||||||||||||||||||
773,065 |
707,379 | 43,686 |
41,958 | 5.65 |
5.93 | |||||||||||||||||||||||||||
U.S. |
174,680 |
159,046 | 7,971 |
8,362 | 4.56 |
5.26 | ||||||||||||||||||||||||||
Other International |
61,370 |
51,263 | 4,385 |
3,720 | 7.15 |
7.26 | ||||||||||||||||||||||||||
1,009,115 |
917,688 | 56,042 |
54,040 | 5.55 |
5.89 | |||||||||||||||||||||||||||
Total interest-earning assets |
2,039,943 |
1,812,234 | 103,825 |
104,951 | 5.09 |
5.79 | ||||||||||||||||||||||||||
Non-interest-bearing deposits with other banks |
56,823 |
60,220 | – |
– | – |
– | ||||||||||||||||||||||||||
Other assets |
301,656 |
236,003 | – |
– | – |
– | ||||||||||||||||||||||||||
Total assets |
$ |
2,398,422 |
$ | 2,108,457 | $ |
103,825 |
$ | 104,951 | 4.33% |
4.98% | ||||||||||||||||||||||
Liabilities and shareholders’ equity |
||||||||||||||||||||||||||||||||
Deposits (2) |
||||||||||||||||||||||||||||||||
Canada |
$ |
995,471 |
$ | 892,275 | $ |
33,883 |
$ | 36,999 | 3.40% |
4.15% | ||||||||||||||||||||||
U.S. |
180,477 |
155,928 | 6,326 |
6,377 | 3.51 |
4.09 | ||||||||||||||||||||||||||
Other International |
116,666 |
83,069 | 4,608 |
3,880 | 3.95 |
4.67 | ||||||||||||||||||||||||||
1,292,614 |
1,131,272 | 44,817 |
47,256 | 3.47 |
4.18 | |||||||||||||||||||||||||||
Obligations related to securities sold short |
47,454 |
35,826 | 2,988 |
2,766 | 6.30 |
7.72 | ||||||||||||||||||||||||||
Obligations related to assets sold under repurchase agreements and securities loaned |
400,611 |
374,099 | 21,820 |
25,479 | 5.45 |
6.81 | ||||||||||||||||||||||||||
Subordinated debentures |
13,540 |
12,641 | 637 |
775 | 4.70 |
6.13 | ||||||||||||||||||||||||||
Other interest-bearing liabilities |
25,853 |
25,166 | 563 |
722 | 2.18 |
2.87 | ||||||||||||||||||||||||||
Total interest-bearing liabilities |
1,780,072 |
1,579,004 | 70,825 |
76,998 | 3.98 |
4.88 | ||||||||||||||||||||||||||
Non-interest-bearing deposits |
203,498 |
185,758 | – |
– | – |
– | ||||||||||||||||||||||||||
Other liabilities |
281,918 |
224,480 | – |
– | – |
– | ||||||||||||||||||||||||||
Total liabilities |
$ |
2,265,488 |
$ | 1,989,242 | $ |
70,825 |
$ | 76,998 | 3.13% |
3.87% | ||||||||||||||||||||||
Equity |
$ |
132,934 |
$ | 119,215 | n.a. |
n.a. | n.a. |
n.a. | ||||||||||||||||||||||||
Total liabilities and shareholders’ equity |
$ |
2,398,422 |
$ | 2,108,457 | $ |
70,825 |
$ | 76,998 | 2.95% |
3.65% | ||||||||||||||||||||||
Net interest income and margin |
$ |
2,398,422 |
$ | 2,108,457 | $ |
33,000 |
$ | 27,953 | 1.38% |
1.33% | ||||||||||||||||||||||
Net interest income and margin (average earning assets, net) (3) |
||||||||||||||||||||||||||||||||
Canada |
$ |
1,209,193 |
$ | 1,088,773 | $ |
26,416 |
$ | 22,281 | 2.18% |
2.05% | ||||||||||||||||||||||
U.S. |
584,814 |
526,059 | 5,092 |
4,268 | 0.87 |
0.81 | ||||||||||||||||||||||||||
Other International |
245,936 |
197,401 | 1,492 |
1,404 | 0.61 |
0.71 | ||||||||||||||||||||||||||
Total |
$ |
2,039,943 |
$ | 1,812,233 | $ |
33,000 |
$ | 27,953 | 1.62% |
1.54% | ||||||||||||||||||||||
| (1) | Interest income includes loan fees of $1,212 million (2024 – $1,165 million; 2023 – $1,149 million). |
| (2) | Deposits include personal chequing and savings deposits with average balances of $277 billion (2024 – $254 billion; 2023 – $250 billion), interest expense of $2,610 million (2024 – $3,580 million; 2023 – $2,840 million) and average rates of 0.94% (2024 – 1.41%; 2023 – 1.14%). Deposits also include term deposits with average balances of $790 billion (2024 – $701 billion; 2023 – $624 billion), interest expense of $31,680 million (2024 – $31,520 million; 2023 – $24,260 million) and average rates of 4.00% (2024 – 4.50%; 2023 – 3.89%). |
| (3) | Geographic classification for selected assets and liabilities is based on the domicile of the booking point of the subject assets and liabilities. |
| n.a. | not applicable |
Change in net interest income |
Table 70 | |||||||||||||
2025 vs. 2024 |
2024 vs. 2023 |
|||||||||||||||||||||||||||
Increase (decrease) due to changes in |
Increase (decrease) due to changes in |
|||||||||||||||||||||||||||
| (Millions of Canadian dollars) | Average volume |
Average rate |
Net change |
Average volume (1) |
Average rate (1) |
Net change | ||||||||||||||||||||||
Assets |
||||||||||||||||||||||||||||
Deposits with other banks |
||||||||||||||||||||||||||||
Canada (2) |
$ |
665 |
$ |
(1,228 |
) |
$ |
(563 |
) |
$ | (55 | ) | $ | (175 | ) | $ | (230 | ) | |||||||||||
U.S. (2) |
724 |
(847 |
) |
(123 |
) |
(641 | ) | 583 | (58 | ) | ||||||||||||||||||
Other international (2) |
103 |
(177 |
) |
(74 |
) |
(609 | ) | 166 | (443 | ) | ||||||||||||||||||
Securities |
||||||||||||||||||||||||||||
Trading |
1,217 |
(1,018 |
) |
199 |
1,056 | (594 | ) | 462 | ||||||||||||||||||||
Investment, net of applicable allowance |
3,333 |
(1,145 |
) |
2,188 |
1,802 | 892 | 2,694 | |||||||||||||||||||||
Asset purchased under reverse repurchase agreements and securities borrowed |
750 |
(5,504 |
) |
(4,754 |
) |
770 | 4,187 | 4,957 | ||||||||||||||||||||
Loans |
||||||||||||||||||||||||||||
Canada (2) |
||||||||||||||||||||||||||||
Retail (2) |
1,889 |
(1,563 |
) |
326 |
1,853 | 3,948 | 5,801 | |||||||||||||||||||||
Wholesale (2) |
2,312 |
(910 |
) |
1,402 |
3,392 | 25 | 3,417 | |||||||||||||||||||||
U.S. (2) |
822 |
(1,213 |
) |
(391 |
) |
26 | 1,445 | 1,471 | ||||||||||||||||||||
Other international (2) |
733 |
(68 |
) |
665 |
36 | (148 | ) | (112 | ) | |||||||||||||||||||
Total interest income |
$ |
12,548 |
$ |
(13,673 |
) |
$ |
(1,125 |
) |
$ | 7,630 | $ | 10,329 | $ | 17,959 | ||||||||||||||
Liabilities |
||||||||||||||||||||||||||||
Deposits |
||||||||||||||||||||||||||||
Canada (2) |
4,279 |
(7,394 |
) |
(3,115 |
) |
4,374 | 4,997 | 9,371 | ||||||||||||||||||||
U.S. (2) |
1,004 |
(1,055 |
) |
(51 |
) |
73 | 921 | 994 | ||||||||||||||||||||
Other international (2) |
1,569 |
(841 |
) |
728 |
(415 | ) | 626 | 211 | ||||||||||||||||||||
Obligations related to securities sold short |
898 |
(676 |
) |
222 |
(43 | ) | (124 | ) | (167 | ) | ||||||||||||||||||
Obligations related to assets sold under repurchase agreements and securities loaned |
1,806 |
(5,465 |
) |
(3,659 |
) |
1,265 | 3,781 | 5,046 | ||||||||||||||||||||
Subordinated debentures |
55 |
(193 |
) |
(138 |
) |
97 | 12 | 109 | ||||||||||||||||||||
Other interest-bearing liabilities |
20 |
(179 |
) |
(159 |
) |
(381 | ) | (48 | ) | (429 | ) | |||||||||||||||||
Total interest expense |
$ |
9,631 |
$ |
(15,803 |
) |
$ |
(6,172 |
) |
$ | 4,970 | $ | 10,165 | $ | 15,135 | ||||||||||||||
Net interest income |
$ |
2,917 |
$ |
2,130 |
$ |
5,047 |
$ | 2,660 | $ | 164 | $ | 2,824 | ||||||||||||||||
| (1) | Volume/rate variance is allocated on the percentage relationships of changes in balances and changes in rates to the total net change in net interest income. |
| (2) | Geographic classification for selected assets and liabilities is based on the domicile of the booking point of the subject assets and liabilities. |
Loans and acceptances by geography |
Table 71 | |||||
As at October 31 (Millions of Canadian dollars) |
2025 |
2024 | ||||||
Canada (1) |
||||||||
Residential mortgages |
$ |
454,346 |
$ | 441,191 | ||||
Personal |
90,842 |
86,977 | ||||||
Credit cards |
25,836 |
24,619 | ||||||
Small business |
16,797 |
15,531 | ||||||
Retail |
587,821 |
568,318 | ||||||
Wholesale |
194,504 |
189,413 | ||||||
$ |
782,325 |
$ | 757,731 | |||||
U.S. (1) |
||||||||
Retail |
57,309 |
51,893 | ||||||
Wholesale |
143,441 |
119,231 | ||||||
200,750 |
171,124 | |||||||
Other International (1) |
||||||||
Retail |
7,214 |
6,767 | ||||||
Wholesale |
59,245 |
51,830 | ||||||
66,459 |
58,597 | |||||||
Total loans and acceptances |
$ |
1,049,534 |
$ | 987,452 | ||||
Total allowance for credit losses |
(7,093 |
) |
(6,037 | ) | ||||
Total loans and acceptances, net of allowance for credit losses |
$ |
1,042,441 |
$ | 981,415 | ||||
| (1) | Geographic information is based on residence of borrower. |
Loans and acceptances by portfolio and sector |
Table 72 | |||
As at October 31 (Millions of Canadian dollars) |
2025 |
2024 | ||||||
Residential mortgages |
$ |
493,413 |
$ | 477,544 | ||||
Personal |
115,345 |
108,338 | ||||||
Credit cards |
26,789 |
25,565 | ||||||
Small business |
16,797 |
15,531 | ||||||
Retail |
$ |
652,344 |
$ | 626,978 | ||||
Agriculture |
13,958 |
13,065 | ||||||
Automotive |
14,155 |
14,386 | ||||||
Banking |
9,397 |
8,829 | ||||||
Consumer discretionary |
27,132 |
23,670 | ||||||
Consumer staples |
11,193 |
9,885 | ||||||
Oil and gas |
6,352 |
6,362 | ||||||
Financial services |
47,894 |
40,997 | ||||||
Financing products |
27,826 |
18,161 | ||||||
Forest products |
2,452 |
2,200 | ||||||
Governments |
5,716 |
5,816 | ||||||
Industrial products |
15,743 |
15,347 | ||||||
Information technology |
5,875 |
5,788 | ||||||
Investments |
23,842 |
21,454 | ||||||
Mining and metals |
2,715 |
2,757 | ||||||
Public works and infrastructure |
3,246 |
3,325 | ||||||
Real estate and related |
111,132 |
102,885 | ||||||
Other services |
34,096 |
31,758 | ||||||
Telecommunication and media |
9,065 |
7,745 | ||||||
Transportation |
10,440 |
10,450 | ||||||
Utilities |
14,219 |
14,484 | ||||||
Other sectors |
742 |
1,110 | ||||||
Wholesale |
$ |
397,190 |
$ | 360,474 | ||||
Total loans and acceptances |
$ |
1,049,534 |
$ | 987,452 | ||||
Total allowance for credit losses |
(7,093 |
) |
(6,037 | ) | ||||
Total loans and acceptances, net of allowance for credit losses |
$ |
1,042,441 |
$ | 981,415 | ||||
Gross impaired loans by portfolio and geography |
Table 73 | |||
As at October 31 (Millions of Canadian dollars, except for percentage amounts) |
2025 |
2024 | ||||||||||
Residential mortgages |
$ |
1,681 |
$ | 1,233 | ||||||||
Personal |
437 |
408 | ||||||||||
Small business |
411 |
321 | ||||||||||
Retail |
2,529 |
1,962 | ||||||||||
Agriculture |
$ |
283 |
$ | 127 | ||||||||
Automotive |
157 |
263 | ||||||||||
Banking |
30 |
54 | ||||||||||
Consumer discretionary |
555 |
401 | ||||||||||
Consumer staples |
115 |
138 | ||||||||||
Oil and gas |
28 |
9 | ||||||||||
Financial services |
213 |
120 | ||||||||||
Financing products |
324 |
228 | ||||||||||
Forest products |
82 |
147 | ||||||||||
Governments |
31 |
12 | ||||||||||
Industrial products |
271 |
235 | ||||||||||
Information technology |
106 |
74 | ||||||||||
Investments |
63 |
82 | ||||||||||
Mining and metals |
21 |
3 | ||||||||||
Public works and infrastructure |
38 |
11 | ||||||||||
Real estate and related |
1,759 |
1,404 | ||||||||||
Other services |
1,588 |
263 | ||||||||||
Telecommunication and media |
117 |
105 | ||||||||||
Transportation |
303 |
172 | ||||||||||
Utilities |
23 |
30 | ||||||||||
Other sectors |
46 |
27 | ||||||||||
Wholesale (1) |
6,153 |
3,905 | ||||||||||
Total GIL (2) |
$ |
8,682 |
$ | 5,867 | ||||||||
Canada (3) |
||||||||||||
Residential mortgages |
$ |
1,435 |
$ | 1,007 | ||||||||
Personal |
383 |
354 | ||||||||||
Small business |
411 |
321 | ||||||||||
Retail |
2,229 |
1,682 | ||||||||||
Agriculture |
282 |
126 | ||||||||||
Automotive |
155 |
238 | ||||||||||
Banking |
30 |
54 | ||||||||||
Consumer discretionary |
423 |
298 | ||||||||||
Consumer staples |
42 |
67 | ||||||||||
Oil and gas |
28 |
9 | ||||||||||
Financial services |
19 |
24 | ||||||||||
Financing products |
193 |
228 | ||||||||||
Forest products |
82 |
147 | ||||||||||
Governments |
31 |
10 | ||||||||||
Industrial products |
231 |
137 | ||||||||||
Information technology |
53 |
38 | ||||||||||
Investments |
26 |
21 | ||||||||||
Mining and metals |
21 |
3 | ||||||||||
Public works and infrastructure |
32 |
6 | ||||||||||
Real estate and related |
1,101 |
750 | ||||||||||
Other services |
191 |
140 | ||||||||||
Telecommunication and media |
19 |
15 | ||||||||||
Transportation |
282 |
139 | ||||||||||
Utilities |
23 |
– | ||||||||||
Other sectors |
1 |
1 | ||||||||||
Wholesale |
3,265 |
2,451 | ||||||||||
Total |
$ |
5,494 |
$ | 4,133 | ||||||||
U.S. (3) |
||||||||||||
Retail |
$ |
172 |
$ | 125 | ||||||||
Wholesale |
1,096 |
1,165 | ||||||||||
Total |
$ |
1,268 |
$ | 1,290 | ||||||||
Other International (3) |
||||||||||||
Retail |
$ |
128 |
$ | 155 | ||||||||
Wholesale |
1,792 |
289 | ||||||||||
Total |
$ |
1,920 |
$ | 444 | ||||||||
Total GIL |
$ |
8,682 |
$ | 5,867 | ||||||||
Allowance on impaired loans |
(1,986 |
) |
(1,516 | ) | ||||||||
Net impaired loans |
$ |
6,696 |
$ | 4,351 | ||||||||
GIL as a % of loans and acceptances |
||||||||||||
Residential mortgages |
0.34% |
0.26% | ||||||||||
Personal |
0.38% |
0.38% | ||||||||||
Small business |
2.45% |
2.07% | ||||||||||
Retail |
0.39% |
0.31% | ||||||||||
Wholesale |
1.55% |
1.08% | ||||||||||
Total |
0.83% |
0.59% | ||||||||||
Allowance on impaired loans as a % of GIL |
22.88% |
25.85% | ||||||||||
| (1) | Includes $195 million of purchased or originated credit-impaired loans (October 31, 2024 – $109 million). |
| (2) | Past due loans greater than 90 days not included in impaired loans were $330 million in 2025 (2024 – $267 million). For further details, refer to Note 5 of our 2025 Annual Consolidated Financial Statements. |
| (3) | Geographic information is based on residence of borrower. |
Provision for credit losses by portfolio and geography |
Table 74 | |||||
For the year ended October 31 (Millions of Canadian dollars, except for percentage amounts) |
2025 |
2024 | ||||||||||
Residential mortgages |
$ |
141 |
$ | 86 | ||||||||
Personal |
821 |
680 | ||||||||||
Credit cards |
828 |
670 | ||||||||||
Small business |
171 |
150 | ||||||||||
Retail |
1,961 |
1,586 | ||||||||||
Agriculture |
$ |
43 |
$ | 24 | ||||||||
Automotive |
121 |
115 | ||||||||||
Banking |
4 |
33 | ||||||||||
Consumer discretionary |
299 |
97 | ||||||||||
Consumer staples |
62 |
59 | ||||||||||
Oil and gas |
6 |
(51 | ) | |||||||||
Financial services |
47 |
19 | ||||||||||
Financing products |
110 |
40 | ||||||||||
Forest products |
60 |
48 | ||||||||||
Governments |
(7 |
) |
2 | |||||||||
Industrial products |
74 |
68 | ||||||||||
Information technology |
35 |
21 | ||||||||||
Investments |
23 |
3 | ||||||||||
Mining and metals |
14 |
(1 | ) | |||||||||
Public works and infrastructure |
8 |
(6 | ) | |||||||||
Real estate and related |
230 |
403 | ||||||||||
Other services |
427 |
40 | ||||||||||
Telecommunication and media |
80 |
42 | ||||||||||
Transportation |
117 |
63 | ||||||||||
Utilities |
1 |
3 | ||||||||||
Other sectors |
19 |
12 | ||||||||||
Wholesale |
1,773 |
1,034 | ||||||||||
Total PCL on impaired loans |
$ |
3,734 |
$ | 2,620 | ||||||||
Canada (1) |
||||||||||||
Residential mortgages |
$ |
152 |
$ | 96 | ||||||||
Personal |
805 |
672 | ||||||||||
Credit cards |
803 |
653 | ||||||||||
Small business |
171 |
150 | ||||||||||
Retail |
1,931 |
1,571 | ||||||||||
Agriculture |
41 |
24 | ||||||||||
Automotive |
121 |
114 | ||||||||||
Banking |
4 |
36 | ||||||||||
Consumer discretionary |
259 |
86 | ||||||||||
Consumer staples |
13 |
33 | ||||||||||
Oil and gas |
7 |
(4 | ) | |||||||||
Financial services |
5 |
11 | ||||||||||
Financing products |
21 |
40 | ||||||||||
Forest products |
60 |
48 | ||||||||||
Governments |
(6 |
) |
2 | |||||||||
Industrial products |
82 |
61 | ||||||||||
Information technology |
17 |
18 | ||||||||||
Investments |
21 |
1 | ||||||||||
Mining and metals |
14 |
(1 | ) | |||||||||
Public works and infrastructure |
8 |
(6 | ) | |||||||||
Real estate and related |
177 |
116 | ||||||||||
Other services |
112 |
32 | ||||||||||
Telecommunication and media |
8 |
8 | ||||||||||
Transportation |
110 |
44 | ||||||||||
Utilities |
4 |
– | ||||||||||
Other sectors |
8 |
– | ||||||||||
Wholesale |
1,086 |
663 | ||||||||||
Total |
$ |
3,017 |
$ | 2,234 | ||||||||
U.S. (1) |
||||||||||||
Retail |
$ |
52 |
$ | 33 | ||||||||
Wholesale |
225 |
366 | ||||||||||
Total |
$ |
277 |
$ | 399 | ||||||||
Other International (1) |
||||||||||||
Retail |
$ |
(22 |
) |
$ | (19 | ) | ||||||
Wholesale |
462 |
6 | ||||||||||
Total |
$ |
440 |
$ | (13 | ) | |||||||
Total PCL on impaired loans |
$ |
3,734 |
$ | 2,620 | ||||||||
Total PCL on performing loans |
622 |
627 | ||||||||||
Total PCL on other financial assets |
6 |
(15 | ) | |||||||||
Total PCL |
$ |
4,362 |
$ | 3,232 | ||||||||
PCL on loans as a % of average net loans and acceptances |
0.43% |
0.35% | ||||||||||
PCL on impaired loans as a % of average net loans and acceptances (1) |
0.37% |
0.28% | ||||||||||
| (1) | Geographic information is based on residence of borrower. |
Allowance on loans by portfolio and geography (1) |
Table 75 |
As at and for the year ended October 31 (Millions of Canadian dollars, except percentage amounts) |
2025 |
2024 | ||||||||||
Allowance against impaired loans |
||||||||||||
Canada (2) |
||||||||||||
Residential mortgages |
$ |
255 |
$ | 163 | ||||||||
Personal |
205 |
185 | ||||||||||
Small business |
138 |
105 | ||||||||||
Retail |
$ |
598 |
$ | 453 | ||||||||
Agriculture |
$ |
29 |
$ | 26 | ||||||||
Automotive |
141 |
104 | ||||||||||
Banking |
18 |
34 | ||||||||||
Consumer discretionary |
154 |
54 | ||||||||||
Consumer staples |
40 |
40 | ||||||||||
Oil and gas |
7 |
1 | ||||||||||
Financial services |
14 |
11 | ||||||||||
Financing products |
56 |
39 | ||||||||||
Forest products |
16 |
45 | ||||||||||
Governments |
– |
1 | ||||||||||
Industrial products |
77 |
57 | ||||||||||
Information technology |
15 |
15 | ||||||||||
Investments |
24 |
7 | ||||||||||
Mining and metals |
14 |
1 | ||||||||||
Public works and infrastructure |
12 |
5 | ||||||||||
Real estate and related |
172 |
127 | ||||||||||
Other services |
92 |
26 | ||||||||||
Telecommunication and media |
7 |
6 | ||||||||||
Transportation |
30 |
44 | ||||||||||
Utilities |
4 |
– | ||||||||||
Other sectors |
15 |
– | ||||||||||
Wholesale |
$ |
937 |
$ | 643 | ||||||||
Total |
$ |
1,535 |
$ | 1,096 | ||||||||
U.S. (2) |
||||||||||||
Retail |
$ |
23 |
$ | 19 | ||||||||
Wholesale |
160 |
237 | ||||||||||
Total |
$ |
183 |
$ | 256 | ||||||||
Other International (2) |
||||||||||||
Retail |
$ |
65 |
$ | 76 | ||||||||
Wholesale |
203 |
88 | ||||||||||
Total |
$ |
268 |
$ | 164 | ||||||||
Total allowance on impaired loans |
$ |
1,986 |
$ | 1,516 | ||||||||
Allowance on performing loans |
||||||||||||
Residential mortgages |
$ |
480 |
$ | 341 | ||||||||
Personal |
1,406 |
1,272 | ||||||||||
Credit cards |
1,356 |
1,232 | ||||||||||
Small business |
212 |
166 | ||||||||||
Retail |
$ |
3,454 |
$ | 3,011 | ||||||||
Wholesale |
$ |
2,019 |
$ | 1,825 | ||||||||
Total allowance on performing loans |
$ |
5,473 |
$ | 4,836 | ||||||||
Total allowance on loans |
$ |
7,459 |
$ | 6,352 | ||||||||
Key ratios |
||||||||||||
Allowance on loans as a % of loans and acceptances |
0.71% |
0.64% | ||||||||||
Net write-offs as a % of average net loans and acceptances |
0.28% |
0.22% | ||||||||||
| (1) | Includes loans, acceptances and commitments. |
| (2) | Geographic information is based on residence of borrower. |
Credit quality information by Canadian province (1) |
Table 76 |
As at and for the year ended October 31 (Millions of Canadian dollars) |
2025 |
2024 | ||||||||||
Loans and acceptances |
||||||||||||
Atlantic provinces (2) |
$ |
37,937 |
$ | 35,501 | ||||||||
Quebec |
88,665 |
86,426 | ||||||||||
Ontario |
378,521 |
369,949 | ||||||||||
Alberta |
87,758 |
82,860 | ||||||||||
Other Prairie provinces (3) |
40,467 |
38,766 | ||||||||||
B.C. and territories (4) |
148,977 |
144,229 | ||||||||||
Total loans and acceptances in Canada |
$ |
782,325 |
$ | 757,731 | ||||||||
Gross impaired loans |
||||||||||||
Atlantic provinces (2) |
$ |
135 |
$ | 148 | ||||||||
Quebec |
691 |
366 | ||||||||||
Ontario |
2,753 |
2,219 | ||||||||||
Alberta |
706 |
666 | ||||||||||
Other Prairie provinces (3) |
282 |
181 | ||||||||||
B.C. and territories (4) |
927 |
553 | ||||||||||
Total GIL in Canada |
$ |
5,494 |
$ | 4,133 | ||||||||
PCL on impaired loans |
||||||||||||
Atlantic provinces (2) |
$ |
47 |
$ | 46 | ||||||||
Quebec |
270 |
168 | ||||||||||
Ontario |
2,040 |
1,510 | ||||||||||
Alberta |
274 |
217 | ||||||||||
Other Prairie provinces (3) |
121 |
80 | ||||||||||
B.C. and territories (4) |
265 |
213 | ||||||||||
Total PCL on impaired loans in Canada |
$ |
3,017 |
$ | 2,234 | ||||||||
| (1) | Geographic information is based on residence of borrower. |
| (2) | Comprises Newfoundland and Labrador, Prince Edward Island, Nova Scotia and New Brunswick. |
| (3) | Comprises Manitoba and Saskatchewan. |
| (4) | Comprises British Columbia, Nunavut, Northwest Territories and Yukon. |
Glossary |
| • | Adjusted effective income tax rate |
| • | Adjusted income before income taxes |
| • | Adjusted income taxes |
| • | Adjusted net income |
| • | Adjusted net income available to common shareholders |
| • | Adjusted non-interest expensenon-interest expense excluding the impact of specified items and amortization of acquisition-related intangibles. |
| • | Adjusted total revenue |
Enhanced Disclosure Task Force recommendations index |
| Location of disclosure | ||||||||
| Type of Risk |
Recommendation |
Disclosure |
Annual Report page |
SFI page | ||||
| General |
1 | Table of contents for EDTF risk disclosure | 136 | 1 | ||||
| 2 | Define risk terminology and measures | 65-69, 133-135 | – | |||||
| 3 | Top and emerging risks | 69-72 |
– | |||||
| 4 |
New regulatory ratios |
110-116 |
– | |||||
| Risk governance, risk management and business model |
5 |
Risk management organization |
65-69 | – | ||||
| 6 | Risk culture | 65-69 |
– | |||||
| 7 | Risk in the context of our business activities |
120 | – | |||||
| 8 |
Stress testing |
68, 83 |
– | |||||
| Capital adequacy and risk-weighted assets (RWA) |
9 |
Minimum Basel III capital ratios and Domestic systemically important bank surcharge |
110-116 |
– | ||||
| 10 | Composition of capital and reconciliation of the accounting balance sheet to the regulatory balance sheet |
– | * | |||||
| 11 | Flow statement of the movements in regulatory capital |
– | 19 | |||||
| 12 | Capital strategic planning |
110-116 | – | |||||
| 13 | RWA by business segments |
– | 20 | |||||
| 14 | Analysis of capital requirement, and related measurement model information |
72-76 | * | |||||
| 15 | RWA credit risk and related risk measurements |
– | * | |||||
| 16 | Movement of RWA by risk type |
– | 20 | |||||
| 17 |
Basel back-testing |
67, 72-74 |
31 | |||||
| Liquidity |
18 |
Quantitative and qualitative analysis of our liquidity reserve |
90-91, 96-97 |
– | ||||
| Funding |
19 |
Encumbered and unencumbered assets by balance sheet category, and contractual obligations for rating downgrades |
92, 95 |
– | ||||
| 20 | Maturity analysis of consolidated total assets, liabilities and off-balance sheet commitments analyzed by remaining contractual maturity at the balance sheet date |
99-100 | – | |||||
| 21 |
Sources of funding and funding strategy |
92-94 |
– | |||||
| Market risk |
22 |
Relationship between the market risk measures for trading and non-trading portfolios and the balance sheet |
87-88 |
– | ||||
| 23 | Decomposition of market risk factors |
83-88 | – | |||||
| 24 | Market risk validation and back-testing |
83 | – | |||||
| 25 |
Primary risk management techniques beyond reported risk measures and parameters |
83-86 | – | |||||
| Credit risk |
26 |
Bank’s credit risk profile |
72-82, 180-187 |
21-31* | ||||
| Quantitative summary of aggregate credit risk exposures that reconciles to the balance sheet |
127-132 | * | ||||||
| 27 | Policies for identifying impaired loans |
74-76, 122, 153-155 | – | |||||
| 28 | Reconciliation of the opening and closing balances of impaired loans and impairment allowances during the year |
– | 23, 28 | |||||
| 29 | Quantification of gross notional exposure for OTC derivatives or exchange-traded derivatives |
77 | 32 | |||||
| 30 |
Credit risk mitigation, including collateral held for all sources of credit risk |
75-76 | * | |||||
| Other |
31 |
Other risk types |
102-110 |
– | ||||
| 32 |
Publicly known risk events |
107-108, 230-231 |
– | |||||
| * | These disclosure requirements are satisfied or partially satisfied by disclosures provided in our Pillar 3 Report for the quarter ended October 31, 2025 and for the year ended October 31, 2024. |
REPORTS AND CONSOLIDATED FINANCIAL STATEMENTS |
Reports | ||||
138 |
||||
138 |
||||
142 |
Report of Independent Registered Public Accounting Firm (PCAOB ID 271) | |||
Consolidated Financial Statements | ||||
144 |
||||
145 |
||||
146 |
||||
147 |
||||
148 |
||||
Notes to Consolidated Financial Statements | ||||||||
149 |
Note 1 |
|||||||
149 |
Note 2 |
|||||||
163 |
Note 3 |
|||||||
176 |
Note 4 |
|||||||
180 |
Note 5 |
|||||||
187 |
Note 6 |
|||||||
188 |
Note 7 |
|||||||
189 |
Note 8 |
|||||||
193 |
Note 9 |
|||||||
205 |
Note 10 |
|||||||
206 |
Note 11 |
|||||||
208 |
Note 12 |
|||||||
208 |
Note 13 |
|||||||
209 |
Note 14 |
|||||||
210 |
Note 15 |
|||||||
214 |
Note 16 |
|||||||
219 |
Note 17 |
|||||||
219 |
Note 18 |
|||||||
220 |
Note 19 |
|||||||
223 |
Note 20 |
|||||||
225 |
Note 21 |
|||||||
227 |
Note 22 |
|||||||
228 |
Note 23 |
|||||||
230 |
Note 24 |
|||||||
231 |
Note 25 |
|||||||
232 |
Note 26 |
|||||||
235 |
Note 27 |
|||||||
236 |
Note 28 |
|||||||
237 |
Note 29 |
|||||||
238 |
Note 30 |
|||||||
239 |
Note 31 |
|||||||
241 |
Note 32 |
|||||||
Management’s Responsibility for Financial Reporting |
Management’s Report on Internal Control over Financial Reporting |
| • | Pertain to the maintenance of records that, in reasonable detail, accurately and fairly reflect the transactions related to and dispositions of our assets; |
| • | Provide reasonable assurance that transactions are recorded as necessary to permit preparation of financial statements in accordance with generally accepted accounting principles, and our receipts and expenditures are made only in accordance with authorizations of our management and directors; and |
| • | Provide reasonable assurance regarding prevention or timely detection of unauthorized acquisition, use, or disposition of our assets that could have a material effect on our financial statements. |
| Report of Independent Registered Public Accounting Firm |
| Consolidated Balance Sheets |
| As at | ||||||||
(Millions of Canadian dollars) |
October 31 2025 |
October 31 2024 |
||||||
| Assets |
||||||||
| Cash and due from banks |
$ |
37,024 |
$ | 56,723 | ||||
| Interest-bearing deposits with banks |
50,364 |
66,020 | ||||||
Securities (Note 4) |
||||||||
| Trading |
219,067 |
183,300 | ||||||
| Investment, net of applicable allowance |
342,721 |
256,618 | ||||||
561,788 |
439,918 | |||||||
| Assets purchased under reverse repurchase agreements and securities borrowed |
309,683 |
350,803 | ||||||
| Loans (Note 5) |
||||||||
| Retail |
652,344 |
626,978 | ||||||
| Wholesale |
397,171 |
360,439 | ||||||
1,049,515 |
987,417 | |||||||
| Allowance for loan losses (Note 5) |
(7,093 |
) |
(6,037 | ) | ||||
1,042,422 |
981,380 | |||||||
| Other |
||||||||
| Derivatives (Note 9) |
177,206 |
150,612 | ||||||
| Premises and equipment (Note 10) |
6,819 |
6,852 | ||||||
| Goodwill (Note 11) |
19,405 |
19,286 | ||||||
| Other intangibles (Note 11) |
7,402 |
7,798 | ||||||
| Other assets (Note 13) |
112,893 |
92,190 | ||||||
323,725 |
276,738 | |||||||
| Total assets |
$ |
2,325,006 |
$ | 2,171,582 | ||||
| Liabilities and equity |
||||||||
| Deposits (Note 14) |
||||||||
| Personal |
$ |
529,740 |
$ | 522,139 | ||||
| Business and government |
946,314 |
839,670 | ||||||
| Bank |
39,562 |
47,722 | ||||||
1,515,616 |
1,409,531 | |||||||
| Other |
||||||||
| Obligations related to securities sold short |
49,891 |
35,286 | ||||||
| Obligations related to assets sold under repurchase agreements and securities loaned |
289,516 |
305,321 | ||||||
| Derivatives (Note 9) |
183,953 |
163,763 | ||||||
| Insurance contract liabilities (Note 15) |
24,327 |
22,231 | ||||||
| Other liabilities (Note 17) |
108,591 |
94,712 | ||||||
656,278 |
621,313 | |||||||
| Subordinated debentures (Note 18) |
13,961 |
13,546 | ||||||
| Total liabilities |
2,185,855 |
2,044,390 | ||||||
| Equity attributable to shareholders |
||||||||
| Preferred shares and other equity instruments (Note 19) |
11,675 |
9,031 | ||||||
| Common shares (Note 19) |
20,753 |
20,952 | ||||||
| Retained earnings |
96,938 |
88,608 | ||||||
| Other components of equity |
9,726 |
8,498 | ||||||
139,092 |
127,089 | |||||||
| Non-controlling interests |
59 |
103 | ||||||
| Total equity |
139,151 |
127,192 | ||||||
| Total liabilities and equity |
$ |
2,325,006 |
$ | 2,171,582 | ||||
| David I. McKay |
Cynthia Devine | |||
| President and Chief Executive Officer |
Director |
| Consolidated Statements of Income |
| For the year ended |
||||||||
(Millions of Canadian dollars, except per share amounts) |
October 31 2025 |
October 31 2024 |
||||||
| Interest and dividend income (Note 3) |
||||||||
| Loans |
$ |
56,042 |
$ | 54,040 | ||||
| Securities |
20,055 |
17,668 | ||||||
| Assets purchased under reverse repurchase agreements and securities borrowed |
22,367 |
27,121 | ||||||
| Deposits and other |
5,361 |
6,122 | ||||||
103,825 |
104,951 | |||||||
| Interest expense (Note 3) |
||||||||
| Deposits and other |
44,817 |
47,256 | ||||||
| Other liabilities |
25,371 |
28,967 | ||||||
| Subordinated debentures |
637 |
775 | ||||||
70,825 |
76,998 | |||||||
| Net interest income |
33,000 |
27,953 | ||||||
| Non-interest income |
||||||||
| Insurance service result (Note 15) |
867 |
777 | ||||||
| Insurance investment result (Note 15) |
284 |
294 | ||||||
| Trading revenue |
3,125 |
2,327 | ||||||
| Investment management and custodial fees |
10,647 |
9,325 | ||||||
| Mutual fund revenue |
5,084 |
4,437 | ||||||
| Securities brokerage commissions |
1,905 |
1,660 | ||||||
| Service charges |
2,425 |
2,294 | ||||||
| Underwriting and other advisory fees |
2,899 |
2,672 | ||||||
| Foreign exchange revenue, other than trading |
1,301 |
1,142 | ||||||
| Card service revenue |
1,333 |
1,273 | ||||||
| Credit fees |
1,670 |
1,592 | ||||||
| Net gains on investment securities |
120 |
170 | ||||||
| Income (loss) from joint ventures and associates (Note 12) |
73 |
(16 | ) | |||||
| Other |
1,872 |
1,444 | ||||||
33,605 |
29,391 | |||||||
| Total revenue |
66,605 |
57,344 | ||||||
| Provision for credit losses (Notes 4 and 5) |
4,362 |
3,232 | ||||||
| Non-interest expense |
||||||||
| Human resources (Notes 16 and 20) |
23,122 |
21,083 | ||||||
| Equipment |
2,790 |
2,537 | ||||||
| Occupancy |
1,679 |
1,805 | ||||||
| Communications |
1,497 |
1,369 | ||||||
| Professional fees |
2,177 |
2,525 | ||||||
| Amortization of other intangibles (Note 11) |
1,759 |
1,549 | ||||||
| Other |
3,568 |
3,382 | ||||||
36,592 |
34,250 | |||||||
| Income before income taxes |
25,651 |
19,862 | ||||||
| Income taxes (Note 21) |
5,282 |
3,622 | ||||||
| Net income |
$ |
20,369 |
$ | 16,240 | ||||
| Net income attributable to: |
||||||||
| Shareholders |
$ |
20,362 |
$ | 16,230 | ||||
| Non-controlling interests |
7 |
10 | ||||||
$ |
20,369 |
$ | 16,240 | |||||
| Basic earnings per share (in dollars) (Note 22) |
$ |
14.10 |
$ | 11.27 | ||||
| Diluted earnings per share (in dollars) (Note 22) |
14.07 |
11.25 | ||||||
| Dividends per common share (in dollars) |
6.04 |
5.60 | ||||||
| Consolidated Statements of Comprehensive Income |
| For the year ended |
||||||||
(Millions of Canadian dollars) |
October 31 2025 |
October 31 2024 |
||||||
| Net income |
$ |
20,369 |
$ | 16,240 | ||||
| Other comprehensive income (loss), net of taxes (Note 21) |
||||||||
| Items that will be reclassified subsequently to income: |
||||||||
| Net change in unrealized gains (losses) on debt securities and loans at fair value through other comprehensive income |
||||||||
| Net unrealized gains (losses) on debt securities and loans at fair value through other comprehensive income |
758 |
1,104 | ||||||
| Provision for credit losses recognized in income |
(5 |
) |
(1 | ) | ||||
| Reclassification of net losses (gains) on debt securities and loans at fair value through other comprehensive income to income |
(121 |
) |
(140 | ) | ||||
632 |
963 | |||||||
| Foreign currency translation adjustments |
||||||||
| Unrealized foreign currency translation gains (losses) |
826 |
1,029 | ||||||
| Net foreign currency translation gains (losses) from hedging activities |
(315 |
) |
(514 | ) | ||||
| Reclassification of losses (gains) on foreign currency translation to income |
(25 |
) |
– | |||||
| Reclassification of losses (gains) on net investment hedging activities to income |
– |
1 | ||||||
486 |
516 | |||||||
| Net change in cash flow hedges |
||||||||
| Net gains (losses) on derivatives designated as cash flow hedges |
780 |
338 | ||||||
| Reclassification of losses (gains) on derivatives designated as cash flow hedges to income |
(669 |
) |
(827 | ) | ||||
111 |
(489 | ) | ||||||
| Items that will not be reclassified subsequently to income: |
||||||||
| Remeasurement gains (losses) on employee benefit plans (Note 16) |
329 |
531 | ||||||
| Net gains (losses) from fair value changes due to credit risk on financial liabilities designated at fair value through profit or loss |
(894 |
) |
(1,041 | ) | ||||
| Net gains (losses) on equity securities designated at fair value through other comprehensive income |
109 |
117 | ||||||
(456 |
) |
(393 | ) | |||||
| Total other comprehensive income (loss), net of taxes |
773 |
597 | ||||||
| Total comprehensive income (loss) |
$ |
21,142 |
$ | 16,837 | ||||
| Total comprehensive income attributable to: |
||||||||
| Shareholders |
$ |
21,134 |
$ | 16,827 | ||||
| Non-controlling interests |
8 |
10 | ||||||
$ |
21,142 |
$ | 16,837 | |||||
| Consolidated Statements of Changes in Equity |
For the year ended October 31, 2025 |
||||||||||||||||||||||||||||||||||||||||||||||||
| Other components of equity |
||||||||||||||||||||||||||||||||||||||||||||||||
(Millions of Canadian dollars) |
Preferred shares and other equity instruments |
Common shares |
Treasury – preferred shares and other equity instruments |
Treasury – common shares |
Retained earnings |
FVOCI securities and loans |
Foreign currency translation |
Cash flow hedges |
Total other components of equity |
Equity attributable to shareholders |
Non-controlling interests |
Total equity |
||||||||||||||||||||||||||||||||||||
| Balance at beginning of period |
$ |
9,020 |
$ |
21,013 |
$ |
11 |
$ |
(61 |
) |
$ |
88,608 |
$ |
(897 |
) |
$ |
7,128 |
$ |
2,267 |
$ |
8,498 |
$ |
127,089 |
$ |
103 |
$ |
127,192 |
||||||||||||||||||||||
| Changes in equity |
||||||||||||||||||||||||||||||||||||||||||||||||
| Issues of share capital and other equity instruments |
4,973 |
77 |
– |
– |
(28 |
) |
– |
– |
– |
– |
5,022 |
– |
5,022 |
|||||||||||||||||||||||||||||||||||
| Common shares purchased for cancellation |
– |
(227 |
) |
– |
– |
(2,541 |
) |
– |
– |
– |
– |
(2,768 |
) |
– |
(2,768 |
) | ||||||||||||||||||||||||||||||||
| Redemption of preferred shares and other equity instruments |
(2,350 |
) |
– |
– |
– |
– |
– |
– |
– |
– |
(2,350 |
) |
– |
(2,350 |
) | |||||||||||||||||||||||||||||||||
| Sales of treasury shares and other equity instruments |
– |
– |
4,937 |
5,762 |
– |
– |
– |
– |
– |
10,699 |
– |
10,699 |
||||||||||||||||||||||||||||||||||||
| Purchases of treasury shares and other equity instruments |
– |
– |
(4,916 |
) |
(5,811 |
) |
– |
– |
– |
– |
– |
(10,727 |
) |
– |
(10,727 |
) | ||||||||||||||||||||||||||||||||
| Share-based compensation awards |
– |
– |
– |
– |
29 |
– |
– |
– |
– |
29 |
– |
29 |
||||||||||||||||||||||||||||||||||||
| Dividends on common shares |
– |
– |
– |
– |
(8,502 |
) |
– |
– |
– |
– |
(8,502 |
) |
– |
(8,502 |
) | |||||||||||||||||||||||||||||||||
| Dividends on preferred shares and distributions on other equity instruments |
– |
– |
– |
– |
(494 |
) |
– |
– |
– |
– |
(494 |
) |
(52 |
) |
(546 |
) | ||||||||||||||||||||||||||||||||
| Other |
– |
– |
– |
– |
(40 |
) |
– |
– |
– |
– |
(40 |
) |
– |
(40 |
) | |||||||||||||||||||||||||||||||||
| Net income |
– |
– |
– |
– |
20,362 |
– |
– |
– |
– |
20,362 |
7 |
20,369 |
||||||||||||||||||||||||||||||||||||
| Total other comprehensive income (loss), net of taxes |
– |
– |
– |
– |
(456 |
) |
632 |
485 |
111 |
1,228 |
772 |
1 |
773 |
|||||||||||||||||||||||||||||||||||
| Balance at end of period |
$ |
11,643 |
$ |
20,863 |
$ |
32 |
$ |
(110 |
) |
$ |
96,938 |
$ |
(265 |
) |
$ |
7,613 |
$ |
2,378 |
$ |
9,726 |
$ |
139,092 |
$ |
59 |
$ |
139,151 |
||||||||||||||||||||||
| For the year ended October 31, 2024 | ||||||||||||||||||||||||||||||||||||||||||||||||
| Other components of equity |
||||||||||||||||||||||||||||||||||||||||||||||||
| (Millions of Canadian dollars) | Preferred shares and other equity instruments |
Common shares |
Treasury – preferred shares and other equity instruments |
Treasury – common shares |
Retained earnings |
FVOCI securities and loans |
Foreign currency translation |
Cash flow hedges |
Total other components of equity |
Equity attributable to shareholders |
Non-controlling interests |
Total equity |
||||||||||||||||||||||||||||||||||||
| Balance at beginning of period |
$ | 7,323 | $ | 19,398 | $ | (9 | ) | $ | (231 | ) | $ | 81,059 | $ | (1,860 | ) | $ | 6,612 | $ | 2,756 | $ | 7,508 | $ | 115,048 | $ | 99 | $ | 115,147 | |||||||||||||||||||||
| Changes in equity |
||||||||||||||||||||||||||||||||||||||||||||||||
| Issues of share capital and other equity instruments |
2,720 | 1,628 | – | – | (18 | ) | – | – | – | – | 4,330 | – | 4,330 | |||||||||||||||||||||||||||||||||||
| Common shares purchased for cancellation |
– | (13 | ) | – | – | (127 | ) | – | – | – | – | (140 | ) | – | (140 | ) | ||||||||||||||||||||||||||||||||
| Redemption of preferred shares and other equity instruments |
(1,023 | ) | – | – | – | 2 | – | – | – | – | (1,021 | ) | – | (1,021 | ) | |||||||||||||||||||||||||||||||||
| Sales of treasury shares and other equity instruments |
– | – | 1,245 | 5,472 | – | – | – | – | – | 6,717 | – | 6,717 | ||||||||||||||||||||||||||||||||||||
| Purchases of treasury shares and other equity instruments |
– | – | (1,225 | ) | (5,302 | ) | – | – | – | – | – | (6,527 | ) | – | (6,527 | ) | ||||||||||||||||||||||||||||||||
| Share-based compensation awards |
– | – | – | – | 69 | – | – | – | – | 69 | – | 69 | ||||||||||||||||||||||||||||||||||||
| Dividends on common shares |
– | – | – | – | (7,916 | ) | – | – | – | – | (7,916 | ) | – | (7,916 | ) | |||||||||||||||||||||||||||||||||
| Dividends on preferred shares and distributions on other equity instruments |
– | – | – | – | (322 | ) | – | – | – | – | (322 | ) | (6 | ) | (328 | ) | ||||||||||||||||||||||||||||||||
| Other |
– | – | – | – | 24 | – | – | – | – | 24 | – | 24 | ||||||||||||||||||||||||||||||||||||
| Net income |
– | – | – | – | 16,230 | – | – | – | – | 16,230 | 10 | 16,240 | ||||||||||||||||||||||||||||||||||||
| Total other comprehensive income (loss), net of taxes |
– | – | – | – | (393 | ) | 963 | 516 | (489 | ) | 990 | 597 | – | 597 | ||||||||||||||||||||||||||||||||||
| Balance at end of period |
$ | 9,020 | $ | 21,013 | $ | 11 | $ | (61 | ) | $ | 88,608 | $ | (897 | ) | $ | 7,128 | $ | 2,267 | $ | 8,498 | $ | 127,089 | $ | 103 | $ | 127,192 | ||||||||||||||||||||||
| Consolidated Statements of Cash Flows |
| For the year ended |
||||||||
(Millions of Canadian dollars) |
October 31 2025 |
October 31 2024 |
||||||
| Cash flows from operating activities |
||||||||
| Net income |
$ |
20,369 |
$ | 16,240 | ||||
| Adjustments for non-cash items and others |
||||||||
| Provision for credit losses |
4,362 |
3,232 | ||||||
| Depreciation |
1,286 |
1,364 | ||||||
| Deferred income taxes |
(216 |
) |
(1,529 | ) | ||||
| Amortization and impairment of other intangibles |
1,793 |
1,617 | ||||||
| (Income) l oss from joint ventures and associates |
(73 |
) |
16 | |||||
| Losses ( g ains) on investment securities |
(132 |
) |
(170 | ) | ||||
| Losses ( g ains) on disposition of business |
– |
29 | ||||||
| Adjustments for net changes in operating assets and liabilities |
||||||||
| Insurance contract liabilities |
2,096 |
3,205 | ||||||
| Net change in accrued interest receivable and payable |
(1,880 |
) |
1,674 | |||||
| Current income taxes |
(936 |
) |
945 | |||||
| Derivative assets |
(26,594 |
) |
(4,797 | ) | ||||
| Derivative liabilities |
20,190 |
17,593 | ||||||
| Trading securities |
(35,767 |
) |
8,886 | |||||
| Loans |
(62,098 |
) |
(55,007 | ) | ||||
| Assets purchased under reverse repurchase agreements and securities borrowed |
41,120 |
(10,168 | ) | |||||
| Obligations related to assets sold under repurchase agreements and securities loaned |
(15,805 |
) |
(35,581 | ) | ||||
| Obligations related to securities sold short |
14,605 |
727 | ||||||
| Deposits |
106,085 |
91,596 | ||||||
| Brokers and dealers receivable and payable |
(107 |
) |
(304 | ) | ||||
| Other |
(13,078 |
) |
(16,429 | ) | ||||
| Net cash from (used in) operating activities |
55,220 |
23,139 | ||||||
| Cash flows from investing activities |
||||||||
| Change in interest-bearing deposits with banks |
15,656 |
5,066 | ||||||
| Proceeds from sales and maturities of investment securities |
232,439 |
182,335 | ||||||
| Purchases of investment securities |
(314,421 |
) |
(193,307 | ) | ||||
| Net acquisitions of premises and equipment and other intangibles |
(2,243 |
) |
(2,280 | ) | ||||
| Net proceeds from (cash transferred for) dispositions |
– |
15 | ||||||
| Cash used in acquisitions, net of cash acquired |
– |
(12,716 | ) | |||||
| Net cash from (used in) investing activities |
(68,569 |
) |
(20,887 | ) | ||||
| Cash flows from financing activities |
||||||||
| Issuance of subordinated debentures |
2,991 |
3,250 | ||||||
| Repayment of subordinated debentures |
(2,750 |
) |
(1,500 | ) | ||||
| Issue of common shares, net of issuance costs |
72 |
159 | ||||||
| Common shares purchased for cancellation |
(2,768 |
) |
(140 | ) | ||||
| Issue of preferred shares and other equity instruments, net of issuance costs |
4,945 |
2,702 | ||||||
| Redemption of preferred shares and other equity instruments |
(2,350 |
) |
(1,021 | ) | ||||
| Sales of treasury shares and other equity instruments |
10,699 |
6,717 | ||||||
| Purchases of treasury shares and other equity instruments |
(10,727 |
) |
(6,527 | ) | ||||
| Dividends paid on shares and distributions paid on other equity instruments |
(8,800 |
) |
(6,637 | ) | ||||
| Dividends/distributions paid to non-controlling interests |
(39 |
) |
(6 | ) | ||||
| Change in short-term borrowings of subsidiaries |
2,804 |
(4,507 | ) | |||||
| Repayment of lease liabilities |
(788 |
) |
(636 | ) | ||||
| Net cash from (used in) financing activities |
(6,711 |
) |
(8,146 | ) | ||||
| Effect of exchange rate changes on cash and due from banks |
361 |
628 | ||||||
| Net change in cash and due from banks |
(19,699 |
) |
(5,266 | ) | ||||
| Cash and due from banks at beginning of period (1) |
56,723 |
61,989 | ||||||
| Cash and due from banks at end of period (1) |
$ |
37,024 |
$ | 56,723 | ||||
| Cash flows from operating activities include: |
||||||||
| Amount of interest paid |
$ |
70,976 |
$ | 73,639 | ||||
| Amount of interest received |
100,508 |
102,127 | ||||||
| Amount of dividends received |
3,982 |
3,502 | ||||||
| Amount of income taxes paid |
6,087 |
3,410 | ||||||
| (1) | We are required to maintain balances due to regulatory requirements or contractual restrictions from central banks, other regulatory authorities, and other counterparties. The total balances were $ 3 billion as at October 31, 2025 (October 31, 2024 – $2 billion; October 31, 2023 – $3 billion). |
| Note 1 General information |
| Note 2 Summary of material accounting policies, estimates and judgments |
| Consolidation of structured entities | Note 2 Note 8 |
Goodwill and other intangibles | Note 2 Note 11 | |||
| Fair value of financial instruments | Note 2 Note 3 |
Application of the effective interest method | Note 2 | |||
| Allowance for credit losses | Note 2 Note 4 Note 5 |
Derecognition of financial assets | Note 2 Note 7 | |||
| Insurance and reinsurance contracts | Note 2 Note 15 |
Income taxes | Note 2 Note 21 | |||
| Employee benefits | Note 2 Note 16 |
Provisions | Note 2 Note 23 Note 24 | |||
| Note 2 Summary of material accounting policies, estimates and judgments (continued) |
| • | How the economic activities of our businesses generate benefits, for example through trading revenue, enhancing yields or hedging funding or other costs and how such economic activities are evaluated and reported to key management personnel; |
| • | The significant risks affecting the performance of our businesses, for example, market risk, credit risk, or other risks as described in the Risk Management section of the MD&A, and the activities undertaken to manage those risks; |
| • | Historical and future expectations of sales of the loans or securities portfolios managed as part of a business model; and |
| • | The compensation structures for managers of our businesses, to the extent that these are directly linked to the economic performance of the business model. |
| • | HTC: The objective of this business model is to hold loans and securities to collect contractual principal and interest cash flows. Sales are incidental to this objective and are expected to be insignificant or infrequent. |
| • | HTC&S: Both collecting contractual cash flows and sales are integral to achieving the objective of the business model. |
| • | Other fair value business models: These business models are neither HTC nor HTC&S, and primarily represent business models where assets are held-for-trading |
Note 2 Summary of material accounting policies, estimates and judgments (continued) |
| • | Performing financial assets |
| • | Stage 1 – From initial recognition of a financial asset to the date on which the asset has experienced a significant increase in credit risk relative to its initial recognition, a loss allowance is recognized equal to the credit losses expected to result from defaults occurring over the 12 months following the reporting date. |
| • | Stage 2 – Following a significant increase in credit risk relative to the initial recognition of the financial asset, a loss allowance is recognized equal to the credit losses expected over the remaining lifetime of the asset. |
| • | Impaired financial assets |
| • | Stage 3 – When a financial asset is considered to be credit-impaired, a loss allowance is recognized equal to credit losses expected over the remaining lifetime of the asset. Interest income is calculated based on the carrying amount of the asset, net of the loss allowance, rather than on its gross carrying amount. |
Note 2 Summary of material accounting policies, estimates and judgments (continued) |
| (1) | We have established thresholds for significant increases in credit risk based on both a percentage and absolute change in lifetime PD relative to initial recognition. For our wholesale portfolio, a decrease in the borrower’s risk rating is also required to determine that credit risk has increased significantly. |
| (2) | Additional qualitative reviews may be performed, as necessary, to assess the staging results, which may lead to adjustments to better reflect the positions whose credit risk has increased significantly. These reviews are completed at both the individual borrower levels and the portfolio level and may result in an instrument, a portfolio or a portion of a portfolio moving from Stage 1 to Stage 2. |
| (3) | Instruments which are 30 days past due are generally considered to have experienced a significant increase in credit risk, even if our other metrics do not indicate that a significant increase in credit risk has occurred. |
Note 2 Summary of material accounting policies, estimates and judgments (continued) |
| Note 2 Summary of material accounting policies, estimates and judgments (continued) |
• |
For insurance contracts with direct participating features (applicable primarily to our segregated fund insurance contracts), the variable fee approach (VFA) is applied. |
• |
For insurance contracts and reinsurance contracts held with a short duration of one year or less (applicable primarily to our creditor reinsurance contracts issued, group life and health insurance contracts and travel insurance contracts), the premium allocation approach (PAA) is applied. |
• |
The general measurement method (GMM) is applied to all remaining contracts. |
• |
Insurance revenue is recognized as we provide insurance contract services under the groups of insurance contracts. For contracts measured using the PAA, the insurance revenue is generally recognized based on allocating expected premium receipts over the passage of time. For contracts measured using the GMM and VFA, insurance revenue represents the amount of consideration we expect to be entitled to in exchange for services in the period, which includes expected claims and expenses directly attributable to fulfilling insurance contracts (excluding any investment components), release of the risk adjustment for the period, CSM amortization to reflect services provided in the period, an allocation of premiums that relates to recovering insurance acquisition expenses and experience adjustments for premium receipts relating to current or past services. |
• |
Insurance service expense arising from insurance contracts includes incurred claims and other directly attributable expenses in the current period (excluding investment components), amortization and impairment losses relating to insurance acquisition cash flows where applicable, changes relating to past or current services and changes in loss components of onerous groups of contracts. |
• |
Net income (expense) from reinsurance contracts held represents the amounts recovered from the reinsurers less the allocation of premiums paid on reinsurance contracts held. |
| • | Net investment income primarily comprises interest and dividend income and net gains (losses) on financial instruments, including segregated fund assets, and derivatives relating to the Insurance segment. Financial assets supporting the Insurance segment are primarily measured at FVTPL and FVOCI. |
| • | Insurance and reinsurance finance income (expense) represents the net effect of and changes in the time value of money (including the time value of money relating to risk adjustment on non-financial risks) and financial risks on insurance contracts and reinsurance contracts held, respectively. |
Note 2 Summary of material accounting policies, estimates and judgments (continued) |
| Note 2 Summary of material accounting policies, estimates and judgments (continued) |
Note 3 Fair value of financial instruments |
As at October 31, 2025 |
||||||||||||||||||||||||||||||||||||
Carrying value and fair value |
Carrying value |
Fair value |
||||||||||||||||||||||||||||||||||
(Millions of Canadian dollars) |
Financial instruments classified as FVTPL |
Financial instruments designated as FVTPL |
Financial instruments classified as FVOCI |
Financial instruments designated as FVOCI |
Financial instruments measured at amortized cost |
Financial instruments measured at amortized cost |
Total carrying amount |
Total fair value |
||||||||||||||||||||||||||||
Financial assets |
||||||||||||||||||||||||||||||||||||
Interest-bearing deposits with banks |
$ |
– |
$ |
40,455 |
$ |
– |
$ |
– |
$ |
9,909 |
$ |
9,909 |
$ |
50,364 |
$ |
50,364 |
||||||||||||||||||||
Securities |
||||||||||||||||||||||||||||||||||||
Trading |
212,878 |
6,189 |
– |
– |
– |
– |
219,067 |
219,067 |
||||||||||||||||||||||||||||
Investment, net of applicable allowance |
– |
– |
240,299 |
1,496 |
100,926 |
98,728 |
342,721 |
340,523 |
||||||||||||||||||||||||||||
212,878 |
6,189 |
240,299 |
1,496 |
100,926 |
98,728 |
561,788 |
559,590 |
|||||||||||||||||||||||||||||
Assets purchased under reverse repurchase agreements and securities borrowed |
226,213 |
– |
– |
– |
83,470 |
83,470 |
309,683 |
309,683 |
||||||||||||||||||||||||||||
Loans, net of applicable allowance |
||||||||||||||||||||||||||||||||||||
Retail |
1,128 |
– |
442 |
– |
646,832 |
648,413 |
648,402 |
649,983 |
||||||||||||||||||||||||||||
Wholesale |
9,724 |
– |
690 |
– |
383,606 |
382,551 |
394,020 |
392,965 |
||||||||||||||||||||||||||||
10,852 |
– |
1,132 |
– |
1,030,438 |
1,030,964 |
1,042,422 |
1,042,948 |
|||||||||||||||||||||||||||||
Other |
||||||||||||||||||||||||||||||||||||
Derivatives |
177,206 |
– |
– |
– |
– |
– |
177,206 |
177,206 |
||||||||||||||||||||||||||||
Other assets (1) |
14,382 |
– |
– |
– |
58,487 |
58,487 |
72,869 |
72,869 |
||||||||||||||||||||||||||||
Financial liabilities |
||||||||||||||||||||||||||||||||||||
Deposits |
||||||||||||||||||||||||||||||||||||
Personal |
$ |
942 |
$ |
41,302 |
$ |
487,496 |
$ |
488,644 |
$ |
529,740 |
$ |
530,888 |
||||||||||||||||||||||||
Business and government (2) |
313 |
168,690 |
777,311 |
779,130 |
946,314 |
948,133 |
||||||||||||||||||||||||||||||
Bank (3) |
– |
2,908 |
36,654 |
36,657 |
39,562 |
39,565 |
||||||||||||||||||||||||||||||
1,255 |
212,900 |
1,301,461 |
1,304,431 |
1,515,616 |
1,518,586 |
|||||||||||||||||||||||||||||||
Other |
||||||||||||||||||||||||||||||||||||
Obligations related to securities sold short |
49,891 |
– |
– |
– |
49,891 |
49,891 |
||||||||||||||||||||||||||||||
Obligations related to assets sold under repurchase agreements and securities loaned |
– |
242,916 |
46,600 |
46,600 |
289,516 |
289,516 |
||||||||||||||||||||||||||||||
Derivatives |
183,953 |
– |
– |
– |
183,953 |
183,953 |
||||||||||||||||||||||||||||||
Other liabilities (4) |
– |
21,688 |
58,287 |
58,293 |
79,975 |
79,981 |
||||||||||||||||||||||||||||||
Subordinated debentures |
– |
232 |
13,729 |
13,887 |
13,961 |
14,119 |
||||||||||||||||||||||||||||||
Note 3 Fair value of financial instruments (continued) |
| As at October 31, 2024 | ||||||||||||||||||||||||||||||||||||
| Carrying value and fair value | Carrying value | Fair value | ||||||||||||||||||||||||||||||||||
| (Millions of Canadian dollars) | Financial instruments classified as FVTPL |
Financial instruments designated as FVTPL |
Financial instruments classified as FVOCI |
Financial instruments designated as FVOCI |
Financial instruments measured at amortized cost |
Financial instruments measured at amortized cost |
Total carrying amount |
Total fair value |
||||||||||||||||||||||||||||
Financial assets |
||||||||||||||||||||||||||||||||||||
Interest-bearing deposits with banks |
$ | – | $ | 53,996 | $ | – | $ | – | $ | 12,024 | $ | 12,024 | $ | 66,020 | $ | 66,020 | ||||||||||||||||||||
Securities |
||||||||||||||||||||||||||||||||||||
Trading |
182,346 | 954 | – | – | – | – | 183,300 | 183,300 | ||||||||||||||||||||||||||||
Investment, net of applicable allowance |
– | – | 155,118 | 1,242 | 100,258 | 96,336 | 256,618 | 252,696 | ||||||||||||||||||||||||||||
| 182,346 | 954 | 155,118 | 1,242 | 100,258 | 96,336 | 439,918 | 435,996 | |||||||||||||||||||||||||||||
Assets purchased under reverse repurchase agreements and securities borrowed |
284,311 | – | – | – | 66,492 | 66,492 | 350,803 | 350,803 | ||||||||||||||||||||||||||||
Loans, net of applicable allowance |
||||||||||||||||||||||||||||||||||||
Retail |
915 | – | 580 | – | 622,098 | 619,320 | 623,593 | 620,815 | ||||||||||||||||||||||||||||
Wholesale |
6,177 | 2,030 | 1,003 | – | 348,577 | 345,561 | 357,787 | 354,771 | ||||||||||||||||||||||||||||
| 7,092 | 2,030 | 1,583 | – | 970,675 | 964,881 | 981,380 | 975,586 | |||||||||||||||||||||||||||||
Other |
||||||||||||||||||||||||||||||||||||
Derivatives |
150,612 | – | – | – | – | – | 150,612 | 150,612 | ||||||||||||||||||||||||||||
Other assets (1) |
11,770 | – | – | – | 50,093 | 50,093 | 61,863 | 61,863 | ||||||||||||||||||||||||||||
Financial liabilities |
||||||||||||||||||||||||||||||||||||
Deposits |
||||||||||||||||||||||||||||||||||||
Personal |
$ | 508 | $ | 33,799 | $ | 487,832 | $ | 490,170 | $ | 522,139 | $ | 524,477 | ||||||||||||||||||||||||
Business and government (2) |
191 | 156,238 | 683,241 | 684,748 | 839,670 | 841,177 | ||||||||||||||||||||||||||||||
Bank (3) |
– | 10,530 | 37,192 | 37,183 | 47,722 | 47,713 | ||||||||||||||||||||||||||||||
| 699 | 200,567 | 1,208,265 | 1,212,101 | 1,409,531 | 1,413,367 | |||||||||||||||||||||||||||||||
Other |
||||||||||||||||||||||||||||||||||||
Obligations related to securities sold short |
35,286 | – | – | – | 35,286 | 35,286 | ||||||||||||||||||||||||||||||
Obligations related to assets sold under repurchase agreements and securities loaned |
– | 270,663 | 34,658 | 34,658 | 305,321 | 305,321 | ||||||||||||||||||||||||||||||
Derivatives |
163,763 | – | – | – | 163,763 | 163,763 | ||||||||||||||||||||||||||||||
Other liabilities (4) |
(1,407 | ) | – | 69,597 | 69,850 | 68,190 | 68,443 | |||||||||||||||||||||||||||||
Subordinated debentures |
– | – | 13,546 | 13,602 | 13,546 | 13,602 | ||||||||||||||||||||||||||||||
| (1) | Includes financial instruments recognized in Other assets. |
| (2) | Business and government deposits include deposits from regulated deposit-taking institutions other than banks. |
| (3) | Bank deposits refer to deposits from regulated banks and central banks. |
| (4) | Includes financial instruments recognized in Other liabilities. |
As at or for the year ended October 31, 2025 (1) |
||||||||||||||||||||
Contractual maturity amount (2) |
Carrying value |
Difference between carrying value and contractual maturity amount |
Changes in fair value attributable to changes in credit risk included in OCI for positions still held |
|||||||||||||||||
(Millions of Canadian dollars) |
During the period |
Cumulative (3) |
||||||||||||||||||
Term deposits |
||||||||||||||||||||
Personal |
$ |
40,965 |
$ |
41,302 |
$ |
337 |
$ |
72 |
$ |
229 |
||||||||||
Business and government (4) |
174,268 |
168,690 |
(5,578 |
) |
744 |
926 |
||||||||||||||
Bank (5) |
2,903 |
2,908 |
5 |
– |
– |
|||||||||||||||
218,136 |
212,900 |
(5,236 |
) |
816 |
1,155 |
|||||||||||||||
Other |
||||||||||||||||||||
Obligations related to assets sold under repurchase agreements and securities loaned |
242,931 |
242,916 |
(15 |
) |
– |
– |
||||||||||||||
Other liabilities |
26,925 |
21,688 |
(5,237 |
) |
401 |
401 |
||||||||||||||
Subordinated debentures |
236 |
232 |
(4 |
) |
– |
– |
||||||||||||||
$ |
488,228 |
$ |
477,736 |
$ |
(10,492 |
) |
$ |
1,217 |
$ |
1,556 |
||||||||||
As at or for the year ended October 31, 2024 (1) |
||||||||||||||||||||
| Contractual maturity amount |
Carrying value |
Difference between carrying value and contractual maturity amount |
Changes in fair value attributable to changes in credit risk included in OCI for positions still held |
|||||||||||||||||
(Millions of Canadian dollars) |
During the period |
Cumulative (3) |
||||||||||||||||||
| Term deposits |
||||||||||||||||||||
| Personal |
$ | 33,552 | $ | 33,799 | $ | 247 | $ | 221 | $ | 163 | ||||||||||
| Business and government (4) |
162,648 | 156,238 | (6,410 | ) | 1,204 | 177 | ||||||||||||||
| Bank (5) |
10,520 | 10,530 | 10 | – | – | |||||||||||||||
| 206,720 | 200,567 | (6,153 | ) | 1,425 | 340 | |||||||||||||||
| Other |
||||||||||||||||||||
| Obligations related to assets sold under repurchase agreements and securities loaned |
270,625 | 270,663 | 38 | – | – | |||||||||||||||
| Other liabilities |
– | – | – | – | – | |||||||||||||||
| Subordinated debentures |
– | – | – | – | – | |||||||||||||||
| $ | 477,345 | $ | 471,230 | $ | (6,115 | ) | $ | 1,425 | $ | 340 | ||||||||||
(1) |
$5 million in changes in fair value attributable to changes in credit risk were recognized in income for the year ended October 31, 2025, and $17 million in cumulative changes in credit risk were included in income for positions still held life-to-date |
(2) |
Reflects the contractual undiscounted amounts due at payment dates for these financial instruments. These amounts do not reconcile directly with their associated carrying values as these amounts incorporate only undiscounted amounts due at payment dates and do not recognize premiums, discounts, expectations of early redemptions or mark-to-market adjustments that are recognized in the instruments’ carrying values as at the balance sheet date. |
(3) |
The cumulative change is measured from the initial designation of the liabilities as FVTPL. For the year ended October 31, 2025, $19 million of fair value gains previously included in OCI relate to financial liabilities derecognized during the year (October 31, 2024 – $15 million of fair value gains). |
(4) |
Business and government term deposits include amounts from regulated deposit-taking institutions other than regulated banks. |
(5) |
Bank term deposits refer to amounts from regulated banks and central banks. |
| For the year ended | ||||||||||
(Millions of Canadian dollars) |
October 31 2025 |
October 31 2024 |
||||||||
| Net gains (losses) (1) |
||||||||||
| Classified as fair value through profit or loss (2) |
$ |
6,689 |
$ | 8,996 | ||||||
| Designated as fair value through profit or loss (3) |
(2,547 |
) |
(5,847 | ) | ||||||
$ |
4,142 |
$ | 3,149 | |||||||
| By product line (1) |
||||||||||
| Interest rate and credit (4) |
$ |
2,556 |
$ | 2,580 | ||||||
| Equities |
764 |
389 | ||||||||
| Foreign exchange and commodities |
822 |
180 | ||||||||
$ |
4,142 |
$ | 3,149 | |||||||
| (1) | Excludes net gains from financial instruments classified as FVTPL of $ 395 million (October 31, 2024 – net gains of $2,251 million for financial instruments classified or designated as FVTPL) presented in Insurance investment result in the Consolidated Statements of Income. |
| (2) | Excludes derivatives designated in a hedging relationship. Refer to Note 9 for net gains (losses) on these derivatives. |
(3) |
For the year ended October 31, 2025, $2,555 million of net fair value losses on financial liabilities designated as FVTPL, other than those attributable to changes in our own credit risk, were included in Non-interest income (October 31, 2024 – losses of $5,838 million). |
| (4) | Includes gains (losses) recognized on cross currency interest rate swaps. |
| For the year ended | ||||||||||
(Millions of Canadian dollars) |
October 31 2025 |
October 31 2024 |
||||||||
| Interest and dividend income (1), (2) |
||||||||||
| Financial instruments measured at fair value through profit or loss |
$ |
30,502 |
$ | 35,550 | ||||||
| Financial instruments measured at fair value through other comprehensive income |
8,778 |
7,109 | ||||||||
| Financial instruments measured at amortized cost |
64,545 |
62,292 | ||||||||
103,825 |
104,951 | |||||||||
| Interest expense (1) |
||||||||||
| Financial instruments measured at fair value through profit or loss |
$ |
30,642 |
$ | 34,150 | ||||||
| Financial instruments measured at amortized cost |
40,183 |
42,848 | ||||||||
70,825 |
76,998 | |||||||||
| Net interest income |
$ |
33,000 |
$ | 27,953 | ||||||
| (1) | Excludes interest and dividend income for the year end October 31, 2025 of $1,244 million (October 31, 2024 – $958 million) and interest expense of $226 million (October 31, 2024 – $120 million) presented in Insurance investment result in the Consolidated Statements of Income. |
| (2) | Includes dividend income for the year ended October 31, 2025 of $3,803 million (October 31, 2024 – $3,319 million), which is presented in Interest and dividend income in the Consolidated Statements of Income. |
| Note 3 Fair value of financial instruments (continued) |
| As at |
||||||||||||||||||||||||||||||||||||||||||
| October 31, 2025 |
October 31, 2024 |
|||||||||||||||||||||||||||||||||||||||||
Fair value measurements using |
Netting adjustments |
Fair value |
Fair value measurements using |
Netting adjustments |
Fair value |
|||||||||||||||||||||||||||||||||||||
| (Millions of Canadian dollars) |
Level 1 |
Level 2 |
Level 3 |
Level 1 | Level 2 | Level 3 | ||||||||||||||||||||||||||||||||||||
| Financial assets |
||||||||||||||||||||||||||||||||||||||||||
| Interest-bearing deposits with banks |
$ |
– |
$ |
40,455 |
$ |
– |
$ |
$ |
40,455 |
$ | – | $ | 53,996 | $ | – | $ | $ | 53,996 | ||||||||||||||||||||||||
| Securities |
||||||||||||||||||||||||||||||||||||||||||
| Trading |
||||||||||||||||||||||||||||||||||||||||||
| Debt issued or guaranteed by: |
||||||||||||||||||||||||||||||||||||||||||
| Canadian government |
||||||||||||||||||||||||||||||||||||||||||
| Federal |
17,707 |
2,864 |
– |
20,571 |
11,611 | 2,173 | – | 13,784 | ||||||||||||||||||||||||||||||||||
| Provincial and municipal |
– |
16,891 |
– |
16,891 |
– | 16,588 | – | 16,588 | ||||||||||||||||||||||||||||||||||
| U.S. federal, state, municipal and agencies (1) |
435 |
40,322 |
– |
40,757 |
1,852 | 29,136 | – | 30,988 | ||||||||||||||||||||||||||||||||||
| Other OECD government (2) |
7,152 |
7,265 |
– |
14,417 |
2,481 | 2,153 | – | 4,634 | ||||||||||||||||||||||||||||||||||
| Mortgage-backed securities |
– |
74 |
– |
74 |
– | 3 | – | 3 | ||||||||||||||||||||||||||||||||||
| Asset-backed securities |
– |
1,295 |
– |
1,295 |
– | 1,434 | – | 1,434 | ||||||||||||||||||||||||||||||||||
| Corporate debt and other debt |
– |
25,957 |
32 |
25,989 |
– | 26,195 | – | 26,195 | ||||||||||||||||||||||||||||||||||
| Equities |
93,397 |
2,813 |
2,863 |
99,073 |
84,814 | 2,316 | 2,544 | 89,674 | ||||||||||||||||||||||||||||||||||
118,691 |
97,481 |
2,895 |
219,067 |
100,758 | 79,998 | 2,544 | 183,300 | |||||||||||||||||||||||||||||||||||
| Investment |
||||||||||||||||||||||||||||||||||||||||||
| Debt issued or guaranteed by: |
||||||||||||||||||||||||||||||||||||||||||
| Canadian government |
||||||||||||||||||||||||||||||||||||||||||
| Federal |
30,110 |
9,756 |
– |
39,866 |
4,623 | 8,546 | – | 13,169 | ||||||||||||||||||||||||||||||||||
| Provincial and municipal |
– |
11,318 |
– |
11,318 |
– | 7,554 | – | 7,554 | ||||||||||||||||||||||||||||||||||
| U.S. federal, state, municipal and agencies (1) |
196 |
130,495 |
– |
130,691 |
42 | 80,224 | – | 80,266 | ||||||||||||||||||||||||||||||||||
| Other OECD government (2) |
1,600 |
10,333 |
– |
11,933 |
2,370 | 7,786 | – | 10,156 | ||||||||||||||||||||||||||||||||||
| Mortgage-backed securities |
– |
2,645 |
29 |
2,674 |
– | 2,603 | 31 | 2,634 | ||||||||||||||||||||||||||||||||||
| Asset-backed securities |
– |
10,139 |
– |
10,139 |
– | 9,357 | – | 9,357 | ||||||||||||||||||||||||||||||||||
| Corporate debt and other debt |
– |
33,544 |
134 |
33,678 |
– | 31,839 | 143 | 31,982 | ||||||||||||||||||||||||||||||||||
| Equities |
547 |
367 |
582 |
1,496 |
432 | 304 | 506 | 1,242 | ||||||||||||||||||||||||||||||||||
32,453 |
208,597 |
745 |
241,795 |
7,467 | 148,213 | 680 | 156,360 | |||||||||||||||||||||||||||||||||||
| Assets purchased under reverse repurchase agreements and securities borrowed |
– |
226,213 |
– |
226,213 |
– | 284,311 | – | 284,311 | ||||||||||||||||||||||||||||||||||
| Loans |
– |
10,710 |
1,274 |
11,984 |
– | 8,924 | 1,781 | 10,705 | ||||||||||||||||||||||||||||||||||
| Other |
||||||||||||||||||||||||||||||||||||||||||
| Derivatives |
||||||||||||||||||||||||||||||||||||||||||
| Interest rate contracts |
– |
25,871 |
293 |
26,164 |
– | 27,719 | 354 | 28,073 | ||||||||||||||||||||||||||||||||||
| Foreign exchange contracts |
– |
100,604 |
102 |
100,706 |
– | 98,480 | 3 | 98,483 | ||||||||||||||||||||||||||||||||||
| Credit derivatives |
– |
350 |
2 |
352 |
– | 273 | – | 273 | ||||||||||||||||||||||||||||||||||
| Other contracts |
11,478 |
41,543 |
110 |
53,131 |
2,553 | 23,830 | 21 | 26,404 | ||||||||||||||||||||||||||||||||||
| Valuation adjustments |
– |
(1,035 |
) |
(45 |
) |
(1,080 |
) |
– | (1,067 | ) | 14 | (1,053 | ) | |||||||||||||||||||||||||||||
| Total gross derivatives |
11,478 |
167,333 |
462 |
179,273 |
2,553 | 149,235 | 392 | 152,180 | ||||||||||||||||||||||||||||||||||
| Netting adjustments |
(2,067 |
) |
(2,067 |
) |
(1,568 | ) | (1,568 | ) | ||||||||||||||||||||||||||||||||||
| Total derivatives |
177,206 |
150,612 | ||||||||||||||||||||||||||||||||||||||||
| Other assets |
6,108 |
8,270 |
4 |
14,382 |
5,291 | 6,472 | 7 | 11,770 | ||||||||||||||||||||||||||||||||||
$ |
168,730 |
$ |
759,059 |
$ |
5,380 |
$ |
(2,067 |
) |
$ |
931,102 |
$ | 116,069 | $ | 731,149 | $ | 5,404 | $ | (1,568 | ) | $ | 851,054 | |||||||||||||||||||||
| Financial liabilities |
||||||||||||||||||||||||||||||||||||||||||
| Deposits |
||||||||||||||||||||||||||||||||||||||||||
| Personal |
$ |
– |
$ |
41,943 |
$ |
301 |
$ |
$ |
42,244 |
$ | – | $ | 33,829 | $ | 478 | $ | $ | 34,307 | ||||||||||||||||||||||||
| Business and government |
– |
169,003 |
– |
169,003 |
– | 156,429 | – | 156,429 | ||||||||||||||||||||||||||||||||||
| Bank |
– |
2,908 |
– |
2,908 |
– | 10,530 | – | 10,530 | ||||||||||||||||||||||||||||||||||
| Other |
||||||||||||||||||||||||||||||||||||||||||
| Obligations related to securities sold short |
18,678 |
31,213 |
– |
49,891 |
15,172 | 20,114 | – | 35,286 | ||||||||||||||||||||||||||||||||||
| Obligations related to assets sold under repurchase agreements and securities loaned |
– |
242,916 |
– |
242,916 |
– | 270,663 | – | 270,663 | ||||||||||||||||||||||||||||||||||
| Derivatives |
||||||||||||||||||||||||||||||||||||||||||
| Interest rate contracts |
– |
20,679 |
901 |
21,580 |
– | 24,852 | 847 | 25,699 | ||||||||||||||||||||||||||||||||||
| Foreign exchange contracts |
– |
95,045 |
46 |
95,091 |
– | 93,164 | 54 | 93,218 | ||||||||||||||||||||||||||||||||||
| Credit derivatives |
– |
262 |
– |
262 |
– | 218 | – | 218 | ||||||||||||||||||||||||||||||||||
| Other contracts |
12,657 |
56,287 |
366 |
69,310 |
3,212 | 42,961 | 324 | 46,497 | ||||||||||||||||||||||||||||||||||
| Valuation adjustments |
– |
(257 |
) |
34 |
(223 |
) |
– | (297 | ) | (4 | ) | (301 | ) | |||||||||||||||||||||||||||||
| Total gross derivatives |
12,657 |
172,016 |
1,347 |
186,020 |
3,212 | 160,898 | 1,221 | 165,331 | ||||||||||||||||||||||||||||||||||
| Netting adjustments |
(2,067 |
) |
(2,067 |
) |
(1,568 | ) | (1,568 | ) | ||||||||||||||||||||||||||||||||||
| Total derivatives |
183,953 |
163,763 | ||||||||||||||||||||||||||||||||||||||||
| Other liabilities |
– |
21,688 |
– |
21,688 |
287 | (1,694 | ) | – | (1,407 | ) | ||||||||||||||||||||||||||||||||
| Subordinated debentures |
– |
232 |
– |
232 |
– | – | – | – | ||||||||||||||||||||||||||||||||||
$ |
31,335 |
$ |
681,919 |
$ |
1,648 |
$ |
(2,067 |
) |
$ |
712,835 |
$ | 18,671 | $ | 650,769 | $ | 1,699 | $ | (1,568 | ) | $ | 669,571 | |||||||||||||||||||||
| (1) | United States (U.S.). |
| (2) | Organisation for Economic Co-operation and Development (OECD). |
Note 3 Fair value of financial instruments (continued) |
As at October 31, 2025 (Millions of Canadian dollars, except for prices, percentages and ratios) |
||||||||||||||||||||||||||||
Fair value |
Range of input values |
|||||||||||||||||||||||||||
Products |
Reporting line in the fair value hierarchy table |
Assets |
Liabilities |
Valuation techniques |
Significant unobservable inputs (3) |
Low |
High |
Weighted average / Inputs distribution |
||||||||||||||||||||
Corporate debt and related derivatives |
Corporate debt and other debt |
$ |
– |
Price-based |
Prices |
$ |
61.56 |
$ |
225.00 |
$ |
88.89 |
|||||||||||||||||
Loans |
1,274 |
Discounted cash flows |
Credit spread |
1.27% |
11.23% |
6.25% |
||||||||||||||||||||||
Derivative liabilities |
$ |
– |
Credit enhancement |
11.36% |
15.15% |
12.63% |
||||||||||||||||||||||
Government debt and municipal bonds |
Corporate debt and other debt |
166 |
Discounted cash flows |
Yields |
3.93% |
9.00% |
6.44% |
|||||||||||||||||||||
Private equities, hedge fund investments and related equity derivatives |
Equities |
3,445 |
Market comparable |
EV/EBITDA multiples |
4.39X |
16.40X |
7.14X |
|||||||||||||||||||||
Derivative liabilities |
– |
Discounted cash flows |
EV/Rev multiples |
0.91X |
6.36X |
2.45X |
||||||||||||||||||||||
Price-based |
P/E multiples |
6.27X |
25.20X |
10.34X |
||||||||||||||||||||||||
Liquidity discounts (4) |
10.00% |
40.00% |
10.29% |
|||||||||||||||||||||||||
Discount rate |
8.50% |
8.50% |
8.50% |
|||||||||||||||||||||||||
NAV / prices (5) |
n.a. |
n.a. |
n.a. |
|||||||||||||||||||||||||
Interest rate derivatives and interest-rate-linked structured notes (6), (7) |
Derivative assets |
293 |
Discounted cash flows |
Interest rates |
2.60% |
4.63% |
Even |
|||||||||||||||||||||
Derivative liabilities |
901 |
Option pricing model |
CPI swap rates |
1.98% |
2.08% |
Even |
||||||||||||||||||||||
IR-IR correlations |
46.50% |
94.30% |
Even |
|||||||||||||||||||||||||
FX-IR correlations |
(48.50)% |
81.90% |
Even |
|||||||||||||||||||||||||
FX-FX correlations |
(80.10)% |
77.70% |
Even |
|||||||||||||||||||||||||
Equity derivatives and equity-linked structured notes (6), (7) |
Derivative assets |
110 |
Discounted cash flows |
Dividend yields |
0.00% |
8.55% |
Lower |
|||||||||||||||||||||
Deposits |
301 |
Option pricing model |
EQ correlations |
6.30% |
95.85% |
Middle |
||||||||||||||||||||||
Derivative liabilities |
324 |
EQ-FX correlations |
(77.11)% |
50.38% |
Middle |
|||||||||||||||||||||||
EQ volatilities |
6.00% |
146.87% |
Lower |
|||||||||||||||||||||||||
Other (8) |
Derivative assets |
59 |
||||||||||||||||||||||||||
Other assets |
4 |
|||||||||||||||||||||||||||
Mortgage-backed securities |
29 |
|||||||||||||||||||||||||||
Derivative liabilities |
122 |
|||||||||||||||||||||||||||
Total |
$ |
5,380 |
$ |
1,648 |
||||||||||||||||||||||||
As at October 31, 2024 (Millions of Canadian dollars, except for prices, percentages and ratios) |
||||||||||||||||||||||||||||
Fair value |
Range of input values (1), (2) |
|||||||||||||||||||||||||||
Products |
Reporting line in the fair value hierarchy table |
Assets |
Liabilities |
Valuation techniques |
Significant unobservable inputs (3) |
Low |
High |
Weighted average / Inputs distribution |
||||||||||||||||||||
Corporate debt and related derivatives |
Corporate debt and other debt |
$ |
– |
Price-based |
Prices |
$ |
64.67 | $ |
116.25 | $ |
92.07 | |||||||||||||||||
Loans |
1,781 |
Discounted cash flows |
Credit spread |
1.45% |
10.90% |
6.17% |
||||||||||||||||||||||
Derivative liabilities |
$ |
2 |
Credit enhancement |
11.70% |
15.60% |
13.00% |
||||||||||||||||||||||
Government debt and municipal bonds |
Corporate debt and other debt |
143 |
Discounted cash flows |
Yields |
6.54% |
9.55% |
7.54% |
|||||||||||||||||||||
Private equities, hedge fund investments and related equity derivatives |
Equities |
3,050 |
Market comparable |
EV/EBITDA multiples |
3.20X | 17.20X | 7.94X | |||||||||||||||||||||
Derivative liabilities |
– |
Discounted cash flows |
EV/Rev multiples |
0.70X | 5.72X | 2.59X | ||||||||||||||||||||||
Price-based |
P/E multiples |
7.30X | 22.60X | 11.27X | ||||||||||||||||||||||||
Liquidity discounts (4) |
10.00% |
40.00% |
10.40% |
|||||||||||||||||||||||||
Discount rate |
8.50% |
8.50% |
8.50% |
|||||||||||||||||||||||||
NAV / prices (5) |
n.a. |
n.a. |
n.a. |
|||||||||||||||||||||||||
Interest rate derivatives and interest-rate-linked structured notes (6), (7) |
Derivative assets |
355 |
Discounted cash flows |
Interest rates |
1.89% |
4.59% |
Even |
|||||||||||||||||||||
Derivative liabilities |
900 |
Option pricing model |
CPI swap rates |
1.84% |
1.96% |
Even |
||||||||||||||||||||||
IR-IR correlations |
48.00% |
86.00% |
Even |
|||||||||||||||||||||||||
FX-IR correlations |
(76.00)% |
66.00% |
Even |
|||||||||||||||||||||||||
FX-FX correlations |
(74.00)% |
61.00% |
Even |
|||||||||||||||||||||||||
Equity derivatives and equity-linked structured notes (6), (7) |
Derivative assets |
21 |
Discounted cash flows |
Dividend yields |
0.00% |
10.60% |
Lower |
|||||||||||||||||||||
Deposits |
478 |
Option pricing model |
EQ correlations |
6.30% |
95.85% |
Middle |
||||||||||||||||||||||
Derivative liabilities |
283 |
EQ-FX correlations |
(77.11)% |
50.38% |
Middle |
|||||||||||||||||||||||
EQ volatilities |
6.00% |
146.87% |
Lower |
|||||||||||||||||||||||||
Other (8) |
Derivative assets |
16 |
||||||||||||||||||||||||||
Other assets |
7 |
|||||||||||||||||||||||||||
Mortgage-backed securities |
31 |
|||||||||||||||||||||||||||
Derivative liabilities |
36 |
|||||||||||||||||||||||||||
Total |
$ |
5,404 |
$ |
1,699 |
||||||||||||||||||||||||
(1) |
The low and high input values represent the actual highest and lowest level inputs used to value a group of financial instruments in a particular product category. These input ranges do not reflect the level of input uncertainty, but are affected by the different underlying instruments within the product category. The input ranges will therefore vary from period to period based on the characteristics of the underlying instruments held at each balance sheet date. Where provided, the weighted average of the input values is calculated based on the relative fair values of the instruments within the product category. The weighted averages for derivatives are not presented in the table as they would not provide a comparable metric; instead, distribution of significant unobservable inputs within the range for each product category is indicated in the table. |
| (2) | Price-based inputs are significant for certain debt securities and are based on external benchmarks, comparable proxy instruments or pre-quarter-end |
(3) |
Enterprise Value (EV); Earnings Before Interest, Taxes, Depreciation and Amortization (EBITDA); Price / Earnings (P/E); Revenue (Rev); Consumer Price Index (CPI); Interest Rate (IR); Foreign Exchange (FX); Equity (EQ) |
| (4) | Fair value of securities with liquidity discount inputs totalled $624 million (October 31, 2024 – $541 million). |
| (5) | NAV of a hedge fund is total fair value of assets less liabilities divided by the number of fund units. Private equities are valued based on NAV or valuation techniques. The range for NAV per unit or price per share has not been disclosed for the hedge funds or private equities due to the dispersion of prices given the diverse nature of the investments. |
| (6) | The level of aggregation and diversity within each derivative instrument category may result in certain ranges of inputs being wide and inputs being unevenly distributed across the range. In the table, we indicated whether the majority of the inputs are concentrated toward the upper, middle, or lower end of the range, or evenly distributed throughout the range. |
| (7) | The structured notes contain embedded equity or interest rate derivatives with unobservable inputs that are similar to those of the equity or interest rate derivatives. |
| (8) | Other primarily includes certain insignificant instruments such as auction rate securities, commodity derivatives, foreign exchange derivatives, contingent considerations, bank-owned life insurance and retractable shares. |
| n.a. | not applicable |
Note 3 Fair value of financial instruments (continued) |
For the year ended October 31, 2025 |
||||||||||||||||||||||||||||||||||||
| (Millions of Canadian dollars) | Fair value at beginning of period |
Gains (losses) included in earnings |
Gains (losses) included in OCI |
Purchases (issuances) |
Settlement (sales) and other |
Transfers into Level 3 |
Transfers out of Level 3 |
Fair value at end of period |
Gains (losses) included in earnings for positions still held |
|||||||||||||||||||||||||||
| Assets |
||||||||||||||||||||||||||||||||||||
| Securities |
||||||||||||||||||||||||||||||||||||
| Trading |
||||||||||||||||||||||||||||||||||||
| Debt issued or guaranteed by: |
||||||||||||||||||||||||||||||||||||
| Corporate debt and other debt |
$ |
– |
$ |
– |
$ |
– |
$ |
3 |
$ |
(3 |
) |
$ |
83 |
$ |
(51 |
) |
$ |
32 |
$ |
– |
||||||||||||||||
| Equities |
2,544 |
(188 |
) |
9 |
732 |
(233 |
) |
7 |
(8 |
) |
2,863 |
(87 |
) | |||||||||||||||||||||||
2,544 |
(188 |
) |
9 |
735 |
(236 |
) |
90 |
(59 |
) |
2,895 |
(87 |
) | ||||||||||||||||||||||||
| Investment |
||||||||||||||||||||||||||||||||||||
| Mortgage-backed securities |
31 |
2 |
(2 |
) |
– |
(2 |
) |
– |
– |
29 |
2 |
|||||||||||||||||||||||||
| Corporate debt and other debt |
143 |
6 |
9 |
– |
(24 |
) |
– |
– |
134 |
6 |
||||||||||||||||||||||||||
| Equities |
506 |
21 |
48 |
32 |
(25 |
) |
– |
– |
582 |
21 |
||||||||||||||||||||||||||
680 |
29 |
55 |
32 |
(51 |
) |
– |
– |
745 |
29 |
|||||||||||||||||||||||||||
| Loans |
1,781 |
66 |
– |
248 |
(817 |
) |
10 |
(14 |
) |
1,274 |
(3 |
) | ||||||||||||||||||||||||
| Other |
||||||||||||||||||||||||||||||||||||
| Net derivative balances (3) |
||||||||||||||||||||||||||||||||||||
| Interest rate contracts |
(493 |
) |
(103 |
) |
3 |
24 |
(29 |
) |
(11 |
) |
1 |
(608 |
) |
(116 |
) | |||||||||||||||||||||
| Foreign exchange contracts |
(51 |
) |
(4 |
) |
2 |
4 |
(1 |
) |
100 |
6 |
56 |
3 |
||||||||||||||||||||||||
| Credit derivatives |
– |
– |
– |
2 |
– |
– |
– |
2 |
– |
|||||||||||||||||||||||||||
| Other contracts |
(303 |
) |
5 |
(1 |
) |
(127 |
) |
19 |
(360 |
) |
511 |
(256 |
) |
(35 |
) | |||||||||||||||||||||
| Valuation adjustments |
18 |
– |
– |
(33 |
) |
(64 |
) |
– |
– |
(79 |
) |
– |
||||||||||||||||||||||||
| Other assets |
7 |
– |
– |
– |
(3 |
) |
– |
– |
4 |
– |
||||||||||||||||||||||||||
$ |
4,183 |
$ |
(195 |
) |
$ |
68 |
$ |
885 |
$ |
(1,182 |
) |
$ |
(171 |
) |
$ |
445 |
$ |
4,033 |
$ |
(209 |
) | |||||||||||||||
| Liabilities |
||||||||||||||||||||||||||||||||||||
| Deposits |
$ |
(478 |
) |
$ |
(79 |
) |
$ |
(2 |
) |
$ |
(674 |
) |
$ |
156 |
$ |
(274 |
) |
$ |
1,050 |
$ |
(301 |
) |
$ |
16 |
||||||||||||
$ |
(478 |
) |
$ |
(79 |
) |
$ |
(2 |
) |
$ |
(674 |
) |
$ |
156 |
$ |
(274 |
) |
$ |
1,050 |
$ |
(301 |
) |
$ |
16 |
|||||||||||||
| For the year ended October 31, 2024 | ||||||||||||||||||||||||||||||||||||
| (Millions of Canadian dollars) | Fair value at beginning of period |
Gains (losses) included in earnings |
Gains (losses) included in OCI (1) |
Purchases (issuances) |
Settlement (sales) and other (2) |
Transfers into Level 3 |
Transfers out of Level 3 |
Fair value at end of period |
Gains (losses) included in earnings for positions still held |
|||||||||||||||||||||||||||
| Assets |
||||||||||||||||||||||||||||||||||||
| Securities |
||||||||||||||||||||||||||||||||||||
| Trading |
||||||||||||||||||||||||||||||||||||
| Corporate debt and other debt |
$ | – | $ | – | $ | – | $ | – | $ | – | $ | – | $ | – | $ | – | $ | – | ||||||||||||||||||
| Equities |
2,266 | (195 | ) | 5 | 577 | (88 | ) | 1 | (22 | ) | 2,544 | (128 | ) | |||||||||||||||||||||||
| 2,266 | (195 | ) | 5 | 577 | (88 | ) | 1 | (22 | ) | 2,544 | (128 | ) | ||||||||||||||||||||||||
| Investment |
||||||||||||||||||||||||||||||||||||
| Mortgage-backed securities |
29 | – | 2 | – | – | – | – | 31 | n.s. | |||||||||||||||||||||||||||
| Corporate debt and other debt |
149 | – | 11 | – | (17 | ) | – | – | 143 | n.s. | ||||||||||||||||||||||||||
| Equities |
466 | – | 35 | 6 | (3 | ) | 2 | – | 506 | n.s. | ||||||||||||||||||||||||||
| 644 | – | 48 | 6 | (20 | ) | 2 | – | 680 | n.s. | |||||||||||||||||||||||||||
| Loans |
1,859 | (25 | ) | 37 | 513 | (445 | ) | 70 | (228 | ) | 1,781 | 63 | ||||||||||||||||||||||||
| Other |
||||||||||||||||||||||||||||||||||||
| Net derivative balances (3) |
||||||||||||||||||||||||||||||||||||
| Interest rate contracts |
(662 | ) | 46 | 1 | (47 | ) | 145 | 30 | (6 | ) | (493 | ) | 51 | |||||||||||||||||||||||
| Foreign exchange contracts |
(49 | ) | (15 | ) | 7 | 14 | 3 | 3 | (14 | ) | (51 | ) | (9 | ) | ||||||||||||||||||||||
| Credit derivatives |
– | – | – | – | – | – | – | – | – | |||||||||||||||||||||||||||
| Other contracts |
(438 | ) | (139 | ) | 2 | (106 | ) | 8 | (330 | ) | 700 | (303 | ) | 31 | ||||||||||||||||||||||
| Valuation adjustments |
3 | – | – | (4 | ) | 19 | – | – | 18 | – | ||||||||||||||||||||||||||
| Other assets |
11 | – | – | – | (4 | ) | – | – | 7 | – | ||||||||||||||||||||||||||
| $ | 3,634 | $ | (328 | ) | $ | 100 | $ | 953 | $ | (382 | ) | $ | (224 | ) | $ | 430 | $ | 4,183 | $ | 8 | ||||||||||||||||
| Liabilities |
||||||||||||||||||||||||||||||||||||
| Deposits |
$ | (383 | ) | $ | (119 | ) | $ | – | $ | (583 | ) | $ | 165 | $ | (120 | ) | $ | 562 | $ | (478 | ) | $ | (40 | ) | ||||||||||||
| $ | (383 | ) | $ | (119 | ) | $ | – | $ | (583 | ) | $ | 165 | $ | (120 | ) | $ | 562 | $ | (478 | ) | $ | (40 | ) | |||||||||||||
| (1) | These amounts include the foreign currency translation gains or losses arising on consolidation of foreign subsidiaries relating to the Level 3 instruments, where applicable. The unrealized gains on Investment securities recognized in OCI were $35 million for the year ended October 31, 2025 (October 31, 2024 – gains of $38 million) excluding the translation gains or losses arising on consolidation. |
| (2) | Other includes amortization of premiums or discounts recognized in net income. |
| (3) | Net derivatives as at October 31, 2025 included derivative assets of $462 million (October 31, 2024 – $ 392 million) and derivative liabilities of $1,347 million (October 31, 2024 – $1,221 million). |
| n.s. | not significant |
| Note 3 Fair value of financial instruments (continued) |
As at |
||||||||||||||||||||||||||
October 31, 2025 |
October 31, 2024 |
|||||||||||||||||||||||||
(Millions of Canadian dollars) |
Level 3 fair value |
Positive fair value movement from using reasonably possible alternatives |
Negative fair value movement from using reasonably possible alternatives |
Level 3 fair value |
Positive fair value movement from using reasonably possible alternatives |
Negative fair value movement from using reasonably possible alternatives |
||||||||||||||||||||
| Securities |
||||||||||||||||||||||||||
| Trading |
||||||||||||||||||||||||||
| Corporate debt and other debt |
$ |
32 |
$ |
4 |
$ |
(4 |
) |
$ | – | $ | – | $ | – | |||||||||||||
| Equities |
2,863 |
24 |
(23 |
) |
2,544 | 50 | (46 | ) | ||||||||||||||||||
| Investment |
||||||||||||||||||||||||||
| Mortgage-backed securities |
29 |
4 |
(4 |
) |
31 | 4 | (4 | ) | ||||||||||||||||||
| Corporate debt and other debt |
134 |
8 |
(7 |
) |
143 | 9 | (8 | ) | ||||||||||||||||||
| Equities |
582 |
53 |
(52 |
) |
506 | 45 | (44 | ) | ||||||||||||||||||
| Loans |
1,274 |
13 |
(13 |
) |
1,781 | 19 | (20 | ) | ||||||||||||||||||
| Derivatives |
462 |
11 |
(10 |
) |
392 | 5 | (4 | ) | ||||||||||||||||||
| Other assets |
4 |
– |
– |
7 | – | – | ||||||||||||||||||||
$ |
5,380 |
$ |
117 |
$ |
(113 |
) |
$ | 5,404 | $ | 132 | $ | (126 | ) | |||||||||||||
| Deposits |
$ |
(301 |
) |
$ |
3 |
$ |
(3 |
) |
$ | (478 | ) | $ | 15 | $ | (15 | ) | ||||||||||
| Derivatives |
(1,347 |
) |
55 |
(68 |
) |
(1,221 | ) | 54 | (57 | ) | ||||||||||||||||
$ |
(1,648 |
) |
$ |
58 |
$ |
(71 |
) |
$ | (1,699 | ) | $ | 69 | $ | (72 | ) | |||||||||||
Financial assets or liabilities |
Sensitivity methodology | |
| Asset-backed securities, corporate debt, government debt, municipal bonds and loans | Sensitivities are determined based on adjusting, plus or minus one standard deviation, the bid-offer spreads or input prices if a sufficient number of prices are received, adjusting input parameters such as credit spreads or using high and low vendor prices as reasonably possible alternative assumptions. | |
| Private equities, hedge fund investments and related equity derivatives | Sensitivity of direct private equity investments is determined by (i) adjusting the discount rate by 2% when the discounted cash flow method is used to determine fair value, (ii) adjusting the price multiples based on the range of multiples of comparable companies when price-multiples-based models are used, or (iii) using an alternative valuation approach. The private equity fund, hedge fund and related equity derivative NAVs are provided by the fund managers, and as a result, there are no other reasonably possible alternative assumptions for these investments. | |
| Interest rate derivatives | Sensitivities of interest rate and cross currency swaps are derived using plus or minus one standard deviation of the inputs, and an amount representing model and parameter uncertainty, where applicable. | |
| Equity derivatives | Sensitivity of the Level 3 position is determined by shifting the unobservable model inputs by plus or minus one standard deviation of the pricing service market data including volatility, dividends or correlations, as applicable. | |
| Bank funding and deposits | Sensitivities of deposits are calculated by shifting the funding curve by plus or minus certain basis points. | |
| Structured notes | Sensitivities for interest-rate-linked and equity-linked structured notes are derived by adjusting inputs by plus or minus one standard deviation, and for other deposits, by estimating a reasonable move in the funding curve by plus or minus certain basis points. | |
| Note 3 Fair value of financial instruments (continued) |
As at October 31, 2025 |
||||||||||||||||||||||||
| Fair value approximates carrying value (1) |
Fair value may not approximate carrying value |
|||||||||||||||||||||||
Fair value measurements using |
Total fair value |
|||||||||||||||||||||||
(Millions of Canadian dollars) |
Level 1 |
Level 2 |
Level 3 |
Total |
||||||||||||||||||||
| Interest-bearing deposits with banks |
$ |
9,909 |
$ |
– |
$ |
– |
$ |
– |
$ |
– |
$ |
9,909 |
||||||||||||
| Amortized cost securities (2) |
– |
115 |
98,613 |
– |
98,728 |
98,728 |
||||||||||||||||||
| Assets purchased under reverse repurchase agreements and securities borrowed |
72,713 |
– |
10,757 |
– |
10,757 |
83,470 |
||||||||||||||||||
| Loans |
||||||||||||||||||||||||
| Retail |
83,459 |
– |
558,699 |
6,255 |
564,954 |
648,413 |
||||||||||||||||||
| Wholesale |
8,135 |
– |
365,890 |
8,526 |
374,416 |
382,551 |
||||||||||||||||||
91,594 |
– |
924,589 |
14,781 |
939,370 |
1,030,964 |
|||||||||||||||||||
| Other assets |
57,685 |
– |
552 |
250 |
802 |
58,487 |
||||||||||||||||||
231,901 |
115 |
1,034,511 |
15,031 |
1,049,657 |
1,281,558 |
|||||||||||||||||||
| Deposits |
||||||||||||||||||||||||
| Personal |
289,651 |
– |
198,695 |
298 |
198,993 |
488,644 |
||||||||||||||||||
| Business and government |
504,918 |
– |
273,643 |
569 |
274,212 |
779,130 |
||||||||||||||||||
| Bank |
23,643 |
– |
13,000 |
14 |
13,014 |
36,657 |
||||||||||||||||||
818,212 |
– |
485,338 |
881 |
486,219 |
1,304,431 |
|||||||||||||||||||
| Obligations related to assets sold under repurchase agreements and securities loaned |
46,109 |
– |
491 |
– |
491 |
46,600 |
||||||||||||||||||
| Other liabilities |
53,331 |
– |
4,714 |
248 |
4,962 |
58,293 |
||||||||||||||||||
| Subordinated debentures |
– |
– |
13,887 |
– |
13,887 |
13,887 |
||||||||||||||||||
$ |
917,652 |
$ |
– |
$ |
504,430 |
$ |
1,129 |
$ |
505,559 |
$ |
1,423,211 |
|||||||||||||
As at October 31, 2024 |
||||||||||||||||||||||||
| Fair value approximates carrying value (1) |
Fair value may not approximate carrying value |
|||||||||||||||||||||||
Fair value measurements using |
Total fair value |
|||||||||||||||||||||||
(Millions of Canadian dollars) |
Level 1 |
Level 2 |
Level 3 |
Total |
||||||||||||||||||||
| Interest-bearing deposits with banks |
$ |
12,024 |
$ |
– |
$ |
– |
$ |
– |
$ |
– |
$ |
12,024 |
||||||||||||
| Amortized cost securities (2) |
– |
68 |
96,268 |
– |
96,336 |
96,336 |
||||||||||||||||||
| Assets purchased under reverse repurchase agreements and securities borrowed |
54,331 |
– |
12,161 |
– |
12,161 |
66,492 |
||||||||||||||||||
| Loans |
||||||||||||||||||||||||
| Retail |
79,960 |
– |
533,708 |
5,652 |
539,360 |
619,320 |
||||||||||||||||||
| Wholesale |
16,022 |
– |
321,684 |
7,855 |
329,539 |
345,561 |
||||||||||||||||||
95,982 |
– |
855,392 |
13,507 |
868,899 |
964,881 |
|||||||||||||||||||
| Other assets |
49,414 |
– |
412 |
267 |
679 |
50,093 |
||||||||||||||||||
211,751 |
68 |
964,233 |
13,774 |
978,075 |
1,189,826 |
|||||||||||||||||||
| Deposits |
||||||||||||||||||||||||
| Personal |
273,228 |
– |
216,675 |
267 |
216,942 |
490,170 |
||||||||||||||||||
| Business and government |
443,077 |
– |
241,204 |
467 |
241,671 |
684,748 |
||||||||||||||||||
| Bank |
23,942 |
– |
13,241 |
– |
13,241 |
37,183 |
||||||||||||||||||
740,247 |
– |
471,120 |
734 |
471,854 |
1,212,101 |
|||||||||||||||||||
| Obligations related to assets sold under repurchase agreements and securities loaned |
34,658 |
– |
– |
– |
– |
34,658 |
||||||||||||||||||
| Other liabilities |
51,561 |
– |
1,983 |
16,306 |
18,289 |
69,850 |
||||||||||||||||||
| Subordinated debentures |
– |
– |
13,602 |
– |
13,602 |
13,602 |
||||||||||||||||||
$ |
826,466 |
$ |
– |
$ |
486,705 |
$ |
17,040 |
$ |
503,745 |
$ |
1,330,211 |
|||||||||||||
(1) |
Certain financial instruments have not been assigned to a level as the carrying amount approximates their fair values. |
(2) |
Included in Securities – Investment, net of applicable allowance on the Consolidated Balance Sheets. |
| Note 4 Securities |
As at October 31, 2025 |
||||||||||||||||||||||||||||
Term to maturity (1) |
||||||||||||||||||||||||||||
(Millions of Canadian dollars) |
Within 3 months |
3 months to 1 year |
1 year to 5 years |
5 years to 10 years |
Over 10 years |
With no specific maturity |
Total |
|||||||||||||||||||||
| Trading (2) |
||||||||||||||||||||||||||||
| Debt issued or guaranteed by: |
||||||||||||||||||||||||||||
| Canadian government |
$ |
5,832 |
$ |
7,418 |
$ |
7,068 |
$ |
5,529 |
$ |
11,615 |
$ |
– |
$ |
37,462 |
||||||||||||||
| U.S. federal, state, municipal and agencies |
2,883 |
1,906 |
20,494 |
4,981 |
10,493 |
– |
40,757 |
|||||||||||||||||||||
| Other OECD government |
3,976 |
4,445 |
3,064 |
1,207 |
1,725 |
– |
14,417 |
|||||||||||||||||||||
| Mortgage-backed securities |
– |
– |
– |
1 |
73 |
– |
74 |
|||||||||||||||||||||
| Asset-backed securities |
138 |
118 |
348 |
415 |
276 |
– |
1,295 |
|||||||||||||||||||||
| Corporate debt and other debt (3) |
1,909 |
3,606 |
6,736 |
4,906 |
8,832 |
– |
25,989 |
|||||||||||||||||||||
| Equities |
99,073 |
99,073 |
||||||||||||||||||||||||||
14,738 |
17,493 |
37,710 |
17,039 |
33,014 |
99,073 |
219,067 |
||||||||||||||||||||||
| Fair value through other comprehensive income (2) |
||||||||||||||||||||||||||||
| Debt issued or guaranteed by: |
||||||||||||||||||||||||||||
| Canadian government |
||||||||||||||||||||||||||||
| Federal |
||||||||||||||||||||||||||||
| Amortized cost |
368 |
15,974 |
23,215 |
270 |
– |
– |
39,827 |
|||||||||||||||||||||
| Fair value |
368 |
15,978 |
23,250 |
270 |
– |
– |
39,866 |
|||||||||||||||||||||
| Yield (4) |
2.1% |
3.4% |
2.9% |
2.5% |
– |
– |
3.1% |
|||||||||||||||||||||
| Provincial and municipal |
||||||||||||||||||||||||||||
| Amortized cost |
– |
1,892 |
8,225 |
666 |
585 |
– |
11,368 |
|||||||||||||||||||||
| Fair value |
– |
1,893 |
8,222 |
670 |
533 |
– |
11,318 |
|||||||||||||||||||||
| Yield (4) |
– |
3.4% |
3.3% |
3.1% |
4.6% |
– |
3.4% |
|||||||||||||||||||||
| U.S. federal, state, municipal and agencies |
||||||||||||||||||||||||||||
| Amortized cost |
1,723 |
7,455 |
56,949 |
51,353 |
13,905 |
– |
131,385 |
|||||||||||||||||||||
| Fair value |
1,695 |
7,455 |
57,164 |
51,532 |
12,845 |
– |
130,691 |
|||||||||||||||||||||
| Yield (4) |
4.5% |
3.0% |
3.9% |
3.7% |
3.6% |
– |
3.8% |
|||||||||||||||||||||
| Other OECD government |
||||||||||||||||||||||||||||
| Amortized cost |
358 |
2,847 |
8,722 |
48 |
– |
– |
11,975 |
|||||||||||||||||||||
| Fair value |
357 |
2,835 |
8,693 |
48 |
– |
– |
11,933 |
|||||||||||||||||||||
| Yield (4) |
2.5% |
2.5% |
3.7% |
3.7% |
– |
– |
3.4% |
|||||||||||||||||||||
| Mortgage-backed securities |
||||||||||||||||||||||||||||
| Amortized cost |
– |
– |
70 |
87 |
2,517 |
– |
2,674 |
|||||||||||||||||||||
| Fair value |
– |
– |
70 |
85 |
2,519 |
– |
2,674 |
|||||||||||||||||||||
| Yield (4) |
– |
– |
5.4% |
5.6% |
5.6% |
– |
5.6% |
|||||||||||||||||||||
| Asset-backed securities |
||||||||||||||||||||||||||||
| Amortized cost |
– |
– |
5 |
3,356 |
6,765 |
– |
10,126 |
|||||||||||||||||||||
| Fair value |
– |
– |
5 |
3,357 |
6,777 |
– |
10,139 |
|||||||||||||||||||||
| Yield (4) |
– |
– |
5.3% |
5.3% |
5.5% |
– |
5.4% |
|||||||||||||||||||||
| Corporate debt and other debt |
||||||||||||||||||||||||||||
| Amortized cost |
5,337 |
8,239 |
18,761 |
985 |
280 |
– |
33,602 |
|||||||||||||||||||||
| Fair value |
5,338 |
8,245 |
18,827 |
1,000 |
268 |
– |
33,678 |
|||||||||||||||||||||
| Yield (4) |
2.2% |
2.4% |
3.7% |
4.4% |
5.3% |
– |
3.2% |
|||||||||||||||||||||
| Equities |
||||||||||||||||||||||||||||
| Cost |
832 |
832 |
||||||||||||||||||||||||||
| Fair value (5) |
1,496 |
1,496 |
||||||||||||||||||||||||||
| Cost/Amortized cost |
7,786 |
36,407 |
115,947 |
56,765 |
24,052 |
832 |
241,789 |
|||||||||||||||||||||
| Fair value |
7,758 |
36,406 |
116,231 |
56,962 |
22,942 |
1,496 |
241,795 |
|||||||||||||||||||||
| Amortized cost (2) |
||||||||||||||||||||||||||||
| Debt issued or guaranteed by: |
||||||||||||||||||||||||||||
| Canadian government |
1,302 |
3,188 |
19,544 |
5,355 |
36 |
– |
29,425 |
|||||||||||||||||||||
| Yield (4) |
1.4% |
1.9% |
3.1% |
2.6% |
3.8% |
– |
2.8% |
|||||||||||||||||||||
| U.S. federal, state, municipal and agencies |
2,095 |
4,607 |
18,716 |
4,778 |
19,366 |
– |
49,562 |
|||||||||||||||||||||
| Yield (4) |
3.1% |
3.9% |
3.0% |
3.4% |
2.9% |
– |
3.1% |
|||||||||||||||||||||
| Other OECD government |
795 |
2,096 |
4,367 |
137 |
– |
– |
7,395 |
|||||||||||||||||||||
| Yield (4) |
2.6% |
2.7% |
3.8% |
4.1% |
– |
– |
3.4% |
|||||||||||||||||||||
| Asset-backed securities |
– |
– |
21 |
– |
126 |
– |
147 |
|||||||||||||||||||||
| Yield (4) |
– |
– |
4.7% |
– |
5.4% |
– |
5.3% |
|||||||||||||||||||||
| Corporate debt and other debt |
1,019 |
4,099 |
9,102 |
162 |
15 |
– |
14,397 |
|||||||||||||||||||||
| Yield (4) |
3.2% |
3.1% |
3.6% |
3.7% |
4.8% |
– |
3.4% |
|||||||||||||||||||||
| Amortized cost, net of allowance |
5,211 |
13,990 |
51,750 |
10,432 |
19,543 |
– |
100,926 |
|||||||||||||||||||||
| Fair value |
5,210 |
14,011 |
52,093 |
10,051 |
17,363 |
– |
98,728 |
|||||||||||||||||||||
| Total carrying value of securities |
$ |
27,707 |
$ |
67,889 |
$ |
205,691 |
$ |
84,433 |
$ |
75,499 |
$ |
100,569 |
$ |
561,788 |
||||||||||||||
| As at October 31, 2024 | ||||||||||||||||||||||||||||
| Term to maturity (1) |
||||||||||||||||||||||||||||
(Millions of Canadian dollars) |
Within 3 months |
3 months to 1 year |
1 year to 5 years |
5 years to 10 years |
Over 10 years |
With no specific maturity |
Total | |||||||||||||||||||||
| Trading (2) |
||||||||||||||||||||||||||||
| Debt issued or guaranteed by: |
||||||||||||||||||||||||||||
| Canadian government |
$ | 2,026 | $ | 8,712 | $ | 6,054 | $ | 3,509 | $ | 10,071 | $ | – | $ | 30,372 | ||||||||||||||
| U.S. federal, state, municipal and agencies |
2,599 | 1,423 | 13,648 | 4,336 | 8,982 | – | 30,988 | |||||||||||||||||||||
| Other OECD government |
710 | 246 | 1,578 | 972 | 1,128 | – | 4,634 | |||||||||||||||||||||
| Mortgage-backed securities |
– | – | – | – | 3 | – | 3 | |||||||||||||||||||||
| Asset-backed securities |
289 | 213 | 387 | 406 | 139 | – | 1,434 | |||||||||||||||||||||
| Corporate debt and other debt (3) |
2,030 | 3,178 | 8,170 | 4,200 | 8,617 | – | 26,195 | |||||||||||||||||||||
| Equities |
89,674 | 89,674 | ||||||||||||||||||||||||||
| 7,654 | 13,772 | 29,837 | 13,423 | 28,940 | 89,674 | 183,300 | ||||||||||||||||||||||
| Fair value through other comprehensive income (2) |
||||||||||||||||||||||||||||
| Debt issued or guaranteed by: |
||||||||||||||||||||||||||||
| Canadian government |
||||||||||||||||||||||||||||
| Federal |
||||||||||||||||||||||||||||
| Amortized cost |
2,068 | 2,810 | 7,893 | 394 | – | – | 13,165 | |||||||||||||||||||||
| Fair value |
2,068 | 2,803 | 7,904 | 394 | – | – | 13,169 | |||||||||||||||||||||
| Yield (4) |
3.2% | 2.4% | 2.9% | 2.9% | – | – | 2.9% | |||||||||||||||||||||
| Provincial and municipal |
||||||||||||||||||||||||||||
| Amortized cost |
154 | 2,768 | 3,827 | 334 | 480 | – | 7,563 | |||||||||||||||||||||
| Fair value |
154 | 2,767 | 3,833 | 333 | 467 | – | 7,554 | |||||||||||||||||||||
| Yield (4) |
3.6% | 2.2% | 3.3% | 2.7% | 4.3% | – | 3.0% | |||||||||||||||||||||
| U.S. federal, state, municipal and agencies |
||||||||||||||||||||||||||||
| Amortized cost |
1,154 | 1,198 | 30,773 | 33,906 | 14,601 | – | 81,632 | |||||||||||||||||||||
| Fair value |
1,182 | 1,196 | 30,797 | 33,831 | 13,260 | – | 80,266 | |||||||||||||||||||||
| Yield (4) |
5.6% | 2.1% | 3.1% | 3.9% | 3.3% | – | 3.5% | |||||||||||||||||||||
| Other OECD government |
||||||||||||||||||||||||||||
| Amortized cost |
300 | 1,510 | 8,389 | – | – | – | 10,199 | |||||||||||||||||||||
| Fair value |
300 | 1,511 | 8,345 | – | – | – | 10,156 | |||||||||||||||||||||
| Yield (4) |
1.2% | 3.6% | 3.5% | – | – | – | 3.4% | |||||||||||||||||||||
| Mortgage-backed securities |
||||||||||||||||||||||||||||
| Amortized cost |
– | – | – | 58 | 2,588 | – | 2,646 | |||||||||||||||||||||
| Fair value |
– | – | – | 56 | 2,578 | – | 2,634 | |||||||||||||||||||||
| Yield (4) |
– | – | – | 6.1% | 5.9% | – | 5.9% | |||||||||||||||||||||
| Asset-backed securities |
||||||||||||||||||||||||||||
| Amortized cost |
– | – | – | 4,258 | 5,085 | – | 9,343 | |||||||||||||||||||||
| Fair value |
– | – | – | 4,263 | 5,094 | – | 9,357 | |||||||||||||||||||||
| Yield (4) |
– | – | – | 6.2% | 6.4% | – | 6.3% | |||||||||||||||||||||
| Corporate debt and other debt |
||||||||||||||||||||||||||||
| Amortized cost |
7,028 | 2,703 | 20,830 | 991 | 380 | – | 31,932 | |||||||||||||||||||||
| Fair value |
7,027 | 2,707 | 20,858 | 1,010 | 380 | – | 31,982 | |||||||||||||||||||||
| Yield (4) |
3.2% | 3.8% | 4.0% | 5.0% | 5.3% | – | 3.9% | |||||||||||||||||||||
| Equities |
||||||||||||||||||||||||||||
| Cost |
728 | 728 | ||||||||||||||||||||||||||
| Fair value (5) |
1,242 | 1,242 | ||||||||||||||||||||||||||
| Cost/Amortized cost |
10,704 | 10,989 | 71,712 | 39,941 | 23,134 | 728 | 157,208 | |||||||||||||||||||||
| Fair value |
10,731 | 10,984 | 71,737 | 39,887 | 21,779 | 1,242 | 156,360 | |||||||||||||||||||||
| Amortized cost (2) |
||||||||||||||||||||||||||||
| Debt issued or guaranteed by: |
||||||||||||||||||||||||||||
| Canadian government |
216 | 7,516 | 17,571 | 6,160 | – | – | 31,463 | |||||||||||||||||||||
| Yield (4) |
2.4% | 1.7% | 3.0% | 2.0% | – | – | 2.4% | |||||||||||||||||||||
| U.S. federal, state, municipal and agencies |
2,029 | 5,659 | 13,197 | 4,882 | 20,221 | – | 45,988 | |||||||||||||||||||||
| Yield (4) |
2.5% | 3.6% | 3.4% | 3.2% | 2.6% | – | 3.0% | |||||||||||||||||||||
| Other OECD government |
61 | 1,133 | 5,169 | 202 | – | – | 6,565 | |||||||||||||||||||||
| Yield (4) |
0.9% | 2.3% | 3.2% | 3.3% | – | – | 3.0% | |||||||||||||||||||||
| Asset-backed securities |
– | – | 2 | 32 | – | – | 34 | |||||||||||||||||||||
| Yield (4) |
– | – | 0.3% | 5.6% | – | – | 5.2% | |||||||||||||||||||||
| Corporate debt and other debt |
526 | 3,677 | 11,724 | 259 | 22 | – | 16,208 | |||||||||||||||||||||
| Yield (4) |
2.9% | 3.1% | 3.6% | 3.5% | 5.3% | – | 3.5% | |||||||||||||||||||||
| Amortized cost, net of allowance |
2,832 | 17,985 | 47,663 | 11,535 | 20,243 | – | 100,258 | |||||||||||||||||||||
| Fair value |
2,826 | 17,855 | 47,481 | 10,701 | 17,473 | – | 96,336 | |||||||||||||||||||||
| Total carrying value of securities |
$ | 21,217 | $ | 42,741 | $ | 149,237 | $ | 64,845 | $ | 70,962 | $ | 90,916 | $ | 439,918 | ||||||||||||||
(1) |
Actual maturities may differ from contractual maturities shown above as borrowers may have the right to extend or prepay obligations with or without penalties. |
(2) |
Trading securities and FVOCI securities are recorded at fair value. Amortized cost securities, included in Investment securities, are recorded at amortized cost and presented net of allowance for credit losses. |
(3) |
Primarily composed of corporate debt, supra-national debt and com mercial paper. |
(4) |
The weighted average yield is derived using the contractual interest rate and the carrying value at the end of the year for the respective securities. |
(5) |
Certain equity securities that are not held-for-trading |
| Note 4 Securities (continued) |
As at |
||||||||||||||||||||||||||||||||||||
October 31, 2025 |
October 31, 2024 |
|||||||||||||||||||||||||||||||||||
(Millions of Canadian dollars) |
Cost/ Amortized cost |
Gross unrealized gains |
Gross unrealized losses |
Fair value |
Cost/ Amortized cost |
Gross unrealized gains |
Gross unrealized losses |
Fair value |
||||||||||||||||||||||||||||
| Debt issued or guaranteed by: |
||||||||||||||||||||||||||||||||||||
| Canadian government |
||||||||||||||||||||||||||||||||||||
| Federal |
$ |
39,827 |
$ |
46 |
$ |
(7 |
) |
$ |
39,866 |
$ | 13,165 | $ | 31 | $ | (27 | ) | $ | 13,169 | ||||||||||||||||||
| Provincial and municipal |
11,368 |
39 |
(89 |
) |
11,318 |
7,563 | 27 | (36 | ) | 7,554 | ||||||||||||||||||||||||||
| U.S. federal, state, municipal and agencies |
131,385 |
622 |
(1,316 |
) |
130,691 |
81,632 | 333 | (1,699 | ) | 80,266 | ||||||||||||||||||||||||||
| Other OECD government |
11,975 |
14 |
(56 |
) |
11,933 |
10,199 | 6 | (49 | ) | 10,156 | ||||||||||||||||||||||||||
| Mortgage-backed securities |
2,674 |
7 |
(7 |
) |
2,674 |
2,646 | 3 | (15 | ) | 2,634 | ||||||||||||||||||||||||||
| Asset-backed securities |
10,126 |
15 |
(2 |
) |
10,139 |
9,343 | 17 | (3 | ) | 9,357 | ||||||||||||||||||||||||||
| Corporate debt and other debt |
33,602 |
122 |
(46 |
) |
33,678 |
31,932 | 101 | (51 | ) | 31,982 | ||||||||||||||||||||||||||
| Equities |
832 |
669 |
(5 |
) |
1,496 |
728 | 519 | (5 | ) | 1,242 | ||||||||||||||||||||||||||
$ |
241,789 |
$ |
1,534 |
$ |
(1,528 |
) |
$ |
241,795 |
$ | 157,208 | $ | 1,037 | $ | (1,885 | ) | $ | 156,360 | |||||||||||||||||||
| (1) | Excludes $100,926 million of held-to-collect |
| (2) | Gross unrealized gains and losses includes $(40) million of allowance for credit losses on debt securities at FVOCI as at October 31, 2025 (October 31, 2024 – $(35) million) recognized in income and Other components of equity. |
| • | Transfers between stages, which are presumed to occur before any corresponding remeasurement of the allowance. |
| • | Purchases, which reflect the allowance related to assets newly recognized during the period, including those assets that were derecognized following a modification of terms. |
| • | Sales and maturities, which reflect the allowance related to assets derecognized during the period without a credit loss being incurred, including those assets that were derecognized following a modification of terms. |
| • | Changes in risk, parameters and exposures, which comprise the impact of changes in model inputs or assumptions, including changes in forward-looking macroeconomic conditions; partial repayments; changes in the measurement following a transfer between stages; and unwinding of the time value discount due to the passage of time. |
For the year ended |
||||||||||||||||||||||||||||||||||||||||||||
October 31, 2025 |
October 31, 2024 |
|||||||||||||||||||||||||||||||||||||||||||
Performing |
Impaired |
Performing | Impaired | |||||||||||||||||||||||||||||||||||||||||
| (Millions of Canadian dollars) | Stage 1 |
Stage 2 |
Stage 3 |
Total |
Stage 1 | Stage 2 | Stage 3 (2) | Total | ||||||||||||||||||||||||||||||||||||
| Balance at beginning of period |
$ |
6 |
$ |
– |
$ |
(41 |
) |
$ |
(35 |
) |
$ | 4 | $ | – | $ | (37 | ) | $ | (33 | ) | ||||||||||||||||||||||||
| Provision for credit losses |
||||||||||||||||||||||||||||||||||||||||||||
| Transfers to stage 1 |
– |
– |
– |
– |
– | – | – | – | ||||||||||||||||||||||||||||||||||||
| Transfers to stage 2 |
– |
– |
– |
– |
– | – | – | – | ||||||||||||||||||||||||||||||||||||
| Transfers to stage 3 |
– |
– |
– |
– |
– | – | – | – | ||||||||||||||||||||||||||||||||||||
| Purchases |
7 |
– |
– |
7 |
10 | – | – | 10 | ||||||||||||||||||||||||||||||||||||
| Sales and maturities |
(4 |
) |
– |
– |
(4 |
) |
(4 | ) | – | – | (4 | ) | ||||||||||||||||||||||||||||||||
| Changes in risk, parameters and exposures |
(4 |
) |
– |
(10 |
) |
(14 |
) |
(4 | ) | – | (8 | ) | (12 | ) | ||||||||||||||||||||||||||||||
| Exchange rate and other |
– |
– |
6 |
6 |
– | – | 4 | 4 | ||||||||||||||||||||||||||||||||||||
| Balance at end of period |
$ |
5 |
$ |
– |
$ |
(45 |
) |
$ |
(40 |
) |
$ | 6 | $ | – | $ | (41 | ) | $ | (35 | ) | ||||||||||||||||||||||||
| (1) | Expected credit losses on debt securities at FVOCI are not separately recognized on the Consolidated Balance Sheets as the related securities are recorded at fair value. The cumulative amount of credit losses recognized in income is presented in Other components of equity. |
| (2) | Reflects changes in the allowance for purchased credit-impaired securities. |
| For the year ended | ||||||||||||||||||||||||||||||||||||||||||||
October 31, 2025 |
October 31, 2024 | |||||||||||||||||||||||||||||||||||||||||||
Performing |
Impaired |
Performing | Impaired | |||||||||||||||||||||||||||||||||||||||||
| (Millions of Canadian dollars) | Stage 1 |
Stage 2 |
Stage 3 |
Total |
Stage 1 | Stage 2 | Stage 3 | Total | ||||||||||||||||||||||||||||||||||||
| Balance at beginning of period |
$ |
6 |
$ |
8 |
$ |
– |
$ |
14 |
$ | 8 | $ | 15 | $ | – | $ | 23 | ||||||||||||||||||||||||||||
| Provision for credit losses |
||||||||||||||||||||||||||||||||||||||||||||
| Transfers to stage 1 |
– |
– |
– |
– |
– | – | – | – | ||||||||||||||||||||||||||||||||||||
| Transfers to stage 2 |
– |
– |
– |
– |
– | – | – | – | ||||||||||||||||||||||||||||||||||||
| Transfers to stage 3 |
– |
– |
– |
– |
– | – | – | – | ||||||||||||||||||||||||||||||||||||
| Purchases |
7 |
– |
– |
7 |
7 | – | – | 7 | ||||||||||||||||||||||||||||||||||||
| Sales and maturities |
– |
– |
– |
– |
(2 | ) | – | – | (2 | ) | ||||||||||||||||||||||||||||||||||
| Changes in risk, parameters and exposures |
(6 |
) |
(2 |
) |
– |
(8 |
) |
(8 | ) | (6 | ) | – | (14 | ) | ||||||||||||||||||||||||||||||
| Exchange rate and other |
1 |
– |
– |
1 |
1 | (1 | ) | – | – | |||||||||||||||||||||||||||||||||||
| Balance at end of period |
$ |
8 |
$ |
6 |
$ |
– |
$ |
14 |
$ | 6 | $ | 8 | $ | – | $ | 14 | ||||||||||||||||||||||||||||
| As at | ||||||||||||||||||||||||||||||||||||||||||||
October 31, 2025 |
October 31, 2024 | |||||||||||||||||||||||||||||||||||||||||||
Performing |
Impaired |
Performing | Impaired | |||||||||||||||||||||||||||||||||||||||||
| (Millions of Canadian dollars) | Stage 1 |
Stage 2 |
Stage 3 |
Total |
Stage 1 | Stage 2 | Stage 3 (1) | Total | ||||||||||||||||||||||||||||||||||||
| Investment securities |
||||||||||||||||||||||||||||||||||||||||||||
| Securities at FVOCI |
||||||||||||||||||||||||||||||||||||||||||||
| Investment grade |
$ |
239,375 |
$ |
– |
$ |
– |
$ |
239,375 |
$ | 154,100 | $ | – | $ | – | $ | 154,100 | ||||||||||||||||||||||||||||
| Non-investment grade |
786 |
4 |
– |
790 |
875 | – | – | 875 | ||||||||||||||||||||||||||||||||||||
| Impaired |
– |
– |
134 |
134 |
– | – | 143 | 143 | ||||||||||||||||||||||||||||||||||||
240,161 |
4 |
134 |
240,299 |
154,975 | – | 143 | 155,118 | |||||||||||||||||||||||||||||||||||||
| Items not subject to impairment (2) |
1,496 |
1,242 | ||||||||||||||||||||||||||||||||||||||||||
$ |
241,795 |
$ | 156,360 | |||||||||||||||||||||||||||||||||||||||||
| Securities at amortized cost |
||||||||||||||||||||||||||||||||||||||||||||
| Investment grade |
$ |
99,673 |
$ |
– |
$ |
– |
$ |
99,673 |
$ | 99,224 | $ | – | $ | – | $ | 99,224 | ||||||||||||||||||||||||||||
| Non-investment grade |
1,098 |
169 |
– |
1,267 |
856 | 192 | – | 1,048 | ||||||||||||||||||||||||||||||||||||
100,771 |
169 |
– |
100,940 |
100,080 | 192 | – | 100,272 | |||||||||||||||||||||||||||||||||||||
| Allowance for credit losses |
8 |
6 |
– |
14 |
6 | 8 | – | 14 | ||||||||||||||||||||||||||||||||||||
$ |
100,763 |
$ |
163 |
$ |
– |
$ |
100,926 |
$ | 100,074 | $ | 184 | $ | – | $ | 100,258 | |||||||||||||||||||||||||||||
| (1) | Reflects $134 million of purchased credit-impaired securities (October 31, 2024 – $143 million). |
| (2) | Investment securities at FVOCI not subject to impairment represent equity securities designated as FVOCI. |
| Note 5 Loans and allowance for credit losses |
As at October 31, 2025 |
||||||||||||||||||||||||
(Millions of Canadian dollars) |
Canada |
United States |
Other International |
Total |
Allowance for loan losses (1) |
Total net of allowance |
||||||||||||||||||
| Retail (2) |
||||||||||||||||||||||||
| Residential mortgages |
$ |
454,346 |
$ |
35,673 |
$ |
3,394 |
$ |
493,413 |
$ |
(794 |
) |
$ |
492,619 |
|||||||||||
| Personal |
90,842 |
20,984 |
3,519 |
115,345 |
(1,541 |
) |
113,804 |
|||||||||||||||||
| Credit cards (3) |
25,836 |
652 |
301 |
26,789 |
(1,273 |
) |
25,516 |
|||||||||||||||||
| Small business (4) |
16,797 |
– |
– |
16,797 |
(334 |
) |
16,463 |
|||||||||||||||||
| Wholesale (2), (5) |
194,487 |
143,439 |
59,245 |
397,171 |
(3,151 |
) |
394,020 |
|||||||||||||||||
| Total loans |
$ |
782,308 |
$ |
200,748 |
$ |
66,459 |
$ |
1,049,515 |
$ |
(7,093 |
) |
$ |
1,042,422 |
|||||||||||
| Undrawn loan commitments – Retail |
311,332 |
9,434 |
4,913 |
325,679 |
(197 |
) |
||||||||||||||||||
| Undrawn loan commitments – Wholesale |
183,589 |
309,469 |
101,511 |
594,569 |
(168 |
) |
||||||||||||||||||
| As at October 31, 2024 | ||||||||||||||||||||||||
(Millions of Canadian dollars) |
Canada | United States |
Other International |
Total | Allowance for loan losses (1) |
Total net of allowance |
||||||||||||||||||
| Retail (2) |
||||||||||||||||||||||||
| Residential mortgages |
$ | 441,191 | $ | 33,092 | $ | 3,261 | $ | 477,544 | $ | (572 | ) | $ | 476,972 | |||||||||||
| Personal |
86,977 | 18,148 | 3,213 | 108,338 | (1,389 | ) | 106,949 | |||||||||||||||||
| Credit cards (3) |
24,619 | 653 | 293 | 25,565 | (1,164 | ) | 24,401 | |||||||||||||||||
| Small business (4) |
15,531 | – | – | 15,531 | (258 | ) | 15,273 | |||||||||||||||||
| Wholesale (2), (5) |
189,378 | 119,231 | 51,830 | 360,439 | (2,654 | ) | 357,785 | |||||||||||||||||
| Total loans |
$ | 757,696 | $ | 171,124 | $ | 58,597 | $ | 987,417 | $ | (6,037 | ) | $ | 981,380 | |||||||||||
| Undrawn loan commitments – Retail |
300,071 | 5,099 | 4,100 | 309,270 | (172 | ) | ||||||||||||||||||
| Undrawn loan commitments – Wholesale |
180,687 | 264,309 | 88,787 | 533,783 | (139 | ) | ||||||||||||||||||
| (1) | Excludes allowance for loans measured at FVOCI of $1 million (October 31, 2024 – $4 million). |
| (2) | Geographic information is based on residence of the borrower. |
| (3) | The credit cards business is managed as a single portfolio and includes both consumer and business cards. |
| (4) | Includes small business exposure managed on a pooled basis. |
| (5) | Includes small business exposure managed on an individual client basis. |
As at October 31, 2025 |
||||||||||||||||||||||||||||||||
Maturity term (1) |
Rate sensitivity |
|||||||||||||||||||||||||||||||
(Millions of Canadian dollars) |
Under 1 year (2) |
1 to 5 years |
Over 5 years |
Total |
Floating |
Fixed Rate |
Non-rate- sensitive |
Total |
||||||||||||||||||||||||
| Retail |
$ |
395,387 |
$ |
215,783 |
$ |
41,174 |
$ |
652,344 |
$ |
253,592 |
$ |
389,868 |
$ |
8,884 |
$ |
652,344 |
||||||||||||||||
| Wholesale |
338,854 |
43,992 |
14,325 |
397,171 |
84,295 |
309,440 |
3,436 |
397,171 |
||||||||||||||||||||||||
| Total loans |
$ |
734,241 |
$ |
259,775 |
$ |
55,499 |
$ |
1,049,515 |
$ |
337,887 |
$ |
699,308 |
$ |
12,320 |
$ |
1,049,515 |
||||||||||||||||
| Allowance for loan losses |
(7,093 |
) |
(7,093 |
) | ||||||||||||||||||||||||||||
| Total loans net of allowance for loan losses |
$ |
734,241 |
$ |
259,775 |
$ |
48,406 |
$ |
1,042,422 |
$ |
337,887 |
$ |
699,308 |
$ |
5,227 |
$ |
1,042,422 |
||||||||||||||||
As at October 31, 2024 |
||||||||||||||||||||||||||||||||
| Maturity term (1) |
Rate sensitivity |
|||||||||||||||||||||||||||||||
(Millions of Canadian dollars) |
Under 1 year (2) |
1 to 5 years |
Over 5 years |
Total |
Floating |
Fixed Rate |
Non-rate- sensitive |
Total |
||||||||||||||||||||||||
| Retail |
$ | 342,552 | $ | 240,995 | $ | 43,431 | $ | 626,978 | $ | 211,027 | $ | 407,455 | $ | 8,496 | $ | 626,978 | ||||||||||||||||
| Wholesale |
302,024 | 44,977 | 13,438 | 360,439 | 80,385 | 277,599 | 2,455 | 360,439 | ||||||||||||||||||||||||
| Total loans |
$ | 644,576 | $ | 285,972 | $ | 56,869 | $ | 987,417 | $ | 291,412 | $ | 685,054 | $ | 10,951 | $ | 987,417 | ||||||||||||||||
| Allowance for loan losses |
(6,037 | ) | (6,037 | ) | ||||||||||||||||||||||||||||
| Total loans net of allowance for loan losses |
$ | 644,576 | $ | 285,972 | $ | 50,832 | $ | 981,380 | $ | 291,412 | $ | 685,054 | $ | 4,914 | $ | 981,380 | ||||||||||||||||
| (1) | Generally, based on the earlier of contractual repricing or maturity date. |
| (2) | Includes variable rate loans that can be repriced at the clients’ discretion without penalty. |
| For the year ended | ||||||||||||||||||||||||||||||||||||||||||||
October 31, 2025 |
October 31, 2024 | |||||||||||||||||||||||||||||||||||||||||||
| (Millions of Canadian dollars) | Balance at beginning of period |
Provision for credit losses |
Net write-offs |
Exchange rate and other |
Balance at end of period |
Balance at beginning of period |
Provision for credit losses |
Net write-offs (1) |
Exchange rate and other |
Balance at end of period |
||||||||||||||||||||||||||||||||||
| Retail |
||||||||||||||||||||||||||||||||||||||||||||
| Residential mortgages |
$ |
572 |
$ |
280 |
$ |
(9 |
) |
$ |
(49 |
) |
$ |
794 |
$ | 481 | $ | 114 | $ | (10 | ) | $ | (13 | ) | $ | 572 | ||||||||||||||||||||
| Personal |
1,482 |
956 |
(779 |
) |
(20 |
) |
1,639 |
1,228 | 877 | (616 | ) | (7 | ) | 1,482 | ||||||||||||||||||||||||||||||
| Credit cards |
1,233 |
952 |
(829 |
) |
– |
1,356 |
1,069 | 831 | (669 | ) | 2 | 1,233 | ||||||||||||||||||||||||||||||||
| Small business |
272 |
209 |
(104 |
) |
(26 |
) |
351 |
194 | 178 | (84 | ) | (16 | ) | 272 | ||||||||||||||||||||||||||||||
| Wholesale |
2,793 |
1,959 |
(1,163 |
) |
(270 |
) |
3,319 |
2,326 | 1,297 | (700 | ) | (130 | ) | 2,793 | ||||||||||||||||||||||||||||||
| Customers’ liability under acceptances |
– |
– |
– |
– |
– |
50 | (50 | ) | – | – | – | |||||||||||||||||||||||||||||||||
$ |
6,352 |
$ |
4,356 |
$ |
(2,884 |
) |
$ |
(365 |
) |
$ |
7,459 |
$ | 5,348 | $ | 3,247 | $ | (2,079 | ) | $ | (164 | ) | $ | 6,352 | |||||||||||||||||||||
| Presented as: |
||||||||||||||||||||||||||||||||||||||||||||
| Allowance for loan losses |
$ |
6,037 |
$ |
7,093 |
$ | 5,004 | $ | 6,037 | ||||||||||||||||||||||||||||||||||||
| Other liabilities – Provisions |
311 |
365 |
288 | 311 | ||||||||||||||||||||||||||||||||||||||||
| Other assets – Other |
– |
– |
50 | – | ||||||||||||||||||||||||||||||||||||||||
| Other components of equity |
4 |
1 |
6 | 4 | ||||||||||||||||||||||||||||||||||||||||
| (1) | Loans written-off are generally subject to continued collection efforts for a period of time following write-off. The contractual amount outstanding on loans written-off during the year ended October 31, 2025 that are no longer subject to enforcement activity was $285 million (October 31, 2024 – $359 million). |
• |
Model changes, as applicable, which generally comprise the impact of signifi ca nt changes to the quantitative models used to estimate expected credit losses and any staging impacts that may arise. |
• |
Transfers between stages, which are presumed to occur before any corresponding remeasurements of the allowance. |
• |
Originations, which reflect the allowance related to assets newly recognized during the perio d, including those assets that were derecognized following a modification of terms. |
• |
Maturities, which reflect the allowance related to assets derecognized during the period without a credit loss being incurred, including those assets that were derecognized following a modification of terms. |
• |
Changes in risk, parameters and exposures, which comprise the impact of changes in model inputs or assumptions, including changes in forward-looking macroeconomic conditions; partial repayments and additional draws on existing facilities; changes in the measurement following a transfer between stages; and unwinding of the time value discount due to the passage of time in Stage 1 and Stage 2. |
| Note 5 Loans and allowance for credit losses (continued) |
| For the year ended | ||||||||||||||||||||||||||||||||||||||||||||
October 31, 2025 |
October 31, 2024 | |||||||||||||||||||||||||||||||||||||||||||
Performing |
Impaired |
Performing | Impaired | |||||||||||||||||||||||||||||||||||||||||
| (Millions of Canadian dollars) | Stage 1 |
Stage 2 |
Stage 3 |
Total |
Stage 1 | Stage 2 | Stage 3 | Total | ||||||||||||||||||||||||||||||||||||
| Residential mortgages |
||||||||||||||||||||||||||||||||||||||||||||
| Balance at beginning of period |
$ |
215 |
$ |
126 |
$ |
231 |
$ |
572 |
$ | 223 | $ | 90 | $ | 168 | $ | 481 | ||||||||||||||||||||||||||||
| Provision for credit losses |
||||||||||||||||||||||||||||||||||||||||||||
| Transfers to stage 1 |
157 |
(153 |
) |
(4 |
) |
– |
99 | (97 | ) | (2 | ) | – | ||||||||||||||||||||||||||||||||
| Transfers to stage 2 |
(41 |
) |
49 |
(8 |
) |
– |
(23 | ) | 36 | (13 | ) | – | ||||||||||||||||||||||||||||||||
| Transfers to stage 3 |
(7 |
) |
(45 |
) |
52 |
– |
(5 | ) | (42 | ) | 47 | – | ||||||||||||||||||||||||||||||||
| Originations |
100 |
– |
– |
100 |
94 | – | – | 94 | ||||||||||||||||||||||||||||||||||||
| Maturities |
(25 |
) |
(29 |
) |
– |
(54 |
) |
(19 | ) | (17 | ) | – | (36 | ) | ||||||||||||||||||||||||||||||
| Changes in risk, parameters and exposures |
(123 |
) |
256 |
101 |
234 |
(155 | ) | 157 | 54 | 56 | ||||||||||||||||||||||||||||||||||
| Write-offs |
– |
– |
(20 |
) |
(20 |
) |
– | – | (23 | ) | (23 | ) | ||||||||||||||||||||||||||||||||
| Recoveries |
– |
– |
11 |
11 |
– | – | 13 | 13 | ||||||||||||||||||||||||||||||||||||
| Exchange rate and other |
– |
– |
(49 |
) |
(49 |
) |
1 | (1 | ) | (13 | ) | (13 | ) | |||||||||||||||||||||||||||||||
| Balance at end of period |
$ |
276 |
$ |
204 |
$ |
314 |
$ |
794 |
$ | 215 | $ | 126 | $ | 231 | $ | 572 | ||||||||||||||||||||||||||||
| Personal |
||||||||||||||||||||||||||||||||||||||||||||
| Balance at beginning of period |
$ |
305 |
$ |
966 |
$ |
211 |
$ |
1,482 |
$ | 280 | $ | 793 | $ | 155 | $ | 1,228 | ||||||||||||||||||||||||||||
| Provision for credit losses |
||||||||||||||||||||||||||||||||||||||||||||
| Transfers to stage 1 |
594 |
(593 |
) |
(1 |
) |
– |
537 | (537 | ) | – | – | |||||||||||||||||||||||||||||||||
| Transfers to stage 2 |
(96 |
) |
100 |
(4 |
) |
– |
(75 | ) | 78 | (3 | ) | – | ||||||||||||||||||||||||||||||||
| Transfers to stage 3 |
(4 |
) |
(163 |
) |
167 |
– |
(3 | ) | (130 | ) | 133 | – | ||||||||||||||||||||||||||||||||
| Originations |
105 |
– |
– |
105 |
116 | – | – | 116 | ||||||||||||||||||||||||||||||||||||
| Maturities |
(53 |
) |
(233 |
) |
(1 |
) |
(287 |
) |
(51 | ) | (186 | ) | – | (237 | ) | |||||||||||||||||||||||||||||
| Changes in risk, parameters and exposures |
(562 |
) |
1,040 |
660 |
1,138 |
(499 | ) | 947 | 550 | 998 | ||||||||||||||||||||||||||||||||||
| Write-offs |
– |
– |
(935 |
) |
(935 |
) |
– | – | (745 | ) | (745 | ) | ||||||||||||||||||||||||||||||||
| Recoveries |
– |
– |
156 |
156 |
– | – | 129 | 129 | ||||||||||||||||||||||||||||||||||||
| Exchange rate and other |
2 |
(2 |
) |
(20 |
) |
(20 |
) |
– | 1 | (8 | ) | (7 | ) | |||||||||||||||||||||||||||||||
| Balance at end of period |
$ |
291 |
$ |
1,115 |
$ |
233 |
$ |
1,639 |
$ | 305 | $ | 966 | $ | 211 | $ | 1,482 | ||||||||||||||||||||||||||||
| Credit cards |
||||||||||||||||||||||||||||||||||||||||||||
| Balance at beginning of period |
$ |
207 |
$ |
1,026 |
$ |
– |
$ |
1,233 |
$ | 203 | $ | 866 | $ | – | $ | 1,069 | ||||||||||||||||||||||||||||
| Provision for credit losses |
||||||||||||||||||||||||||||||||||||||||||||
| Transfers to stage 1 |
662 |
(662 |
) |
– |
– |
559 | (559 | ) | – | – | ||||||||||||||||||||||||||||||||||
| Transfers to stage 2 |
(112 |
) |
112 |
– |
– |
(111 | ) | 111 | – | – | ||||||||||||||||||||||||||||||||||
| Transfers to stage 3 |
(2 |
) |
(595 |
) |
597 |
– |
(2 | ) | (483 | ) | 485 | – | ||||||||||||||||||||||||||||||||
| Originations |
14 |
– |
– |
14 |
25 | – | – | 25 | ||||||||||||||||||||||||||||||||||||
| Maturities |
(4 |
) |
(56 |
) |
– |
(60 |
) |
(5 | ) | (48 | ) | – | (53 | ) | ||||||||||||||||||||||||||||||
| Changes in risk, parameters and exposures |
(546 |
) |
1,313 |
231 |
998 |
(465 | ) | 1,139 | 185 | 859 | ||||||||||||||||||||||||||||||||||
| Write-offs |
– |
– |
(1,010 |
) |
(1,010 |
) |
– | – | (892 | ) | (892 | ) | ||||||||||||||||||||||||||||||||
| Recoveries |
– |
– |
181 |
181 |
– | – | 223 | 223 | ||||||||||||||||||||||||||||||||||||
| Exchange rate and other |
(2 |
) |
1 |
1 |
– |
3 | – | (1 | ) | 2 | ||||||||||||||||||||||||||||||||||
| Balance at end of period |
$ |
217 |
$ |
1,139 |
$ |
– |
$ |
1,356 |
$ | 207 | $ | 1,026 | $ | – | $ | 1,233 | ||||||||||||||||||||||||||||
| Small business |
||||||||||||||||||||||||||||||||||||||||||||
| Balance at beginning of period |
$ |
80 |
$ |
86 |
$ |
106 |
$ |
272 |
$ | 70 | $ | 66 | $ | 58 | $ | 194 | ||||||||||||||||||||||||||||
| Provision for credit losses |
||||||||||||||||||||||||||||||||||||||||||||
| Transfers to stage 1 |
54 |
(54 |
) |
– |
– |
35 | (35 | ) | – | – | ||||||||||||||||||||||||||||||||||
| Transfers to stage 2 |
(23 |
) |
23 |
– |
– |
(20 | ) | 20 | – | – | ||||||||||||||||||||||||||||||||||
| Transfers to stage 3 |
(1 |
) |
(14 |
) |
15 |
– |
(1 | ) | (10 | ) | 11 | – | ||||||||||||||||||||||||||||||||
| Originations |
39 |
– |
– |
39 |
43 | – | – | 43 | ||||||||||||||||||||||||||||||||||||
| Maturities |
(19 |
) |
(24 |
) |
– |
(43 |
) |
(17 | ) | (21 | ) | – | (38 | ) | ||||||||||||||||||||||||||||||
| Changes in risk, parameters and exposures |
(41 |
) |
98 |
156 |
213 |
(31 | ) | 65 | 139 | 173 | ||||||||||||||||||||||||||||||||||
| Write-offs |
– |
– |
(124 |
) |
(124 |
) |
– | – | (98 | ) | (98 | ) | ||||||||||||||||||||||||||||||||
| Recoveries |
– |
– |
20 |
20 |
– | – | 14 | 14 | ||||||||||||||||||||||||||||||||||||
| Exchange rate and other |
6 |
2 |
(34 |
) |
(26 |
) |
1 | 1 | (18 | ) | (16 | ) | ||||||||||||||||||||||||||||||||
| Balance at end of period |
$ |
95 |
$ |
117 |
$ |
139 |
$ |
351 |
$ | 80 | $ | 86 | $ | 106 | $ | 272 | ||||||||||||||||||||||||||||
| Wholesale |
||||||||||||||||||||||||||||||||||||||||||||
| Balance at beginning of period |
$ |
787 |
$ |
1,038 |
$ |
968 |
$ |
2,793 |
$ | 774 | $ | 785 | $ | 767 | $ | 2,326 | ||||||||||||||||||||||||||||
| Provision for credit losses |
||||||||||||||||||||||||||||||||||||||||||||
| Transfers to stage 1 |
277 |
(275 |
) |
(2 |
) |
– |
284 | (282 | ) | (2 | ) | – | ||||||||||||||||||||||||||||||||
| Transfers to stage 2 |
(124 |
) |
133 |
(9 |
) |
– |
(152 | ) | 159 | (7 | ) | – | ||||||||||||||||||||||||||||||||
| Transfers to stage 3 |
(15 |
) |
(273 |
) |
288 |
– |
(9 | ) | (77 | ) | 86 | – | ||||||||||||||||||||||||||||||||
| Originations |
755 |
– |
– |
755 |
737 | – | – | 737 | ||||||||||||||||||||||||||||||||||||
| Maturities |
(543 |
) |
(418 |
) |
– |
(961 |
) |
(438 | ) | (379 | ) | – | (817 | ) | ||||||||||||||||||||||||||||||
| Changes in risk, parameters and exposures |
(243 |
) |
912 |
1,496 |
2,165 |
(407 | ) | 827 | 957 | 1,377 | ||||||||||||||||||||||||||||||||||
| Write-offs |
– |
– |
(1,237 |
) |
(1,237 |
) |
– | – | (763 | ) | (763 | ) | ||||||||||||||||||||||||||||||||
| Recoveries |
– |
– |
74 |
74 |
– | – | 63 | 63 | ||||||||||||||||||||||||||||||||||||
| Exchange rate and other |
2 |
6 |
(278 |
) |
(270 |
) |
(2 | ) | 5 | (133 | ) | (130 | ) | |||||||||||||||||||||||||||||||
| Balance at end of period |
$ |
896 |
$ |
1,123 |
$ |
1,300 |
$ |
3,319 |
$ | 787 | $ | 1,038 | $ | 968 | $ | 2,793 | ||||||||||||||||||||||||||||
| • | Changes in the credit quality of the borrower or instrument, primarily reflected in changes in internal risk ratings; |
| • | Changes in forward-looking macroeconomic conditions, specifically the macroeconomic variables to which our models are calibrated, which are those most closely correlated with credit losses in the relevant portfolio; |
| • | Changes in scenario design and the weight assigned to each scenario; and |
| • | Transfers between stages, which can be triggered by changes to any of the above inputs. |
Note 5 Loans and allowance for credit losses (continued) |
| • | Unemployment rates |
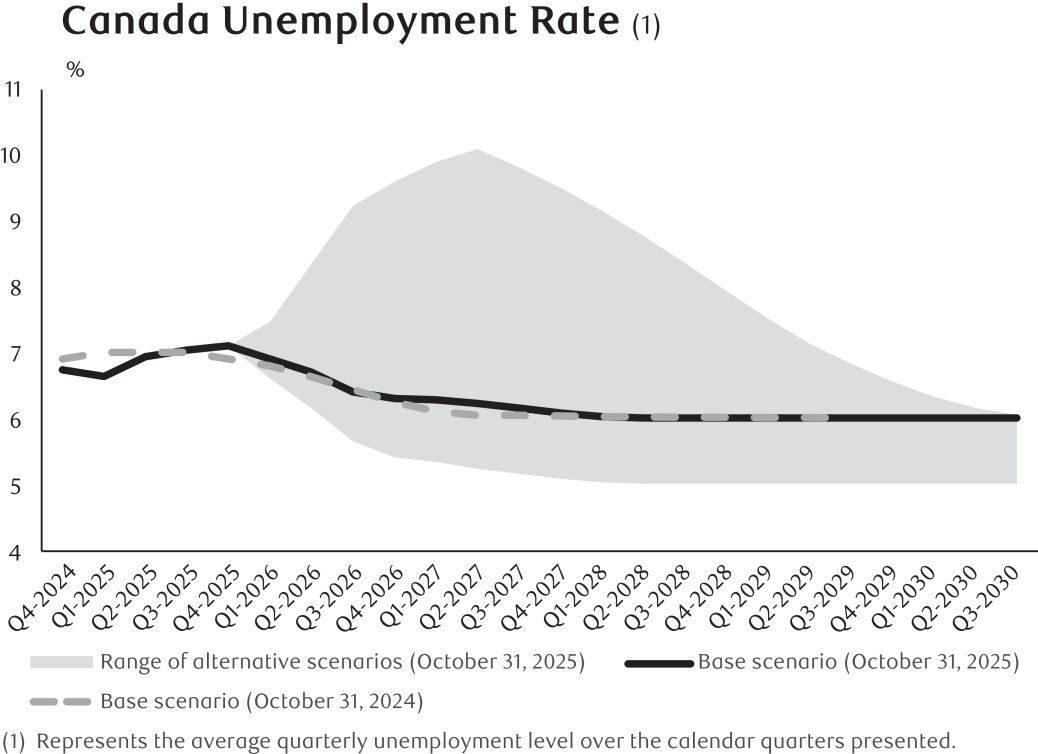 |
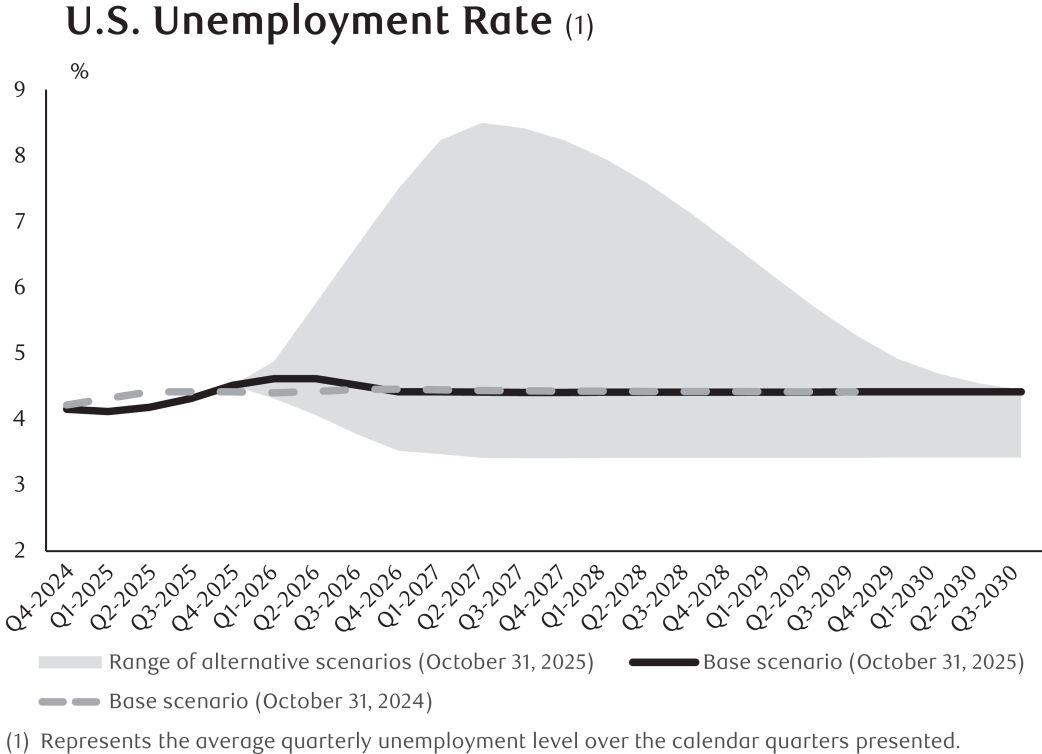 |
| • | Gross Domestic Product (GDP) |
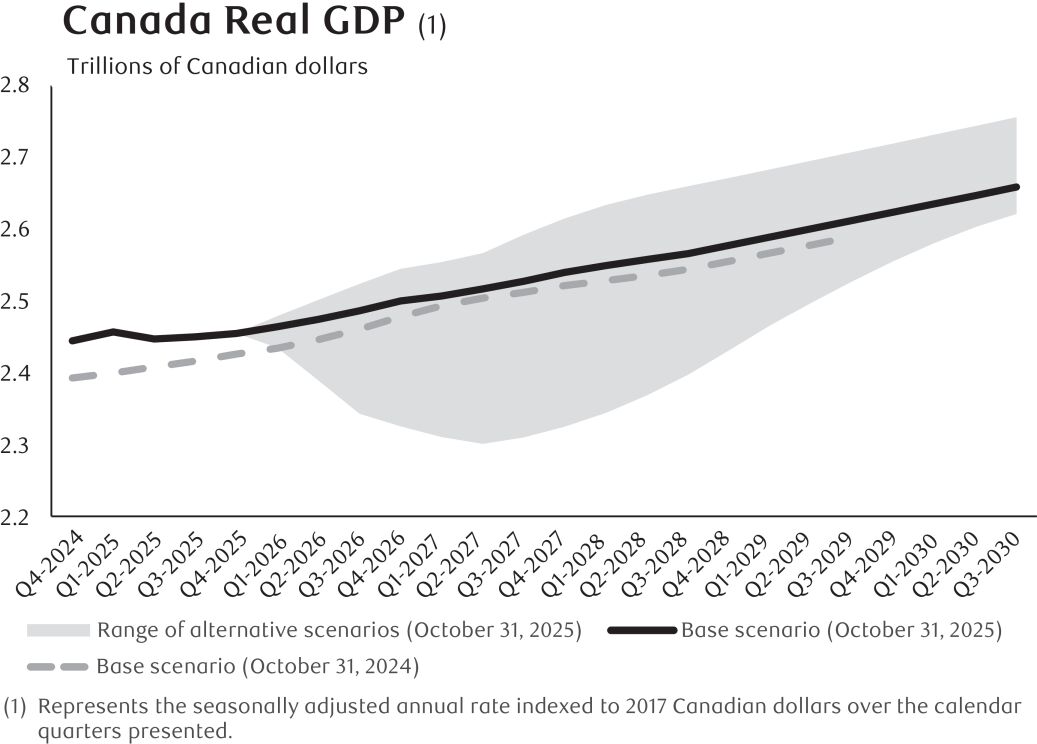 |
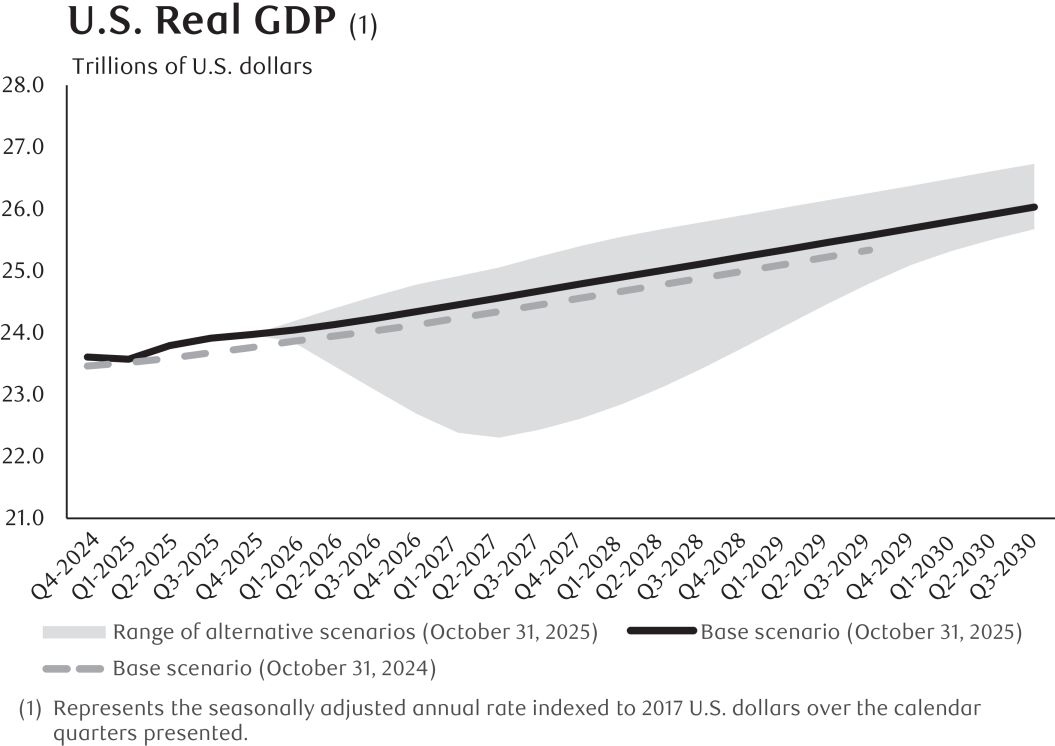 |
| • | Canadian housing price index |
| As at | ||||||||||||||||||||||||||||
October 31, 2025 |
October 31, 2024 | |||||||||||||||||||||||||||
| (Millions of Canadian dollars) | ACL – All performing loans in Stage 1 |
Impact of staging |
Stage 1 and 2 ACL |
ACL – All performing loans in Stage 1 |
Impact of staging |
Stage 1 and 2 ACL |
||||||||||||||||||||||
| Performing loans (1) |
$ 3,775 |
$ 1,698 |
$ 5,473 |
$ 3,313 | $ 1,523 | $ 4,836 | ||||||||||||||||||||||
| (1) | Represents loans and commitments in Stage 1 and Stage 2. |
| Note 5 Loans and allowance for credit losses (continued) |
As at |
||||||||||||||||||||||||||||||||||||
October 31, 2025 |
October 31, 2024 |
|||||||||||||||||||||||||||||||||||
(Millions of Canadian dollars) |
Stage 1 |
Stage 2 |
Stage 3 |
Total |
Stage 1 |
Stage 2 |
Stage 3 (1), (2) |
Total |
||||||||||||||||||||||||||||
| Retail |
||||||||||||||||||||||||||||||||||||
| Loans outstanding – Residential mortgages |
||||||||||||||||||||||||||||||||||||
| Low risk |
$ |
386,060 |
$ |
16,495 |
$ |
– |
$ |
402,555 |
$ | 388,742 | $ | 1,354 | $ | – | $ | 390,096 | ||||||||||||||||||||
| Medium risk |
20,622 |
2,571 |
– |
23,193 |
18,419 | 4,479 | – | 22,898 | ||||||||||||||||||||||||||||
| High risk |
2,131 |
6,532 |
– |
8,663 |
1,761 | 6,593 | – | 8,354 | ||||||||||||||||||||||||||||
| Not rated (3) |
54,253 |
1,940 |
– |
56,193 |
52,569 | 1,479 | – | 54,048 | ||||||||||||||||||||||||||||
| Impaired |
– |
– |
1,681 |
1,681 |
– | – | 1,233 | 1,233 | ||||||||||||||||||||||||||||
463,066 |
27,538 |
1,681 |
492,285 |
461,491 | 13,905 | 1,233 | 476,629 | |||||||||||||||||||||||||||||
| Items not subject to impairment (4) |
1,128 |
915 | ||||||||||||||||||||||||||||||||||
| Total |
$ |
493,413 |
$ | 477,544 | ||||||||||||||||||||||||||||||||
| Loans outstanding – Personal |
||||||||||||||||||||||||||||||||||||
| Low risk |
$ |
87,536 |
$ |
2,712 |
$ |
– |
$ |
90,248 |
$ | 82,904 | $ | 1,680 | $ | – | $ | 84,584 | ||||||||||||||||||||
| Medium risk |
4,035 |
3,768 |
– |
7,803 |
5,525 | 3,063 | – | 8,588 | ||||||||||||||||||||||||||||
| High risk |
601 |
2,583 |
– |
3,184 |
592 | 2,365 | – | 2,957 | ||||||||||||||||||||||||||||
| Not rated (3) |
12,493 |
1,180 |
– |
13,673 |
11,303 | 498 | – | 11,801 | ||||||||||||||||||||||||||||
| Impaired |
– |
– |
437 |
437 |
– | – | 408 | 408 | ||||||||||||||||||||||||||||
| Total |
$ |
104,665 |
$ |
10,243 |
$ |
437 |
$ |
115,345 |
$ | 100,324 | $ | 7,606 | $ | 408 | $ | 108,338 | ||||||||||||||||||||
| Loans outstanding – Credit cards |
||||||||||||||||||||||||||||||||||||
| Low risk |
$ |
18,279 |
$ |
161 |
$ |
– |
$ |
18,440 |
$ | 17,363 | $ | 177 | $ | – | $ | 17,540 | ||||||||||||||||||||
| Medium risk |
2,123 |
2,291 |
– |
4,414 |
1,999 | 2,436 | – | 4,435 | ||||||||||||||||||||||||||||
| High risk |
70 |
2,423 |
– |
2,493 |
75 | 2,289 | – | 2,364 | ||||||||||||||||||||||||||||
| Not rated (3) |
1,133 |
309 |
– |
1,442 |
1,173 | 53 | – | 1,226 | ||||||||||||||||||||||||||||
| Total |
$ |
21,605 |
$ |
5,184 |
$ |
– |
$ |
26,789 |
$ | 20,610 | $ | 4,955 | $ | – | $ | 25,565 | ||||||||||||||||||||
| Loans outstanding – Small business |
||||||||||||||||||||||||||||||||||||
| Low risk |
$ |
10,628 |
$ |
595 |
$ |
– |
$ |
11,223 |
$ | 9,428 | $ | 773 | $ | – | $ | 10,201 | ||||||||||||||||||||
| Medium risk |
2,550 |
924 |
– |
3,474 |
2,740 | 962 | – | 3,702 | ||||||||||||||||||||||||||||
| High risk |
259 |
1,422 |
– |
1,681 |
214 | 1,086 | – | 1,300 | ||||||||||||||||||||||||||||
| Not rated (3) |
8 |
– |
– |
8 |
7 | – | – | 7 | ||||||||||||||||||||||||||||
| Impaired |
– |
– |
411 |
411 |
– | – | 321 | 321 | ||||||||||||||||||||||||||||
| Total |
$ |
13,445 |
$ |
2,941 |
$ |
411 |
$ |
16,797 |
$ | 12,389 | $ | 2,821 | $ | 321 | $ | 15,531 | ||||||||||||||||||||
| Undrawn loan commitments – Retail |
||||||||||||||||||||||||||||||||||||
| Low risk |
$ |
293,300 |
$ |
3,700 |
$ |
– |
$ |
297,000 |
$ | 284,036 | $ | 592 | $ | – | $ | 284,628 | ||||||||||||||||||||
| Medium risk |
12,451 |
427 |
– |
12,878 |
12,110 | 381 | – | 12,491 | ||||||||||||||||||||||||||||
| High risk |
805 |
758 |
– |
1,563 |
746 | 602 | – | 1,348 | ||||||||||||||||||||||||||||
| Not rated (3) |
13,964 |
274 |
– |
14,238 |
10,715 | 88 | – | 10,803 | ||||||||||||||||||||||||||||
| Total |
$ |
320,520 |
$ |
5,159 |
$ |
– |
$ |
325,679 |
$ | 307,607 | $ | 1,663 | $ | – | $ | 309,270 | ||||||||||||||||||||
| Wholesale – Loans outstanding |
||||||||||||||||||||||||||||||||||||
| Investment grade |
$ |
130,322 |
$ |
2,117 |
$ |
– |
$ |
132,439 |
$ | 116,549 | $ | 1,471 | $ | – | $ | 118,020 | ||||||||||||||||||||
| Non-investment grade |
207,239 |
26,399 |
– |
233,638 |
189,889 | 26,826 | – | 216,715 | ||||||||||||||||||||||||||||
| Not rated (3) |
14,714 |
503 |
– |
15,217 |
12,871 | 721 | – | 13,592 | ||||||||||||||||||||||||||||
| Impaired |
– |
– |
6,153 |
6,153 |
– | – | 3,905 | 3,905 | ||||||||||||||||||||||||||||
352,275 |
29,019 |
6,153 |
387,447 |
319,309 | 29,018 | 3,905 | 352,232 | |||||||||||||||||||||||||||||
| Items not subject to impairment (4) |
9,724 |
8,207 | ||||||||||||||||||||||||||||||||||
| Total |
$ |
397,171 |
$ | 360,439 | ||||||||||||||||||||||||||||||||
| Undrawn loan commitments – Wholesale |
||||||||||||||||||||||||||||||||||||
| Investment grade |
$ |
393,167 |
$ |
1,593 |
$ |
– |
$ |
394,760 |
$ | 345,236 | $ | 516 | $ | – | $ | 345,752 | ||||||||||||||||||||
| Non-investment grade |
182,223 |
16,158 |
– |
198,381 |
170,212 | 14,512 | – | 184,724 | ||||||||||||||||||||||||||||
| Not rated (3) |
1,407 |
21 |
– |
1,428 |
3,290 | 17 | – | 3,307 | ||||||||||||||||||||||||||||
| Total |
$ |
576,797 |
$ |
17,772 |
$ |
– |
$ |
594,569 |
$ | 518,738 | $ | 15,045 | $ | – | $ | 533,783 | ||||||||||||||||||||
| (1) | As at October 31, 2025, 91% of credit-impaired loans were either fully or partially collateralized (October 31, 2024 – 88%). For details on the types of collateral held against credit-impaired assets and our policies on collateral, refer to the Credit risk mitigation section of Management’s Discussion and Analysis. |
| (2) | Includes $195 million of purchased or originated credit-impaired loans (October 31, 2024 – $109 million). |
| (3) | In certain cases where an internal risk rating is not assigned, we use other approved credit risk assessments or rating methodologies, policies and tools to manage our credit risk. |
| (4) | Items not subject to impairment are loans held at FVTPL. |
As at |
||||||||||||||||||||||||||
October 31, 2025 |
October 31, 2024 |
|||||||||||||||||||||||||
(Millions of Canadian dollars) |
30 to 89 days |
90 days and greater |
Total |
30 to 89 days |
90 days and greater |
Total |
||||||||||||||||||||
| Retail |
$ |
2,634 |
$ |
323 |
$ |
2,957 |
$ | 2,542 | $ | 263 | $ | 2,805 | ||||||||||||||
| Wholesale |
1,143 |
7 |
1,150 |
1,454 | 4 | 1,458 | ||||||||||||||||||||
$ |
3,777 |
$ |
330 |
$ |
4,107 |
$ | 3,996 | $ | 267 | $ | 4,263 | |||||||||||||||
| (1) | Excludes loans less than 30 days past due as they are not generally representative of the borrowers’ ability to meet their payment obligations. |
| (2) | Amounts presented may include loans past due as a result of administrative processes, such as mortgage loans on which payments are restrained pending payout due to sale or refinancing. Past due loans arising from administrative processes are not representative of the borrowers’ ability to meet their payment obligations. |
| Note 6 Significant acquisition |
(Millions of Canadian dollars, except percentage amounts) |
||||
| Percentage of shares acquired |
100% |
|||
| Purchase consideration |
$ |
15,488 |
||
| Fair value of identifiable assets acquired |
||||
| Cash and due from banks |
$ |
2,772 |
||
| Securities |
| |||
| Trading |
1,110 |
|||
| Investment |
21,305 |
|||
| Loans (1) |
| |||
| Retail (2) |
35,351 |
|||
| Wholesale |
39,282 |
|||
| Derivatives |
3,365 |
|||
| Intangible assets (3) |
2,342 |
|||
| Other (4) |
2,570 |
|||
| Total fair value of identifiable assets acquired |
$ |
108,097 |
||
| Fair value of identifiable liabilities assumed |
||||
| Deposits |
| |||
| Personal |
$ |
42,037 |
||
| Business and government (2) |
44,211 |
|||
| Obligations related to assets sold under repurchase agreements and securities loaned |
5,664 |
|||
| Derivatives |
3,541 |
|||
| Other (5) |
3,692 |
|||
| Total fair value of identifiable liabilities assumed |
$ |
99,145 |
||
| Fair value of identifiable net assets acquired |
$ |
8,952 |
||
| Goodwill |
6,536 |
|||
| Total purchase consideration |
$ |
15,488 |
||
| (1) | The fair value of loans reflects estimates of incurred and expected future credit losses as at the acquisition date and interest rate premiums or discounts relative to prevailing market rates. As at March 28, 2024, the gross contractual value of the loans was $75,752 million. The estimate of contractual cash flows not expected to be collected was $575 million, of which $135 million related to purchased credit-impaired loans. |
| (2) | Loans – Retail includes $1.7 billion of Canadian residential mortgages sold with recourse to a mutual fund that do not qualify for derecognition, and Deposits – Business and government includes $1.7 billion of the related secured borrowing liability. |
| (3) | Intangible assets include $1,972 million of core deposit intangibles and $111 million of customer relationships, which are amortized on a straight-line basis over estimated useful lives of 7 years, and $259 million of mutual fund management contracts with indefinite useful lives. |
| (4) | Includes Assets purchased under reverse repurchase agreements and securities borrowed and Other assets. |
| (5) | Includes Obligations related to securities sold short and Other liabilities. |
| Note 6 Significant acquisition (continued) |
| Note 7 Derecognition of financial assets |
As at |
||||||||||||||||||||||||||||||||||
October 31, 2025 |
October 31, 2024 |
|||||||||||||||||||||||||||||||||
(Millions of Canadian dollars) |
Canadian residential mortgage loans (1), (2) |
Securities sold under repurchase agreements (3) |
Securities loaned (3) |
Total |
Canadian residential mortgage loans (1), (2) |
Securities sold under repurchase agreements (3) |
Securities loaned (3) |
Total |
||||||||||||||||||||||||||
| Carrying amount of transferred assets that do not qualify for derecognition |
$ |
28,604 |
$ |
276,163 |
$ |
13,353 |
$ |
318,120 |
$ | 33,101 | $ | 291,543 | $ | 13,778 | $ | 338,422 | ||||||||||||||||||
| Carrying amount of associated liabilities |
27,900 |
276,163 |
13,353 |
317,416 |
31,522 | 291,543 | 13,778 | 336,843 | ||||||||||||||||||||||||||
| Fair value of transferred assets |
$ |
28,137 |
$ |
276,163 |
$ |
13,353 |
$ |
317,653 |
$ | 31,760 | $ | 291,543 | $ | 13,778 | $ | 337,081 | ||||||||||||||||||
| Fair value of associated liabilities |
28,275 |
276,163 |
13,353 |
317,791 |
31,445 | 291,543 | 13,778 | 336,766 | ||||||||||||||||||||||||||
| Fair value of net position |
$ |
(138 |
) |
$ |
– |
$ |
– |
$ |
(138 |
) |
$ | 315 | $ | – | $ | – | $ | 315 | ||||||||||||||||
| (1) | Includes Canadian residential mortgage loans transferred primarily to Canada Housing Trust at the initial securitization and other permitted investments used for funding requirements after the initial securitization, as well as Canadian residential mortgages transferred into the RBC Indigo Mortgage Fund. |
| (2) | CMB investors have legal recourse only to the transferred assets, and do not have recourse to our general assets. |
| (3) | Does not include over-collateralization of assets pledged. |
| Note 8 Structured entities |
| Note 8 Structured entities (continued) |
As at October 31, 2025 |
||||||||||||||||||||||||
(Millions of Canadian dollars) |
Multi-seller conduits (1) |
Structured finance |
Non-RBC managed investment funds |
Third-party securitization vehicles |
Other |
Total |
||||||||||||||||||
| On-balance sheet assets |
||||||||||||||||||||||||
| Securities |
$ |
3 |
$ |
– |
$ |
2,753 |
$ |
– |
$ |
1,187 |
$ |
3,943 |
||||||||||||
| Loans |
209 |
12,386 |
– |
16,673 |
2,161 |
31,429 |
||||||||||||||||||
| Derivatives |
23 |
– |
– |
– |
217 |
240 |
||||||||||||||||||
| Other assets |
– |
– |
– |
– |
747 |
747 |
||||||||||||||||||
$ |
235 |
$ |
12,386 |
$ |
2,753 |
$ |
16,673 |
$ |
4,312 |
$ |
36,359 |
|||||||||||||
| On-balance sheet liabilities |
||||||||||||||||||||||||
| Deposits |
$ |
– |
$ |
– |
$ |
– |
$ |
– |
$ |
5 |
$ |
5 |
||||||||||||
| Derivatives |
281 |
– |
3 |
– |
22 |
306 |
||||||||||||||||||
| Other liabilities |
– |
– |
– |
– |
– |
– |
||||||||||||||||||
$ |
281 |
$ |
– |
$ |
3 |
$ |
– |
$ |
27 |
$ |
311 |
|||||||||||||
| Maximum exposure to loss (2) |
$ |
64,591 |
$ |
19,672 |
$ |
3,710 |
$ |
26,094 |
$ |
7,796 |
$ |
121,863 |
||||||||||||
| Total assets of unconsolidated structured entities |
$ |
63,306 |
$ |
54,840 |
$ |
515,340 |
$ |
161,430 |
$ |
961,750 |
$ |
1,756,666 |
||||||||||||
| As at October 31, 2024 | ||||||||||||||||||||||||
| (Millions of Canadian dollars) | Multi-seller conduits (1) |
Structured finance |
Non-RBC managed investment funds |
Third-party securitization vehicles |
Other | Total | ||||||||||||||||||
| On-balance sheet assets |
||||||||||||||||||||||||
| Securities |
$ | 1 | $ | – | $ | 2,541 | $ | – | $ | 1,384 | $ | 3,926 | ||||||||||||
| Loans |
236 | 6,688 | – | 12,788 | 1,805 | 21,517 | ||||||||||||||||||
| Derivatives |
32 | – | – | – | 98 | 130 | ||||||||||||||||||
| Other assets |
– | – | – | – | 455 | 455 | ||||||||||||||||||
| $ | 269 | $ | 6,688 | $ | 2,541 | $ | 12,788 | $ | 3,742 | $ | 26,028 | |||||||||||||
| On-balance sheet liabilities |
||||||||||||||||||||||||
| Deposits |
$ | – | $ | – | $ | – | $ | – | $ | 167 | $ | 167 | ||||||||||||
| Derivatives |
115 | – | 3 | – | 4 | 122 | ||||||||||||||||||
| Other liabilities |
– | – | – | – | 7 | 7 | ||||||||||||||||||
| $ | 115 | $ | – | $ | 3 | $ | – | $ | 178 | $ | 296 | |||||||||||||
| Maximum exposure to loss (2) |
$ | 56,779 | $ | 12,963 | $ | 3,487 | $ | 21,195 | $ | 6,248 | $ | 100,672 | ||||||||||||
| Total assets of unconsolidated structured entities |
$ | 55,639 | $ | 45,315 | $ | 459,976 | $ | 119,766 | $ | 798,228 | $ | 1,478,924 | ||||||||||||
| (1) | Total assets of unconsolidated structured entities represent the maximum assets that may have to be purchased by the conduits under purchase commitments outstanding. Of the purchase commitments outstanding, the conduits have purchased financial assets totalling $43 b illion as at October 31, 2025 (October 31, 2024 – $37 billion). |
(2) |
The maximum exposure to loss resulting from our interests in these entities consists mostly of investments, loans, fair value of derivatives, liquidity and credit enhancement facilities. The maximum exposure to loss of the multi-seller conduits is higher than the on-balance sheet assets primarily because of the notional amounts of the backstop liquidity and credit enhancement facilities. Refer to Note 23 for further details. |
| Note 8 Structured entities (continued) |
| Note 9 Derivative financial instruments and hedging activities |
| Note 9 Derivative financial instruments and hedging activities (continued) |
As at October 31, 2025 |
||||||||||||||||||||||||
Term to maturity |
||||||||||||||||||||||||
(Millions of Canadian dollars) |
Within 1 year |
1 through 5 years |
Over 5 years |
Total |
Trading |
Other than Trading |
||||||||||||||||||
| Over-the-counter contracts |
||||||||||||||||||||||||
| Interest rate contracts |
||||||||||||||||||||||||
| Forward rate agreements |
$ |
1,920,284 |
$ |
1,292,557 |
$ |
11,515 |
$ |
3,224,356 |
$ |
3,224,356 |
$ |
– |
||||||||||||
| Swaps |
7,198,664 |
9,391,086 |
6,401,414 |
22,991,164 |
21,509,530 |
1,481,634 |
||||||||||||||||||
| Options purchased |
553,914 |
431,667 |
189,250 |
1,174,831 |
1,174,715 |
116 |
||||||||||||||||||
| Options written |
493,070 |
445,756 |
207,892 |
1,146,718 |
1,146,491 |
227 |
||||||||||||||||||
| Foreign exchange contracts |
||||||||||||||||||||||||
| Forward contracts |
3,184,117 |
151,308 |
9,319 |
3,344,744 |
3,192,939 |
151,805 |
||||||||||||||||||
| Cross currency swaps |
22,869 |
121,493 |
101,765 |
246,127 |
238,380 |
7,747 |
||||||||||||||||||
| Cross currency interest rate swaps |
1,575,261 |
2,557,260 |
1,395,392 |
5,527,913 |
5,452,212 |
75,701 |
||||||||||||||||||
| Options purchased |
656,329 |
118,521 |
1,734 |
776,584 |
776,175 |
409 |
||||||||||||||||||
| Options written |
667,756 |
107,799 |
1,163 |
776,718 |
776,716 |
2 |
||||||||||||||||||
| Credit derivatives (2) |
11,069 |
267,007 |
145,178 |
423,254 |
422,213 |
1,041 |
||||||||||||||||||
| Other contracts (3) |
572,876 |
213,935 |
26,947 |
813,758 |
796,157 |
17,601 |
||||||||||||||||||
| Exchange-traded contracts |
||||||||||||||||||||||||
| Interest rate contracts |
||||||||||||||||||||||||
| Futures – long positions |
263,750 |
155,590 |
2,614 |
421,954 |
421,954 |
– |
||||||||||||||||||
| Futures – short positions |
660,032 |
159,865 |
2,739 |
822,636 |
822,333 |
303 |
||||||||||||||||||
| Options purchased |
47,629 |
5,684 |
– |
53,313 |
53,313 |
– |
||||||||||||||||||
| Options written |
65,477 |
10,429 |
– |
75,906 |
75,906 |
– |
||||||||||||||||||
| Foreign exchange contracts |
||||||||||||||||||||||||
| Futures – long positions |
15 |
– |
– |
15 |
15 |
– |
||||||||||||||||||
| Other contracts |
714,199 |
190,536 |
28,799 |
933,534 |
933,534 |
– |
||||||||||||||||||
$ |
18,607,311 |
$ |
15,620,493 |
$ |
8,525,721 |
$ |
42,753,525 |
$ |
41,016,939 |
$ |
1,736,586 |
|||||||||||||
| |
||||||||||||||||||||||||
| As at October 31, 2024 | ||||||||||||||||||||||||
| Term to maturity | ||||||||||||||||||||||||
(Millions of Canadian dollars) |
Within 1 year |
1 through 5 years |
Over 5 years |
Total | Trading | Other than Trading |
||||||||||||||||||
| Over-the-counter contracts |
||||||||||||||||||||||||
| Interest rate contracts |
||||||||||||||||||||||||
| Forward rate agreements |
$ | 1,097,367 | $ | 672,436 | $ | 7,017 | $ | 1,776,820 | $ | 1,776,820 | $ | – | ||||||||||||
| Swaps |
6,181,369 | 8,714,891 | 5,597,447 | 20,493,707 | 19,291,405 | 1,202,302 | ||||||||||||||||||
| Options purchased |
206,649 | 407,730 | 155,843 | 770,222 | 770,181 | 41 | ||||||||||||||||||
| Options written |
217,379 | 384,448 | 179,408 | 781,235 | 781,113 | 122 | ||||||||||||||||||
| Foreign exchange contracts |
||||||||||||||||||||||||
| Forward contracts |
2,939,019 | 136,442 | 7,465 | 3,082,926 | 2,966,914 | 116,012 | ||||||||||||||||||
| Cross currency swaps |
23,204 | 108,912 | 75,843 | 207,959 | 199,481 | 8,478 | ||||||||||||||||||
| Cross currency interest rate swaps |
1,298,173 | 2,544,878 | 1,380,858 | 5,223,909 | 5,168,677 | 55,232 | ||||||||||||||||||
| Options purchased |
475,980 | 75,804 | 2,015 | 553,799 | 553,799 | – | ||||||||||||||||||
| Options written |
488,878 | 66,828 | 983 | 556,689 | 556,689 | – | ||||||||||||||||||
| Credit derivatives (2) |
4,055 | 135,505 | 118,732 | 258,292 | 257,333 | 959 | ||||||||||||||||||
| Other contracts (3) |
389,424 | 149,475 | 10,122 | 549,021 | 538,604 | 10,417 | ||||||||||||||||||
| Exchange-traded contracts |
||||||||||||||||||||||||
| Interest rate contracts |
||||||||||||||||||||||||
| Futures – long positions |
93,985 | 45,015 | 56 | 139,056 | 139,056 | – | ||||||||||||||||||
| Futures – short positions |
114,425 | 64,759 | 301 | 179,485 | 179,244 | 241 | ||||||||||||||||||
| Options purchased |
7,075 | 991 | – | 8,066 | 8,066 | – | ||||||||||||||||||
| Options written |
2,262 | 14 | – | 2,276 | 2,276 | – | ||||||||||||||||||
| Foreign exchange contracts |
||||||||||||||||||||||||
| Futures – long positions |
1 | – | – | 1 | 1 | – | ||||||||||||||||||
| Other contracts |
367,023 | 68,132 | 2,574 | 437,729 | 437,729 | – | ||||||||||||||||||
| $ | 13,906,268 | $ | 13,576,260 | $ | 7,538,664 | $ | 35,021,192 | $ | 33,627,388 | $ | 1,393,804 | |||||||||||||
(1) |
The derivative notional amounts are determined using the standardized approach for measuring counterparty credit risk (SA-CCR) in accordance with the Capital Adequacy Requirements (CAR). |
(2) |
Credit derivatives with a notional value of $ 1 billion (October 31, 2024 – $1 billion) are economic hedges. Trading credit derivatives comprise protection purchased of $218 billion (October 31, 2024 – $135 billion) and protection sold of $204 billion (October 31, 2024 – $122 billion). |
(3) |
Other contracts exclude loan underwriting commitments of $ 8 billion (October 31, 2024 – $3 billion), which are not classified as derivatives under CAR guidelines. |
| Note 9 Derivative financial instruments and hedging activities (continued) |
| As at | ||||||||||||||||||
October 31, 2025 |
October 31, 2024 | |||||||||||||||||
(Millions of Canadian dollars) |
Positive |
Negative |
Positive | Negative | ||||||||||||||
| Held or issued for trading purposes |
||||||||||||||||||
| Interest rate contracts |
||||||||||||||||||
| Forward rate agreements |
$ |
112 |
$ |
153 |
$ | 147 | $ | 68 | ||||||||||
| Swaps |
20,887 |
15,644 |
21,155 | 16,482 | ||||||||||||||
| Options purchased |
4,872 |
– |
5,556 | – | ||||||||||||||
| Options written |
– |
5,330 |
– | 6,049 | ||||||||||||||
25,871 |
21,127 |
26,858 | 22,599 | |||||||||||||||
| Foreign exchange contracts |
||||||||||||||||||
| Forward contracts |
27,599 |
22,562 |
26,339 | 23,758 | ||||||||||||||
| Cross currency swaps |
9,202 |
5,545 |
7,316 | 4,912 | ||||||||||||||
| Cross currency interest rate swaps |
55,475 |
61,017 |
60,105 | 59,733 | ||||||||||||||
| Options purchased |
3,382 |
– |
2,407 | – | ||||||||||||||
| Options written |
– |
2,577 |
– | 1,800 | ||||||||||||||
95,658 |
91,701 |
96,167 | 90,203 | |||||||||||||||
| Credit derivatives |
349 |
258 |
270 | 216 | ||||||||||||||
| Other contracts |
52,988 |
69,249 |
26,325 | 46,420 | ||||||||||||||
174,866 |
182,335 |
149,620 | 159,438 | |||||||||||||||
| Held or issued for other-than-trading purposes |
||||||||||||||||||
| Interest rate contracts |
||||||||||||||||||
| Swaps |
293 |
453 |
1,215 | 3,100 | ||||||||||||||
293 |
453 |
1,215 | 3,100 | |||||||||||||||
| Foreign exchange contracts |
||||||||||||||||||
| Forward contracts |
2,311 |
1,929 |
1,235 | 682 | ||||||||||||||
| Cross currency swaps |
482 |
73 |
207 | 46 | ||||||||||||||
| Cross currency interest rate swaps |
2,255 |
1,388 |
874 | 2,287 | ||||||||||||||
5,048 |
3,390 |
2,316 | 3,015 | |||||||||||||||
| Credit derivatives |
3 |
4 |
3 | 2 | ||||||||||||||
| Other contracts |
143 |
61 |
79 | 77 | ||||||||||||||
5,487 |
3,908 |
3,613 | 6,194 | |||||||||||||||
| Total gross fair values before: |
180,353 |
186,243 |
153,233 | 165,632 | ||||||||||||||
| Valuation adjustments determined on a pooled basis |
(1,080 |
) |
(223 |
) |
(1,053 | ) | (301 | ) | ||||||||||
| Impact of netting agreements that qualify for balance sheet offset |
(2,067 |
) |
(2,067 |
) |
(1,568 | ) | (1,568 | ) | ||||||||||
$ |
177,206 |
$ |
183,953 |
$ | 150,612 | $ | 163,763 | |||||||||||
| (1) | The fair value reflects the impact of characterizing the daily variation margin as settlement of the related derivative fair values as permitted by certain central counterparties. |
| As at | ||||||||||||||||||||||||||||||||||
October 31, 2025 |
October 31, 2024 | |||||||||||||||||||||||||||||||||
(Millions of Canadian dollars) |
Less than 1 year |
1 through 5 years |
Over 5 years |
Total |
Less than 1 year |
1 through 5 years |
Over 5 years |
Total | ||||||||||||||||||||||||||
| Derivative assets |
$ |
73,626 |
56,086 |
47,494 |
$ |
177,206 |
$ | 54,660 | 48,765 | 47,187 | $ | 150,612 | ||||||||||||||||||||||
| Derivative liabilities |
79,691 |
57,630 |
46,632 |
183,953 |
67,886 | 51,170 | 44,707 | 163,763 | ||||||||||||||||||||||||||
| (1) | The fair value reflects the impact of characterizing the daily variation margin as settlement of the related derivative fair values as permitted by certain central counterparties. |
As at |
||||||||||||||||||||||||||||
October 31, 2025 |
October 31, 2024 |
|||||||||||||||||||||||||||
(Millions of Canadian dollars) |
Replacement cost |
Credit equivalent amount |
Risk-weighted equivalent (2) |
Replacement cost |
Credit equivalent amount |
Risk-weighted equivalent (2) |
||||||||||||||||||||||
| Over-the-counter contracts |
||||||||||||||||||||||||||||
| Interest rate contracts |
||||||||||||||||||||||||||||
| Forward rate agreements |
$ |
43 |
$ |
700 |
$ |
136 |
$ | 8 | $ | 231 | $ | 43 | ||||||||||||||||
| Swaps |
7,674 |
20,723 |
3,045 |
6,926 | 17,760 | 2,747 | ||||||||||||||||||||||
| Options purchased |
90 |
752 |
147 |
317 | 859 | 135 | ||||||||||||||||||||||
| Options written |
62 |
474 |
137 |
49 | 398 | 104 | ||||||||||||||||||||||
| Foreign exchange contracts |
||||||||||||||||||||||||||||
| Forward contracts |
7,412 |
35,560 |
6,425 |
8,077 | 33,908 | 6,693 | ||||||||||||||||||||||
| Swaps |
3,432 |
21,172 |
2,730 |
3,915 | 21,709 | 2,703 | ||||||||||||||||||||||
| Options purchased |
871 |
2,614 |
665 |
877 | 2,315 | 587 | ||||||||||||||||||||||
| Options written |
136 |
611 |
128 |
117 | 476 | 98 | ||||||||||||||||||||||
| Credit derivatives |
838 |
2,614 |
132 |
608 | 2,336 | 191 | ||||||||||||||||||||||
| Other contracts |
1,446 |
24,385 |
4,915 |
1,773 | 20,981 | 4,756 | ||||||||||||||||||||||
| Exchange-traded contracts |
12,034 |
24,367 |
508 |
10,084 | 19,023 | 380 | ||||||||||||||||||||||
$ |
34,038 |
$ |
133,972 |
$ |
18,968 |
$ | 32,751 | $ | 119,996 | $ | 18,437 | |||||||||||||||||
| (1) | The amounts presented are net of master netting agreements in accordance with CAR guidelines. |
| (2) | The risk-weighted balances are calculated in accordance with CAR guidelines and exclude CVA of $20 billion (October 31, 2024 – $18 billion). |
As at October 31, 2025 |
||||||||||||||||||||||||||||||||||||
Risk rating (1) |
Counterparty type (2) |
|||||||||||||||||||||||||||||||||||
(Millions of Canadian dollars) |
AAA, AA |
A |
BBB |
BB or lower |
Total |
Banks |
OECD governments |
Other |
Total |
|||||||||||||||||||||||||||
| Gross positive fair values |
$ |
28,649 |
$ |
85,952 |
$ |
28,251 |
$ |
37,501 |
$ |
180,353 |
$ |
75,797 |
$ |
44,072 |
$ |
60,484 |
$ |
180,353 |
||||||||||||||||||
| Impact of master netting agreements and applicable margins |
15,681 |
76,267 |
21,738 |
32,629 |
146,315 |
74,434 |
43,386 |
28,495 |
146,315 |
|||||||||||||||||||||||||||
| Replacement cost (after netting agreements) |
$ |
12,968 |
$ |
9,685 |
$ |
6,513 |
$ |
4,872 |
$ |
34,038 |
$ |
1,363 |
$ |
686 |
$ |
31,989 |
$ |
34,038 |
||||||||||||||||||
| As at October 31, 2024 | ||||||||||||||||||||||||||||||||||||
| Risk rating (1) |
Counterparty type (2) |
|||||||||||||||||||||||||||||||||||
(Millions of Canadian dollars) |
AAA, AA | A | BBB | BB or lower | Total | Banks | OECD governments |
Other | Total | |||||||||||||||||||||||||||
| Gross positive fair values |
$ | 31,561 | $ | 77,933 | $ | 25,206 | $ | 18,533 | $ | 153,233 | $ | 75,119 | $ | 24,655 | $ | 53,459 | $ | 153,233 | ||||||||||||||||||
| Impact of master netting agreements and applicable margins |
18,644 | 67,995 | 19,046 | 14,797 | 120,482 | 73,763 | 24,289 | 22,430 | 120,482 | |||||||||||||||||||||||||||
| Replacement cost (after netting agreements) |
$ | 12,917 | $ | 9,938 | $ | 6,160 | $ | 3,736 | $ | 32,751 | $ | 1,356 | $ | 366 | $ | 31,029 | $ | 32,751 | ||||||||||||||||||
| (1) | Our internal risk ratings of AAA, AA, A and BBB represent investment grade ratings and ratings of BB or lower represent non-investment grade ratings, as outlined in the internal ratings maps in the Credit risk section of Management’s Discussion and Analysis. |
| (2) | Counterparty type is defined in accordance with CAR guidelines. |
| Note 9 Derivative financial instruments and hedging activities (continued) |
| • | Mismatches in the terms of hedged items and hedging instruments, for example the frequency and timing of when interest rates are reset and frequency of payment. |
| • | Difference in the discounting factors between the hedged item and the hedging instrument, taking into consideration the different reset frequency of the hedged item and hedging instrument. |
| • | Hedging derivatives with a non-zero fair value at inception date of the hedging relationship, resulting in mismatch in terms with the hedged item. |
| As at | ||||||||||||||||||||||||||||||||||
October 31, 2025 |
October 31, 2024 | |||||||||||||||||||||||||||||||||
Designated as hedging instruments in hedging relationships |
Not designated in a hedging relationship |
Designated as hedging instruments in hedging relationships |
Not designated in a hedging relationship |
|||||||||||||||||||||||||||||||
| (Millions of Canadian dollars) | Fair value |
Cash flow |
Net investment |
Fair value |
Cash flow |
Net investment |
||||||||||||||||||||||||||||
| Assets |
||||||||||||||||||||||||||||||||||
| Derivative instruments |
$ |
22 |
$ |
538 |
$ |
21 |
$ |
176,625 |
$ | 18 | $ | 298 | $ | 4 | $ | 150,292 | ||||||||||||||||||
| Liabilities |
||||||||||||||||||||||||||||||||||
| Derivative instruments |
5 |
73 |
120 |
183,755 |
59 | 27 | 433 | 163,244 | ||||||||||||||||||||||||||
| Non-derivative instruments |
– |
– |
45,106 |
n.a. |
– | – | 37,833 | n.a. | ||||||||||||||||||||||||||
| (1) | The fair value reflects the impact of characterizing the daily variation margin as settlement of the related derivative fair values as permitted by certain central counterparties. |
| n.a. | not applicable |
As at October 31, 2025 |
||||||||||||||||||||||||||||
Notional amounts |
Carrying amount (1) |
|||||||||||||||||||||||||||
(Millions of Canadian dollars, except average rates) |
Within 1 year |
1 through 5 years |
Over 5 years |
Total |
Assets |
Liabilities |
||||||||||||||||||||||
| Interest rate risk |
||||||||||||||||||||||||||||
| Interest rate contracts |
||||||||||||||||||||||||||||
| Hedge of fixed rate assets |
$ |
30,131 |
$ |
112,640 |
$ |
52,846 |
$ |
195,617 |
$ |
17 |
$ |
5 |
||||||||||||||||
| Hedge of fixed rate liabilities |
31,934 |
67,365 |
13,277 |
112,576 |
5 |
– |
||||||||||||||||||||||
| Weighted average fixed interest rate |
||||||||||||||||||||||||||||
| Hedge of fixed rate assets |
2.9% |
3.4% |
3.6% |
3.4% |
||||||||||||||||||||||||
| Hedge of fixed rate liabilities |
2.3% |
3.3% |
2.9% |
3.0% |
||||||||||||||||||||||||
| As at October 31, 2024 | ||||||||||||||||||||||||||||
| Notional amounts | Carrying amount (1) |
|||||||||||||||||||||||||||
| (Millions of Canadian dollars, except average rates) | Within 1 year |
1 through 5 years |
Over 5 years |
Total | Assets | Liabilities | ||||||||||||||||||||||
| Interest rate risk |
||||||||||||||||||||||||||||
| Interest rate contracts |
||||||||||||||||||||||||||||
| Hedge of fixed rate assets |
$ | 11,396 | $ | 68,563 | $ | 38,343 | $ | 118,302 | $ | 10 | $ | 55 | ||||||||||||||||
| Hedge of fixed rate liabilities |
32,496 | 71,668 | 17,267 | 121,431 | 8 | 4 | ||||||||||||||||||||||
| Weighted average fixed interest rate |
||||||||||||||||||||||||||||
| Hedge of fixed rate assets |
3.8% | 3.8% | 3.5% | 3.7% | ||||||||||||||||||||||||
| Hedge of fixed rate liabilities |
2.9% | 2.8% | 3.1% | 2.8% | ||||||||||||||||||||||||
| (1) | The carrying amount reflects the impact of characterizing the daily variation margin as settlement of the related derivative fair values as permitted by certain central counterparties. |
| Note 9 Derivative financial instruments and hedging activities (continued) |
As at October 31, 2025 |
||||||||||||||||||||||||||
Notional amounts |
Carrying amount (1) |
|||||||||||||||||||||||||
(Millions of Canadian dollars, except average rates) |
Within 1 year |
1 through 5 years |
Over 5 years |
Total |
Assets |
Liabilities |
||||||||||||||||||||
| Interest rate risk |
||||||||||||||||||||||||||
| Interest rate contracts |
||||||||||||||||||||||||||
| Hedge of variable rate assets |
$ |
95,516 |
$ |
136,952 |
$ |
9,274 |
$ |
241,742 |
$ |
– |
$ |
– |
||||||||||||||
| Hedge of variable rate liabilities |
47,782 |
73,620 |
31,296 |
152,698 |
– |
– |
||||||||||||||||||||
| Weighted average fixed interest rate |
||||||||||||||||||||||||||
| Hedge of variable rate assets |
3.1% |
3.2% |
3.4% |
3.2% |
||||||||||||||||||||||
| Hedge of variable rate liabilities |
4.0% |
3.1% |
2.9% |
3.3% |
||||||||||||||||||||||
| Foreign exchange risk |
||||||||||||||||||||||||||
| Cross currency swaps |
||||||||||||||||||||||||||
| Hedge of fixed rate assets |
$ |
183 |
$ |
1,000 |
$ |
– |
$ |
1,183 |
$ |
– |
$ |
73 |
||||||||||||||
| Hedge of fixed rate liabilities |
1,212 |
3,233 |
– |
4,445 |
482 |
– |
||||||||||||||||||||
| Weighted average CAD-EUR exchange rate |
1.49 |
1.41 |
n.a. |
1.43 |
||||||||||||||||||||||
| Weighted average CAD-USD exchange rate |
1.34 |
1.34 |
n.a. |
1.34 |
||||||||||||||||||||||
| As at October 31, 2024 | ||||||||||||||||||||||||||
| Notional amounts | Carrying amount (1) |
|||||||||||||||||||||||||
| (Millions of Canadian dollars, except average rates) | Within 1 year |
1 through 5 years |
Over 5 years |
Total | Assets | Liabilities | ||||||||||||||||||||
| Interest rate risk |
||||||||||||||||||||||||||
| Interest rate contracts |
||||||||||||||||||||||||||
| Hedge of variable rate assets |
$ | 91,698 | $ | 133,684 | $ | 6,831 | $ | 232,213 | $ | – | $ | – | ||||||||||||||
| Hedge of variable rate liabilities |
46,390 | 101,339 | 33,845 | 181,574 | – | – | ||||||||||||||||||||
| Weighted average fixed interest rate |
||||||||||||||||||||||||||
| Hedge of variable rate assets |
4.1% | 3.5% | 3.5% | 3.7% | ||||||||||||||||||||||
| Hedge of variable rate liabilities |
4.1% | 3.6% | 2.9% | 3.6% | ||||||||||||||||||||||
| Foreign exchange risk |
||||||||||||||||||||||||||
| Cross currency swaps |
||||||||||||||||||||||||||
| Hedge of fixed rate assets |
$ | – | $ | 936 | $ | – | $ | 936 | $ | 9 | $ | 21 | ||||||||||||||
| Hedge of fixed rate liabilities |
– | 4,163 | – | 4,163 | 198 | 6 | ||||||||||||||||||||
| Weighted average CAD-EUR exchange rate |
n.a. | 1.43 | n.a. | 1.43 | ||||||||||||||||||||||
| Weighted average CAD-USD exchange rate |
n.a. | 1.34 | n.a. | 1.34 | ||||||||||||||||||||||
| (1) | The carrying amount reflects the impact of characterizing the daily variation margin as settlement of the related derivative fair values as permitted by certain central counterparties. |
| n.a. | not applicable |
As at October 31, 2025 |
||||||||||||||||||||||||||
Notional/Principal |
Carrying amount |
|||||||||||||||||||||||||
(Millions of Canadian dollars, except average rates) |
Within 1 year |
1 through 5 years |
Over 5 years |
Total |
Assets |
Liabilities |
||||||||||||||||||||
| Foreign exchange risk |
||||||||||||||||||||||||||
| Foreign currency liabilities |
$ |
12,069 |
$ |
29,973 |
$ |
3,290 |
$ |
45,332 |
n.a. |
$ |
45,106 |
|||||||||||||||
| Weighted average CAD-USD exchange rate |
1.31 |
1.38 |
1.34 |
1.36 |
||||||||||||||||||||||
| Weighted average CAD-EUR exchange rate |
n.a. |
n.a. |
n.a. |
n.a. |
||||||||||||||||||||||
| Weighted average CAD-GBP exchange rate |
n.a. |
1.78 |
n.a. |
1.78 |
||||||||||||||||||||||
| Forward contracts |
$ |
11,388 |
$ |
– |
$ |
– |
$ |
11,388 |
$ |
21 |
$ |
120 |
||||||||||||||
| Weighted average CAD-USD exchange rate |
1.39 |
n.a. |
n.a. |
1.39 |
||||||||||||||||||||||
| Weighted average CAD-EUR exchange rate |
1.62 |
n.a. |
n.a. |
1.62 |
||||||||||||||||||||||
| Weighted average CAD-GBP exchange rate |
1.86 |
n.a. |
n.a. |
1.86 |
||||||||||||||||||||||
| As at October 31, 2024 | ||||||||||||||||||||||||||
| Notional/Principal | Carrying amount | |||||||||||||||||||||||||
(Millions of Canadian dollars, except average rates) |
Within 1 year |
1 through 5 years |
Over 5 years |
Total | Assets | Liabilities | ||||||||||||||||||||
| Foreign exchange risk |
||||||||||||||||||||||||||
| Foreign currency liabilities |
$ | 4,540 | $ | 27,649 | $ | 6,505 | $ | 38,694 | n.a. | $ | 37,833 | |||||||||||||||
| Weighted average CAD-USD exchange rate |
1.33 | 1.34 | 1.34 | 1.34 | ||||||||||||||||||||||
| Weighted average CAD-EUR exchange rate |
n.a. | n.a. | n.a. | n.a. | ||||||||||||||||||||||
| Weighted average CAD-GBP exchange rate |
1.71 | 1.76 | n.a. | 1.73 | ||||||||||||||||||||||
| Forward contracts |
$ | 19,926 | $ | – | $ | – | $ | 19,926 | $ | 4 | $ | 433 | ||||||||||||||
| Weighted average CAD-USD exchange rate |
1.36 | n.a. | n.a. | 1.36 | ||||||||||||||||||||||
| Weighted average CAD-EUR exchange rate |
1.50 | n.a. | n.a. | 1.50 | ||||||||||||||||||||||
| Weighted average CAD-GBP exchange rate |
1.79 | n.a. | n.a. | 1.79 | ||||||||||||||||||||||
| n.a. | not applicable |
As at and for the year ended October 31, 2025 |
||||||||||||||||||||||
Carrying amount |
Accumulated amount of fair value adjustments on the hedged item included in the carrying amount |
|||||||||||||||||||||
(Millions of Canadian dollars) |
Assets |
Liabilities |
Assets |
Liabilities |
Consolidated Balance Sheet items: |
Changes in fair values used for calculating hedge ineffectiveness |
||||||||||||||||
Interest rate risk |
||||||||||||||||||||||
Fixed rate assets (1) |
$ |
192,744 |
$ |
– |
$ |
1,027 |
$ |
– |
Securities – Investment, net ofapplicable allowance; Loans – Retail; Loans – Wholesale |
$ |
1,698 |
|||||||||||
Fixed rate liabilities (1) |
– |
109,255 |
– |
(499 |
) |
Deposits – Personal; Deposits – Business and government;Subordinated debentures; Deposits – Bank |
(1,812 |
) | ||||||||||||||
As at and for the year ended October 31, 2024 |
||||||||||||||||||||||
Carrying amount |
Accumulated amount of fair value adjustments on the hedged item included in the carrying amount |
|||||||||||||||||||||
(Millions of Canadian dollars) |
Assets |
Liabilities |
Assets |
Liabilities |
Consolidated Balance Sheet items: |
Changes in fair values used for calculating hedge ineffectiveness |
||||||||||||||||
Interest rate risk |
||||||||||||||||||||||
Fixed rate assets (1) |
$ |
114,354 |
$ |
– |
$ |
(666 |
) |
$ |
– |
Securities – Investment, net ofapplicable allowance; Loans – Retail; Loans – Wholesale |
$ |
2,702 |
||||||||||
Fixed rate liabilities (1) |
– |
118,116 |
– |
(2,312 |
) |
Deposits – Personal; Deposits – Business and government; Subordinated debentures; Deposits – Bank |
(3,963 |
) | ||||||||||||||
| (1) | As at October 31, 2025, the accumulated amount of fair value hedge adjustments remaining on our Consolidated Balance Sheets for hedged items that have ceased to be adjusted for hedging gains and losses is a loss of $78 million for fixed rate assets and a gain of $9 million for fixed rate liabilities (October 31, 2024 – loss of $238 million and gain of $118 million, respectively). |
Note 9 Derivative financial instruments and hedging activities (continued) |
As at and for the year ended October 31, 2025 |
||||||||||||||
Changes in fair values used for calculating hedge ineffectiveness |
Cash flow hedge/foreign currency translation reserve |
|||||||||||||
(Millions of Canadian dollars) |
Consolidated Balance Sheet items: |
Continuing hedges |
Discontinued hedges |
|||||||||||
Cash flow hedges |
||||||||||||||
Interest rate risk |
||||||||||||||
Variable rate assets |
Securities – Investment, net ofapplicable allowance; Loans – Retail; Loans – Wholesale; |
$ |
(1,561 |
) |
$ |
2,934 |
$ |
(481 |
) | |||||
Interest bearing deposits with banks; Assets purchased under reverse |
||||||||||||||
repurchase agreements and securities borrowed |
||||||||||||||
Variable rate liabilities |
Deposits – Business and government; |
976 |
(1,643 |
) |
2,520 |
|||||||||
Deposits – Personal; Obligations related to assets sold under repurchase agreements and securities loaned |
||||||||||||||
Foreign exchange risk |
||||||||||||||
Fixed rate assets |
Securities – Investment, net ofapplicable allowance |
56 |
13 |
– |
||||||||||
Fixed rate liabilities |
Deposits – Business and government |
(305 |
) |
(51 |
) |
– |
||||||||
Net investment hedges |
||||||||||||||
Foreign exchange risk |
||||||||||||||
Foreign subsidiaries |
n.a. |
433 |
(8,514 |
) |
(306 |
) | ||||||||
As at and for the year ended October 31, 2024 |
||||||||||||||
Changes in fair values used for calculating hedge ineffectiveness |
Cash flow hedge/foreign currency translation reserve |
|||||||||||||
(Millions of Canadian dollars) |
Consolidated Balance Sheet items: |
Continuing hedges |
Discontinued hedges |
|||||||||||
Cash flow hedges |
||||||||||||||
Interest rate risk |
||||||||||||||
Variable rate assets |
Securities – Investment, net of |
$ |
(4,415 |
) |
$ |
2,645 |
$ |
(2,216 |
) | |||||
applicable allowance; Loans – Retail; Loans – Wholesale; Interest bearing deposits with banks; |
||||||||||||||
Assets purchased under reverse repurchase agreements and securities borrowed |
||||||||||||||
Variable rate liabilities |
Deposits – Business and government; |
4,437 |
(1,801 |
) |
4,557 |
|||||||||
Deposits – Personal; |
||||||||||||||
Obligations related to assets sold under |
||||||||||||||
repurchase agreements and securities loaned |
||||||||||||||
Foreign exchange risk |
||||||||||||||
Fixed rate assets |
Securities – Investment, net ofapplicable allowance |
7 |
13 |
– |
||||||||||
Fixed rate liabilities |
Deposits – Business and government |
(106 |
) |
(52 |
) |
– |
||||||||
Net investment hedges |
||||||||||||||
Foreign exchange risk |
||||||||||||||
Foreign subsidiaries |
n.a. |
710 |
(8,005 |
) |
(382 |
) | ||||||||
n.a. |
not applicable |
For the year ended October 31, 2025 |
||||||||||||||||
(Millions of Canadian dollars) |
Change in fair value of hedging instrument |
Hedge ineffectiveness recognized in income (1) |
Changes in the value of the hedging instrument recognized in OCI |
Amount reclassified from hedge reserves to income |
||||||||||||
Fair value hedges |
||||||||||||||||
Interest rate risk |
||||||||||||||||
Interest rate contracts – fixed rate assets |
$ |
(1,773 |
) |
$ |
(75 |
) |
n.a. |
n.a. |
||||||||
Interest rate contracts – fixed rate liabilities |
1,808 |
(4 |
) |
n.a. |
n.a. |
|||||||||||
Cash flow hedges |
||||||||||||||||
Interest rate risk |
||||||||||||||||
Interest rate contracts – variable rate assets |
1,543 |
(13 |
) |
$ |
1,604 |
$ |
(344 |
) | ||||||||
Interest rate contracts – variable rate liabilities |
(941 |
) |
17 |
(974 |
) |
828 |
||||||||||
Foreign exchange risk |
||||||||||||||||
Cross currency swap – fixed rate assets |
(56 |
) |
– |
(50 |
) |
(50 |
) | |||||||||
Cross currency swap – fixed rate liabilities |
305 |
– |
246 |
246 |
||||||||||||
Net investment hedges |
||||||||||||||||
Foreign exchange risk |
||||||||||||||||
Foreign currency liabilities |
(92 |
) |
– |
(92 |
) |
– |
||||||||||
Forward contracts |
(341 |
) |
– |
(341 |
) |
– |
||||||||||
| For the year ended October 31, 2024 | ||||||||||||||||
(Millions of Canadian dollars) |
Change in fair value of hedging instrument |
Hedge ineffectiveness recognized in income (1) |
Changes in the value of the hedging instrument recognized in OCI |
Amount reclassified from hedge reserves to income |
||||||||||||
Fair value hedges |
||||||||||||||||
Interest rate risk |
||||||||||||||||
Interest rate contracts – fixed rate assets |
$ | (2,761 | ) | $ | (59 | ) | n.a. | n.a. | ||||||||
Interest rate contracts – fixed rate liabilities |
3,961 | (2 | ) | n.a. | n.a. | |||||||||||
Cash flow hedges |
||||||||||||||||
Interest rate risk |
||||||||||||||||
Interest rate contracts – variable rate assets |
4,416 | 15 | $ | 2,559 | $ | (3,195 | ) | |||||||||
Interest rate contracts – variable rate liabilities |
(4,325 | ) | (19 | ) | (2,600 | ) | 3,872 | |||||||||
Foreign exchange risk |
||||||||||||||||
Cross currency swap – fixed rate assets |
(6 | ) | – | 1 | (12 | ) | ||||||||||
Cross currency swap – fixed rate liabilities |
107 | 2 | 70 | 122 | ||||||||||||
Net investment hedges |
||||||||||||||||
Foreign exchange risk |
||||||||||||||||
Foreign currency liabilities |
(455 | ) | – | (455 | ) | – | ||||||||||
Forward contracts |
(255 | ) | – | (254 | ) | (1 | ) | |||||||||
| (1) | Hedge ineffectiveness recognized in income included losses of $105 million that are excluded from the assessment of hedge effectiveness and are offset by economic hedges (October 31, 2024 – losses of $50 million). |
| n.a. | not applicable |
| Note 9 Derivative financial instruments and hedging activities (continued) |
For the year ended October 31, 2025 |
For the year ended October 31, 2024 |
|||||||||||||||||
(Millions of Canadian dollars) |
Cash flow hedge reserve |
Foreign currency translation reserve |
Cash flow hedge reserve |
Foreign currency translation reserve |
||||||||||||||
| Balance at the beginning of the year |
$ |
2,267 |
$ |
7,128 |
$ | 2,756 | $ | 6,612 | ||||||||||
| Cash flow hedges |
||||||||||||||||||
| Effective portion of changes in fair value: |
||||||||||||||||||
| Interest rate risk |
630 |
(40 | ) | |||||||||||||||
| Foreign exchange risk |
196 |
71 | ||||||||||||||||
| Equity price risk |
243 |
413 | ||||||||||||||||
| Net amount reclassified to profit or loss: |
||||||||||||||||||
| Ongoing hedges: |
||||||||||||||||||
| Interest rate risk |
(81 |
) |
134 | |||||||||||||||
| Foreign exchange risk |
(196 |
) |
(110 | ) | ||||||||||||||
| Equity price risk |
(245 |
) |
(350 | ) | ||||||||||||||
| De-designated hedges: |
||||||||||||||||||
| Interest rate risk |
(403 |
) |
(811 | ) | ||||||||||||||
| Hedges of net investment in foreign operations |
||||||||||||||||||
| Foreign exchange denominated debt |
(92 |
) |
(455 | ) | ||||||||||||||
| Forward foreign exchange contracts |
(341 |
) |
(254 | ) | ||||||||||||||
| Foreign currency translation differences for foreign operations |
826 |
1,018 | ||||||||||||||||
| Reclassification of losses (gains) on foreign currency translation to income |
(25 |
) |
– | |||||||||||||||
| Reclassification of losses (gains) on net investment hedging activities to income |
– |
1 | ||||||||||||||||
| Tax on movements on reserves during the period |
(33 |
) |
117 |
204 | 206 | |||||||||||||
| Balance at the end of the year |
$ |
2,378 |
$ |
7,613 |
$ | 2,267 | $ | 7,128 | ||||||||||
| Note 10 Premises and equipment |
For the year ended October 31, 2025 |
||||||||||||||||||||||||||||||||||||||||
Owned by the Bank (1) |
Right-of-use lease assets |
|||||||||||||||||||||||||||||||||||||||
(Millions of Canadian dollars) |
Land |
Buildings |
Computer equipment |
Furniture, fixtures and other equipment |
Leasehold improvements |
Work in process |
Buildings |
Equipment |
Total (2) |
|||||||||||||||||||||||||||||||
| Cost |
||||||||||||||||||||||||||||||||||||||||
| Balance at beginning of period |
$ |
244 |
$ |
1,325 |
$ |
1,411 |
$ |
900 |
$ |
3,169 |
$ |
129 |
$ |
6,432 |
$ |
319 |
$ |
13,929 |
||||||||||||||||||||||
| Additions |
– |
11 |
45 |
11 |
48 |
641 |
518 |
159 |
1,433 |
|||||||||||||||||||||||||||||||
| Acquisition through business combination |
– |
– |
– |
– |
– |
– |
– |
– |
– |
|||||||||||||||||||||||||||||||
| Transfers from work in process |
– |
26 |
317 |
61 |
166 |
(570 |
) |
– |
– |
– |
||||||||||||||||||||||||||||||
| Disposals |
– |
(16 |
) |
(290 |
) |
(74 |
) |
(288 |
) |
– |
(61 |
) |
(36 |
) |
(765 |
) | ||||||||||||||||||||||||
| Foreign exchange translation |
– |
5 |
7 |
3 |
15 |
1 |
42 |
– |
73 |
|||||||||||||||||||||||||||||||
| Other |
(90 |
) |
(56 |
) |
2 |
(38 |
) |
(37 |
) |
– |
52 |
– |
(167 |
) | ||||||||||||||||||||||||||
| Balance at end of period |
$ |
154 |
$ |
1,295 |
$ |
1,492 |
$ |
863 |
$ |
3,073 |
$ |
201 |
$ |
6,983 |
$ |
442 |
$ |
14,503 |
||||||||||||||||||||||
| Accumulated depreciation |
||||||||||||||||||||||||||||||||||||||||
| Balance at beginning of period |
$ |
– |
$ |
694 |
$ |
834 |
$ |
554 |
$ |
2,072 |
$ |
– |
$ |
2,685 |
$ |
238 |
$ |
7,077 |
||||||||||||||||||||||
| Depreciation |
– |
53 |
260 |
81 |
231 |
– |
581 |
80 |
1,286 |
|||||||||||||||||||||||||||||||
| Disposals |
– |
(19 |
) |
(289 |
) |
(68 |
) |
(287 |
) |
– |
(19 |
) |
(32 |
) |
(714 |
) | ||||||||||||||||||||||||
| Foreign exchange translation |
– |
2 |
5 |
2 |
7 |
– |
14 |
– |
30 |
|||||||||||||||||||||||||||||||
| Other |
– |
9 |
12 |
(31 |
) |
15 |
– |
– |
– |
5 |
||||||||||||||||||||||||||||||
| Balance at end of period |
$ |
– |
$ |
739 |
$ |
822 |
$ |
538 |
$ |
2,038 |
$ |
– |
$ |
3,261 |
$ |
286 |
$ |
7,684 |
||||||||||||||||||||||
| Net carrying amount at end of period |
$ |
154 |
$ |
556 |
$ |
670 |
$ |
325 |
$ |
1,035 |
$ |
201 |
$ |
3,722 |
$ |
156 |
$ |
6,819 |
||||||||||||||||||||||
For the year ended October 31, 2024 |
||||||||||||||||||||||||||||||||||||||||
Owned by the Bank (1) |
Right-of-use lease assets |
|||||||||||||||||||||||||||||||||||||||
(Millions of Canadian dollars) |
Land |
Buildings |
Computer equipment |
Furniture, fixtures and other equipment |
Leasehold improvements |
Work in process |
Buildings |
Equipment |
Total (2) |
|||||||||||||||||||||||||||||||
| Cost |
||||||||||||||||||||||||||||||||||||||||
| Balance at beginning of period |
$ |
140 |
$ |
1,251 |
$ |
1,283 |
$ |
835 |
$ |
3,007 |
$ |
108 |
$ |
5,893 |
$ |
317 |
$ |
12,834 |
||||||||||||||||||||||
| Additions |
103 |
77 |
21 |
11 |
50 |
522 |
526 |
2 |
1,312 |
|||||||||||||||||||||||||||||||
| Acquisition through business combination |
– |
– |
– |
13 |
59 |
– |
226 |
– |
298 |
|||||||||||||||||||||||||||||||
| Transfers from work in process |
– |
5 |
240 |
132 |
102 |
(479 |
) |
– |
– |
– |
||||||||||||||||||||||||||||||
| Disposals |
– |
(6 |
) |
(140 |
) |
(82 |
) |
(29 |
) |
– |
(165 |
) |
– |
(422 |
) | |||||||||||||||||||||||||
| Foreign exchange translation |
1 |
2 |
10 |
3 |
19 |
– |
61 |
– |
96 |
|||||||||||||||||||||||||||||||
| Other |
– |
(4 |
) |
(3 |
) |
(12 |
) |
(39 |
) |
(22 |
) |
(109 |
) |
– |
(189 |
) | ||||||||||||||||||||||||
| Balance at end of period |
$ |
244 |
$ |
1,325 |
$ |
1,411 |
$ |
900 |
$ |
3,169 |
$ |
129 |
$ |
6,432 |
$ |
319 |
$ |
13,929 |
||||||||||||||||||||||
| Accumulated depreciation |
||||||||||||||||||||||||||||||||||||||||
| Balance at beginning of period |
$ |
– |
$ |
646 |
$ |
723 |
$ |
550 |
$ |
1,863 |
$ |
– |
$ |
2,149 |
$ |
154 |
$ |
6,085 |
||||||||||||||||||||||
| Depreciation |
– |
59 |
249 |
73 |
279 |
– |
620 |
84 |
1,364 |
|||||||||||||||||||||||||||||||
| Disposals |
– |
(6 |
) |
(140 |
) |
(82 |
) |
(25 |
) |
– |
(54 |
) |
– |
(307 |
) | |||||||||||||||||||||||||
| Foreign exchange translation |
– |
1 |
8 |
2 |
7 |
– |
21 |
– |
39 |
|||||||||||||||||||||||||||||||
| Other |
– |
(6 |
) |
(6 |
) |
11 |
(52 |
) |
– |
(51 |
) |
– |
(104 |
) | ||||||||||||||||||||||||||
| Balance at end of period |
$ |
– |
$ |
694 |
$ |
834 |
$ |
554 |
$ |
2,072 |
$ |
– |
$ |
2,685 |
$ |
238 |
$ |
7,077 |
||||||||||||||||||||||
| Net carrying amount at end of period |
$ |
244 |
$ |
631 |
$ |
577 |
$ |
346 |
$ |
1,097 |
$ |
129 |
$ |
3,747 |
$ |
81 |
$ |
6,852 |
||||||||||||||||||||||
| (1) | As at October 31, 2025, we had total contractual commitments of $160 million to purchase premises and equipment (October 31, 2024 – $137 million). |
| (2) | Includes investment properties with a cost of $34 million (October 31, 2024 – $186 million) which are subject to operating leases and carried at cost less accumulated amortization. The fair value, determined by a combination of internal investment professionals and external independent property appraisers with the relevant professional qualifications and experience, is $34 million (October 31, 2024 – $188 million). |
| Note 11 Goodwill and other intangible assets |
For the year ended October 31, 2025 |
||||||||||||||||||||||||||||||||||||||||||||
(Millions of Canadian dollars) |
Personal Banking – Canada |
Caribbean Banking |
Commercial Banking |
Canadian Wealth Management |
Global Asset Management |
U.S. Wealth Management (including City National) |
International Wealth Management |
Investor Services |
Insurance |
Capital Markets |
Total |
|||||||||||||||||||||||||||||||||
| Balance at beginning of period |
$ |
4,994 |
$ |
1,798 |
$ |
3,815 |
$ |
877 |
$ |
2,164 |
$ |
3,091 |
$ |
1,198 |
$ |
29 |
$ |
112 |
$ |
1,208 |
$ |
19,286 |
||||||||||||||||||||||
| Acquisitions |
– |
– |
– |
– |
– |
– |
– |
– |
– |
– |
– |
|||||||||||||||||||||||||||||||||
| Currency translations and other |
(25 |
) |
21 |
(25 |
) |
6 |
79 |
22 |
34 |
– |
– |
7 |
119 |
|||||||||||||||||||||||||||||||
| Balance at end of period |
$ |
4,969 |
$ |
1,819 |
$ |
3,790 |
$ |
883 |
$ |
2,243 |
$ |
3,113 |
$ |
1,232 |
$ |
29 |
$ |
112 |
$ |
1,215 |
$ |
19,405 |
||||||||||||||||||||||
| For the year ended October 31, 2024 | ||||||||||||||||||||||||||||||||||||||||||||
(Millions of Canadian dollars) |
Personal Banking – Canada |
Caribbean Banking |
Commercial Banking |
Canadian Wealth Management |
Global Asset Management |
U.S. Wealth Management (including City National) |
International Wealth Management |
Investor Services |
Insurance | Capital Markets |
Total | |||||||||||||||||||||||||||||||||
| Balance at beginning of period |
$ | 1,851 | $ | 1,791 | $ | 793 | $ | 593 | $ | 2,016 | $ | 3,080 | $ | 1,124 | $ | 29 | $ | 112 | $ | 1,205 | $ | 12,594 | ||||||||||||||||||||||
| Acquisitions |
3,159 | – | 3,022 | 283 | 72 | – | – | – | – | – | 6,536 | |||||||||||||||||||||||||||||||||
| Currency translations and other |
(16 | ) | 7 | – | 1 | 76 | 11 | 74 | – | – | 3 | 156 | ||||||||||||||||||||||||||||||||
| Balance at end of period |
$ | 4,994 | $ | 1,798 | $ | 3,815 | $ | 877 | $ | 2,164 | $ | 3,091 | $ | 1,198 | $ | 29 | $ | 112 | $ | 1,208 | $ | 19,286 | ||||||||||||||||||||||
| As at | ||||||||||||||||||
August 1, 2025 |
August 1, 2024 | |||||||||||||||||
Discount rate (1) |
Terminal growth rate |
Discount rate (1) |
Terminal growth rate |
|||||||||||||||
| Group of cash generating units |
||||||||||||||||||
| Personal Banking – Canada |
10.8% |
3.0% |
11.7% | 3.0% | ||||||||||||||
| Caribbean Banking |
12.9 |
3.5 |
13.7 | 3.5 | ||||||||||||||
| Commercial Banking |
11.5 |
3.0 |
11.7 | 3.0 | ||||||||||||||
| Canadian Wealth Management |
11.8 |
3.0 |
12.5 | 3.0 | ||||||||||||||
| Global Asset Management |
11.8 |
3.0 |
12.4 | 3.0 | ||||||||||||||
| U.S. Wealth Management (including City National) |
12.4 |
3.0 |
12.6 | 3.0 | ||||||||||||||
| International Wealth Management |
12.1 |
3.0 |
12.3 | 3.0 | ||||||||||||||
| Investor Services |
11.9 |
3.0 |
12.5 | 3.0 | ||||||||||||||
| Insurance |
11.5 |
3.0 |
12.5 | 3.0 | ||||||||||||||
| Capital Markets |
13.0 |
3.0 |
12.7 | 3.0 | ||||||||||||||
| (1) | Pre-tax discount rates are determined implicitly based on post-tax discount rates. |
For the year ended October 31, 2025 |
||||||||||||||||||||||||
(Millions of Canadian dollars) |
Internally generated software |
Other software |
Core deposit intangibles |
Customer list and relationships (1) |
In process software |
Total |
||||||||||||||||||
| Gross carrying amount |
||||||||||||||||||||||||
| Balance at beginning of period |
$ |
5,574 |
$ |
1,074 |
$ |
3,637 |
$ |
2,941 |
$ |
1,357 |
$ |
14,583 |
||||||||||||
| Additions |
175 |
12 |
– |
– |
1,165 |
1,352 |
||||||||||||||||||
| Acquisition through business combination |
– |
– |
– |
– |
– |
– |
||||||||||||||||||
| Transfers |
844 |
83 |
– |
– |
(927 |
) |
– |
|||||||||||||||||
| Dispositions |
(585 |
) |
(43 |
) |
– |
– |
(2 |
) |
(630 |
) | ||||||||||||||
| Impairment losses |
(37 |
) |
(1 |
) |
– |
– |
(10 |
) |
(48 |
) | ||||||||||||||
| Currency translations |
19 |
11 |
11 |
52 |
8 |
101 |
||||||||||||||||||
| Other changes |
111 |
(42 |
) |
– |
(13 |
) |
(89 |
) |
(33 |
) | ||||||||||||||
| Balance at end of period |
$ |
6,101 |
$ |
1,094 |
$ |
3,648 |
$ |
2,980 |
$ |
1,502 |
$ |
15,325 |
||||||||||||
| Accumulated amortization |
||||||||||||||||||||||||
| Balance at beginning of period |
$ |
(3,387 |
) |
$ |
(729 |
) |
$ |
(1,663 |
) |
$ |
(1,006 |
) |
$ |
– |
$ |
(6,785 |
) | |||||||
| Amortization charge for the year |
(1,068 |
) |
(79 |
) |
(448 |
) |
(164 |
) |
– |
(1,759 |
) | |||||||||||||
| Dispositions |
591 |
42 |
– |
– |
– |
633 |
||||||||||||||||||
| Impairment losses |
13 |
1 |
– |
– |
– |
14 |
||||||||||||||||||
| Currency translations |
(13 |
) |
(8 |
) |
(10 |
) |
(11 |
) |
– |
(42 |
) | |||||||||||||
| Other changes |
23 |
(28 |
) |
– |
21 |
– |
16 |
|||||||||||||||||
| Balance at end of period |
$ |
(3,841 |
) |
$ |
(801 |
) |
$ |
(2,121 |
) |
$ |
(1,160 |
) |
$ |
– |
$ |
(7,923 |
) | |||||||
| Net balance at end of period |
$ |
2,260 |
$ |
293 |
$ |
1,527 |
$ |
1,820 |
$ |
1,502 |
$ |
7,402 |
||||||||||||
| For the year ended October 31 , 2024 |
||||||||||||||||||||||||
(Millions of Canadian dollars) |
Internally generated software |
Other software |
Core deposit intangibles |
Customer list and relationships (1) |
In process software |
Total | ||||||||||||||||||
| Gross carrying amount |
||||||||||||||||||||||||
| Balance at beginning of period |
$ | 5,595 | $ | 1,097 | $ | 1,658 | $ | 2,456 | $ | 1,527 | $ | 12,333 | ||||||||||||
| Additions |
31 | 4 | – | 9 | 1,090 | 1,134 | ||||||||||||||||||
| Acquisition through business combination |
– | – | 1,972 | 370 | – | 2,342 | ||||||||||||||||||
| Transfers |
1,204 | 42 | – | – | (1,246 | ) | – | |||||||||||||||||
| Dispositions |
(1,204 | ) | (67 | ) | – | (9 | ) | (1 | ) | (1,281 | ) | |||||||||||||
| Impairment losses |
(37 | ) | (18 | ) | – | – | (30 | ) | (85 | ) | ||||||||||||||
| Currency translations |
32 | 17 | 7 | 115 | 3 | 174 | ||||||||||||||||||
| Other changes |
(47 | ) | (1 | ) | – | – | 14 | (34 | ) | |||||||||||||||
| Balance at end of period |
$ | 5,574 | $ | 1,074 | $ | 3,637 | $ | 2,941 | $ | 1,357 | $ | 14,583 | ||||||||||||
| Accumulated amortization |
||||||||||||||||||||||||
| Balance at beginning of period |
$ | (3,596 | ) | $ | (658 | ) | $ | (1,330 | ) | $ | (846 | ) | $ | – | $ | (6,430 | ) | |||||||
| Amortization charge for the year |
(986 | ) | (102 | ) | (325 | ) | (136 | ) | – | (1,549 | ) | |||||||||||||
| Dispositions |
1,204 | 66 | – | 7 | – | 1,277 | ||||||||||||||||||
| Impairment losses |
12 | 5 | – | – | – | 17 | ||||||||||||||||||
| Currency translations |
(21 | ) | (7 | ) | (8 | ) | (31 | ) | – | (67 | ) | |||||||||||||
| Other changes |
– | (33 | ) | – | – | – | (33 | ) | ||||||||||||||||
| Balance at end of period |
$ | (3,387 | ) | $ | (729 | ) | $ | (1,663 | ) | $ | (1,006 | ) | $ | – | $ | (6,785 | ) | |||||||
| Net balance at end of period |
$ | 2,187 | $ | 345 | $ | 1,974 | $ | 1,935 | $ | 1,357 | $ | 7,798 | ||||||||||||
| (1) | Includes $259 million (October 31, 2024 – $259 million) of mutual fund management contracts with indefinite useful lives in the Global Asset Management CGU acquired in the HSBC Canada transaction. |
| Note 12 Joint ventures and associated companies |
Joint ventures |
Associated companies |
|||||||||||||||||
As at and for the year ended |
||||||||||||||||||
(Millions of Canadian dollars) |
October 31 2025 |
October 31 2024 |
October 31 2025 |
October 31 2024 |
||||||||||||||
| Carrying amount |
$ |
572 |
$ | 542 | $ |
257 |
$ | 293 | ||||||||||
| Share of: |
||||||||||||||||||
| Net income (1) |
$ |
82 |
$ | 64 | $ |
1 |
$ | (41 | ) | |||||||||
| (1) | Excludes impairment losses recognized on our interests in joint ventures and associated companies. During the year ended October 31, 2025, we recognized impairment losses of $10 million in Non-interest income – Income (loss) from joint ventures and associates with respect to our interest in an associated company in our Wealth Management segment (October 31, 2024 – $38 million). |
| Note 13 Other assets |
| As at | ||||||||
(Millions of Canadian dollars) |
October 31 2025 |
October 31 2024 |
||||||
| Accounts receivable and prepaids |
$ |
5,027 |
$ | 4,389 | ||||
| Accrued interest receivable |
8,342 |
7,904 | ||||||
| Cash collateral |
27,418 |
20,475 | ||||||
| Commodity trading assets (1) |
14,475 |
9,834 | ||||||
| Deferred income tax asset |
4,486 |
4,328 | ||||||
| Employee benefit assets |
4,012 |
3,630 | ||||||
| Insurance-related assets |
||||||||
| Insurance contract assets |
581 |
588 | ||||||
| Reinsurance contracts held assets |
1,774 |
1,758 | ||||||
| Segregated fund net assets |
3,810 |
3,378 | ||||||
| Collateral loans and other |
554 |
517 | ||||||
| Investments in joint ventures and associates |
829 |
835 | ||||||
| Margin deposits |
13,556 |
11,108 | ||||||
| Precious metals (1) |
9,108 |
6,018 | ||||||
| Receivable from brokers, dealers and clients |
4,667 |
3,343 | ||||||
| Taxes receivable |
8,696 |
7,418 | ||||||
| Other |
5,558 |
6,667 | ||||||
$ |
112,893 |
$ | 92,190 | |||||
| (1) | Amounts include financial assets disclosed in Note 3 and non-financial assets. Non-financial assets primarily consist of commodities measured at fair value less cost to sell. The fair values are determined by applying valuation techniques using commodity futures’ prices and are classified as L evel 2 in our fair value hierarchy as the inputs are observable. |
| Note 14 Deposits |
| As at | ||||||||||||||||||||||||||||||||||
October 31, 2025 |
October 31, 2024 | |||||||||||||||||||||||||||||||||
(Millions of Canadian dollars) |
Demand (1) |
Notice (2) |
Term (3) |
Total |
Demand (1) |
Notice (2) |
Term (3) |
Total | ||||||||||||||||||||||||||
| Personal |
$ |
228,282 |
$ |
56,988 |
$ |
244,470 |
$ |
529,740 |
$ | 205,714 | $ | 62,845 | $ | 253,580 | $ | 522,139 | ||||||||||||||||||
| Business and government |
431,239 |
20,274 |
494,801 |
946,314 |
369,943 | 20,157 | 449,570 | 839,670 | ||||||||||||||||||||||||||
| Bank |
13,488 |
– |
26,074 |
39,562 |
9,675 | 641 | 37,406 | 47,722 | ||||||||||||||||||||||||||
$ |
673,009 |
$ |
77,262 |
$ |
765,345 |
$ |
1,515,616 |
$ | 585,332 | $ | 83,643 | $ | 740,556 | $ | 1,409,531 | |||||||||||||||||||
| Non-interest-bearing (4) |
||||||||||||||||||||||||||||||||||
| Canada |
$ |
158,771 |
$ |
9,469 |
$ |
292 |
$ |
168,532 |
$ | 144,712 | $ | 7,164 | $ | 203 | $ | 152,079 | ||||||||||||||||||
| United States |
38,009 |
– |
– |
38,009 |
38,520 | – | – | 38,520 | ||||||||||||||||||||||||||
| Europe (5) |
5 |
– |
– |
5 |
11 | – | – | 11 | ||||||||||||||||||||||||||
| Other International |
8,133 |
– |
– |
8,133 |
7,758 | – | – | 7,758 | ||||||||||||||||||||||||||
| Interest-bearing (4) |
||||||||||||||||||||||||||||||||||
| Canada |
392,120 |
16,417 |
591,636 |
1,000,173 |
355,221 | 14,468 | 594,066 | 963,755 | ||||||||||||||||||||||||||
| United States |
63,745 |
50,497 |
73,147 |
187,389 |
28,389 | 61,087 | 75,933 | 165,409 | ||||||||||||||||||||||||||
| Europe (5) |
6,354 |
742 |
76,972 |
84,068 |
5,013 | 851 | 53,295 | 59,159 | ||||||||||||||||||||||||||
| Other International |
5,872 |
137 |
23,298 |
29,307 |
5,708 | 73 | 17,059 | 22,840 | ||||||||||||||||||||||||||
$ |
673,009 |
$ |
77,262 |
$ |
765,345 |
$ |
1,515,616 |
$ | 585,332 | $ | 83,643 | $ | 740,556 | $ | 1,409,531 | |||||||||||||||||||
| (1) | Demand deposits are deposits for which we do not have the right to require notice of withdrawal, which include both savings and chequing accounts. |
| (2) | Notice deposits are deposits for which we can legally require notice of withdrawal. These deposits are primarily savings accounts. |
| (3) | Term deposits are deposits payable on a fixed date, and include term deposits, guaranteed investment certificates and similar instruments. |
(4) |
The geographical splits of the deposits are based on the point of origin of the deposits and where the revenue is recognized. As at October 31, 2025, deposits denominated in U.S. dollars, British pounds, Euro and other foreign currencies were $ 570 billion, $42 billion, $76 billion and $36 511 billion, $34 billion, $53 billion and $29 billion, respectively). |
| (5) | Europe includes the United Kingdom and the Channel Islands. |
| As at | ||||||||
(Millions of Canadian dollars) |
October 31 2025 |
October 31 2024 |
||||||
| Within 1 year: |
||||||||
| less than 3 months |
$ |
203,075 |
$ | 207,698 | ||||
| 3 to 6 months |
118,734 |
94,585 | ||||||
| 6 to 12 months |
172,583 |
173,603 | ||||||
| 1 to 2 years |
87,550 |
79,777 | ||||||
| 2 to 3 years |
58,170 |
61,175 | ||||||
| 3 to 4 years |
33,158 |
45,767 | ||||||
| 4 to 5 years |
24,047 |
20,692 | ||||||
| Over 5 years |
68,028 |
57,259 | ||||||
$ |
765,345 |
$ | 740,556 | |||||
| (1) | The aggregate amount of term deposits in denominations of one hundred thousand dollars or more is $704 billion (October 31, 2024 – $ 670 billion). |
For the year ended |
||||||||||||||||||
October 31, 2025 |
October 31, 2024 |
|||||||||||||||||
(Millions of Canadian dollars, except for percentage amounts) |
Average balances |
Average rates |
Average balances |
Average rates |
||||||||||||||
| Canada |
$ |
1,155,147 |
2.93 |
% |
$ | 1,035,064 | 3.57% | |||||||||||
| United States |
215,460 |
2.94 |
191,257 | 3.33 | ||||||||||||||
| Europe |
85,570 |
4.24 |
58,693 | 5.26 | ||||||||||||||
| Other International |
39,935 |
2.45 |
32,016 | 2.48 | ||||||||||||||
$ |
1,496,112 |
3.00 |
% |
$ | 1,317,030 | 3.59% | ||||||||||||
| Note 15 Insurance and reinsurance |
| For the year ended | ||||||||
(Millions of Canadian dollars) |
October 31 2025 |
October 31 2024 |
||||||
| Insurance revenue |
||||||||
| Amounts recognized for contracts using the GMM and VFA: |
||||||||
| Relating to changes in liabilities for remaining coverage: |
||||||||
| Expected incurred claims and other insurance services expenses |
$ |
3,131 |
$ | 2,970 | ||||
| Release of risk adjustment for non-financial risk and other |
214 |
191 | ||||||
| CSM recognized for services provided |
324 |
255 | ||||||
| Recovery of insurance acquisition cash flows |
98 |
81 | ||||||
3,767 |
3,497 | |||||||
| Amounts recognized for contracts using the PAA |
1,615 |
1,576 | ||||||
5,382 |
5,073 | |||||||
| Insurance service expense (1) |
||||||||
| Incurred claims and other expenses |
(3,978 |
) |
(3,901 | ) | ||||
| Losses on onerous contracts and reversals of such losses (future service) |
(313 |
) |
(246 | ) | ||||
| Adjustments to liability for incurred claims (past service) |
(64 |
) |
(2 | ) | ||||
| Amortization of insurance acquisition cash flows |
(98 |
) |
(81 | ) | ||||
(4,453 |
) |
(4,230 | ) | |||||
| Net income (expense) from reinsurance contracts held |
(62 |
) |
(66 | ) | ||||
| Insurance service result |
$ |
867 |
$ | 777 | ||||
| Net investment income (2) |
$ |
1,453 |
$ | 3,259 | ||||
| Insurance finance income (expense) |
||||||||
| Interest accreted (3) |
(791 |
) |
(783 | ) | ||||
| Effect of changes in discount rates and other financial assumptions (3), (4) |
35 |
(1,509 | ) | |||||
| Changes in fair value of underlying items for contracts using the VFA |
(467 |
) |
(746 | ) | ||||
| Other |
3 |
(93 | ) | |||||
(1,220 |
) |
(3,131 | ) | |||||
| Reinsurance finance income (expense) |
51 |
166 | ||||||
| Insurance investment result |
$ |
284 |
$ | 294 | ||||
| Insurance service and insurance investment results |
$ |
1,151 |
$ | 1,071 | ||||
(1) |
Includes Insurance service expense of $ 977 million (October 31, 2024 – $948 million) relating to insurance contracts measured using the PAA. |
(2) |
Refer to Note 3 for amounts of interest, dividend and net gains (losses) from FVTPL financial instruments relating to the Insurance segment. |
(3) |
Comparative amounts have been revised from those previously presented. |
(4) |
Includes the effect of changes in fulfillment cash flows at current rates when the corresponding effect through CSM is at locked-in rates. |
| As at or for the year ended | ||||||||||||||||||||||||||
October 31, 2025 |
October 31, 2024 | |||||||||||||||||||||||||
(Millions of Canadian dollars) |
Liabilities for remaining coverage (1) |
Liabilities for incurred claims (2) |
Total |
Liabilities for remaining coverage (1) |
Liabilities for incurred claims (2) |
Total | ||||||||||||||||||||
| Balance at beginning of period: |
||||||||||||||||||||||||||
| Insurance contract assets |
$ |
1,805 |
$ |
(1,217 |
) |
$ |
588 |
$ | 1,531 | $ | (850 | ) | $ | 681 | ||||||||||||
| Insurance contract liabilities |
(20,866 |
) |
(1,365 |
) |
(22,231 |
) |
(17,858 | ) | (1,168 | ) | (19,026 | ) | ||||||||||||||
| Net insurance contract liabilities |
$ |
(19,061 |
) |
$ |
(2,582 |
) |
$ |
(21,643 |
) |
$ | (16,327 | ) | $ | (2,018 | ) | $ | (18,345 | ) | ||||||||
| Insurance revenue |
$ |
5,382 |
$ |
– |
$ |
5,382 |
$ | 5,073 | $ | – | $ | 5,073 | ||||||||||||||
| Insurance service expense |
(405 |
) |
(4,048 |
) |
(4,453 |
) |
(358 | ) | (3,872 | ) | (4,230 | ) | ||||||||||||||
| Insurance finance income (expense) |
(1,193 |
) |
(27 |
) |
(1,220 |
) |
(2,974 | ) | (157 | ) | (3,131 | ) | ||||||||||||||
| Investment components |
708 |
(708 |
) |
– |
705 | (705 | ) | – | ||||||||||||||||||
| Cash flows: |
||||||||||||||||||||||||||
| Premiums received |
(6,911 |
) |
– |
(6,911 |
) |
(5,940 | ) | – | (5,940 | ) | ||||||||||||||||
| Claims and other insurance service expenses paid |
– |
4,650 |
4,650 |
– | 4,388 | 4,388 | ||||||||||||||||||||
| Insurance acquisition cash flows and other |
498 |
– |
498 |
417 | – | 417 | ||||||||||||||||||||
| Total cash flows |
$ |
(6,413 |
) |
$ |
4,650 |
$ |
(1,763 |
) |
$ | (5,523 | ) | $ | 4,388 | $ | (1,135 | ) | ||||||||||
| Other movements |
(911 |
) |
862 |
(49 |
) |
343 | (218 | ) | 125 | |||||||||||||||||
| Balance at end of period: |
||||||||||||||||||||||||||
| Insurance contract assets |
$ |
1,189 |
$ |
(608 |
) |
$ |
581 |
$ | 1,805 | $ | (1,217 | ) | $ | 588 | ||||||||||||
| Insurance contract liabilities |
(23,082 |
) |
(1,245 |
) |
(24,327 |
) |
(20,866 | ) | (1,365 | ) | (22,231 | ) | ||||||||||||||
| Net insurance contract liabilities |
$ |
(21,893 |
) |
$ |
(1,853 |
) |
$ |
(23,746 |
) |
$ | (19,061 | ) | $ | (2,582 | ) | $ | (21,643 | ) | ||||||||
| (1) | The ending liabilities for remaining coverage include loss component amounts of $702 million (October 31, 2024 – $366 million). |
(2) |
The ending liabilities for incurred claims includes $941 million (October 31, 2024 – $914 million) attributable to insurance contracts measured under the PAA. |
As at or for the year ended |
||||||||||||||||||||||||||||||||||
October 31, 2025 |
October 31, 2024 |
|||||||||||||||||||||||||||||||||
(Millions of Canadian dollars) |
Estimates of present value of future cash flows |
Risk adjustment for non- financial risk |
CSM (1) |
Total |
Estimates of present value of future cash flows |
Risk adjustment for non- financial risk |
CSM (1) |
Total |
||||||||||||||||||||||||||
| Balance at beginning of period: |
||||||||||||||||||||||||||||||||||
| Insurance contract assets |
$ |
1,824 |
$ |
(568 |
) |
$ |
(719 |
) |
$ |
537 |
$ | 1,591 | $ | (544 | ) | $ | (565 | ) | $ | 482 | ||||||||||||||
| Insurance contract liabilities |
(17,275 |
) |
(1,986 |
) |
(2,072 |
) |
(21,333 |
) |
(14,079 | ) | (1,759 | ) | (2,195 | ) | (18,033 | ) | ||||||||||||||||||
| Net insurance contract liabilities |
$ |
(15,451 |
) |
$ |
(2,554 |
) |
$ |
(2,791 |
) |
$ |
(20,796 |
) |
$ | (12,488 | ) | $ | (2,303 | ) | $ | (2,760 | ) | $ | (17,551 | ) | ||||||||||
| Insurance service result |
$ |
(169 |
) |
$ |
25 |
$ |
435 |
$ |
291 |
$ | 33 | $ | 13 | $ | 176 | $ | 222 | |||||||||||||||||
| Insurance finance expense (income) |
(1,076 |
) |
16 |
(134 |
) |
(1,194 |
) |
(2,504 | ) | (324 | ) | (128 | ) | (2,956 | ) | |||||||||||||||||||
| Cash flows: |
||||||||||||||||||||||||||||||||||
| Premiums received |
(5,255 |
) |
– |
– |
(5,255 |
) |
(4,443 | ) | – | – | (4,443 | ) | ||||||||||||||||||||||
| Claims and other insurance service expenses paid |
3,633 |
– |
– |
3,633 |
3,487 | – | – | 3,487 | ||||||||||||||||||||||||||
| Insurance acquisition cash flows and other |
498 |
– |
– |
498 |
373 | – | – | 373 | ||||||||||||||||||||||||||
| Total cash flows |
$ |
(1,124 |
) |
$ |
– |
$ |
– |
$ |
(1,124 |
) |
$ | (583 | ) | $ | – | $ | – | $ | (583 | ) | ||||||||||||||
| Other movements |
(13 |
) |
(54 |
) |
14 |
(53 |
) |
91 | 60 | (79 | ) | 72 | ||||||||||||||||||||||
| Balance at end of period: |
||||||||||||||||||||||||||||||||||
| Insurance contract assets |
$ |
1,665 |
$ |
(498 |
) |
$ |
(643 |
) |
$ |
524 |
$ | 1,824 | $ | (568 | ) | $ | (719 | ) | $ | 537 | ||||||||||||||
| Insurance contract liabilities (2) |
(19,498 |
) |
(2,069 |
) |
(1,833 |
) |
(23,400 |
) |
(17,275 | ) | (1,986 | ) | (2,072 | ) | (21,333 | ) | ||||||||||||||||||
| Net insurance contract liabilities |
$ |
(17,833 |
) |
$ |
(2,567 |
) |
$ |
(2,476 |
) |
$ |
(22,876 |
) |
$ | (15,451 | ) | $ | (2,554 | ) | $ | (2,791 | ) | $ | (20,796 | ) | ||||||||||
(1) |
The ending balance for CSM includes $2.4 billion (October 31, 2024 – $2.6 billion) relating to groups of insurance contracts initially recognized at transition date using the fair value approach. For the year ended October 31, 2025, CSM from contracts initially recognized was $86 million (October 31, 2024 – $89 million). |
(2) |
Includes segregated fund insurance contract liabilities of $3,877 million (October 31, 2024 – $3,375 million) measured using the VFA. The fair value of the underlying items for segregated fund insurance contracts amount to $3,810 million (October 31, 2024 – $3,378 million), which are substantially investments in mutual funds. |
| Note 15 Insurance and reinsurance (continued) |
| As at | ||||||||||||||||||||||||||||||||||||||||||||
October 31, 2025 |
October 31, 2024 | |||||||||||||||||||||||||||||||||||||||||||
(Millions of Canadian dollars) |
Within 1 year |
1 to 5 year |
5 to 10 years |
Thereafter |
Total |
Within 1 year |
|
1 to 5 year |
|
5 to 10 years |
|
Thereafter | Total | |||||||||||||||||||||||||||||||
| Insurance contracts issued |
$ |
(222 |
) |
$ |
(814 |
) |
$ |
(634 |
) |
$ |
(806 |
) |
$ |
(2,476 |
) |
$ | (243 | ) | $ | (894 | ) | $ | (705 | ) | $ | (949 | ) | $ | (2,791 | ) | ||||||||||||||
| Reinsurance contracts held |
68 |
213 |
167 |
226 |
674 |
66 | 208 | 163 | 217 | 654 | ||||||||||||||||||||||||||||||||||
| Total |
$ |
(154 |
) |
$ |
(601 |
) |
$ |
(467 |
) |
$ |
(580 |
) |
$ |
(1,802 |
) |
$ | (177 | ) | $ | (686 | ) | $ | (542 | ) | $ | (732 | ) | $ | (2,137 | ) | ||||||||||||||
| • | Mortality, longevity and morbidity |
| • | Policyholder behaviour |
| • | Expense |
5 year |
10 year |
20 year |
30 year |
Ultimate |
||||||||||||||||
| October 31, 2025 |
4.3% |
6.0% |
7.3% |
5.1% |
4.1% |
|||||||||||||||
| October 31, 2024 |
4.2% | 5.6% | 6.0% | 4.2% | 4.1% | |||||||||||||||
As at and for the year ended |
||||||||||||||||||||||||||||||||
October 31, 2025 |
October 31, 2024 |
|||||||||||||||||||||||||||||||
(Millions of Canadian dollars) |
Increase (decrease) to net income and total equity |
Increase (decrease) to CSM |
Increase (decrease) to net income and total equity |
Increase (decrease) to CSM |
||||||||||||||||||||||||||||
| Market variables: |
||||||||||||||||||||||||||||||||
| 1% increase in market interest rates (1) |
$ |
(10 |
) |
$ |
– |
$ | 3 | $ | – | |||||||||||||||||||||||
| 1% decrease in market interest rates (1) |
5 |
– |
(2 | ) | – | |||||||||||||||||||||||||||
| 10% increase in equity market values (2) |
2 |
14 |
– | 16 | ||||||||||||||||||||||||||||
| 10% decrease in equity market values (2) |
(2 |
) |
(16 |
) |
– | (18 | ) | |||||||||||||||||||||||||
| Non-financial variables: |
||||||||||||||||||||||||||||||||
| 2% adverse change in life mortality rates |
(32 |
) |
(17 |
) |
(45 | ) | (17 | ) | ||||||||||||||||||||||||
| 2% adverse change in annuitant mortality rates |
(12 |
) |
(147 |
) |
(1 | ) | (151 | ) | ||||||||||||||||||||||||
| 5% adverse change in morbidity rates |
(61 |
) |
(187 |
) |
(57 | ) | (179 | ) | ||||||||||||||||||||||||
| 10% adverse change in lapse rates |
(21 |
) |
(360 |
) |
(16 | ) | (334 | ) | ||||||||||||||||||||||||
| 5% increase in expenses |
(6 |
) |
(53 |
) |
(5 | ) | (52 | ) | ||||||||||||||||||||||||
| (1) | Interest rate sensitivities assume a parallel shift of 100 basis points across the entire yield curves as at the reporting date with no change to the ultimate risk-free rate. The impacts are net of the changes in fair value of financial assets held in respect of insurance activities. |
| (2) | Equity market value sensitivities assume a 10% change across all equity markets as at the reporting date reflecting the changes in fair value of the underlying financial assets on the insurance contracts measured using the VFA. |
Note 16 Employee benefits – Pension and other post-employment benefits |
| As at | ||||||||||||||||||||
October 31, 2025 |
October 31, 2024 | |||||||||||||||||||
(Millions of Canadian dollars) |
Defined benefit pension plans |
Other post- employment benefit plans |
Defined benefit pension plans |
Other post- employment benefit plans |
||||||||||||||||
Canada |
||||||||||||||||||||
Fair value of plan assets |
$ |
17,212 |
$ |
– |
$ | 16,421 | $ | – | ||||||||||||
Present value of defined benefit obligation |
13,558 |
1,610 |
13,142 | 1,563 | ||||||||||||||||
Net surplus (deficit) |
$ |
3,654 |
$ |
(1,610 |
) |
$ | 3,279 | $ | (1,563 | ) | ||||||||||
International |
||||||||||||||||||||
Fair value of plan assets |
$ |
745 |
$ |
– |
$ | 741 | $ | – | ||||||||||||
Present value of defined benefit obligation |
650 |
73 |
638 | 76 | ||||||||||||||||
Net surplus (deficit) |
$ |
95 |
$ |
(73 |
) |
$ | 103 | $ | (76 | ) | ||||||||||
Total |
||||||||||||||||||||
Fair value of plan assets |
$ |
17,957 |
$ |
– |
$ | 17,162 | $ | – | ||||||||||||
Present value of defined benefit obligation |
14,208 |
1,683 |
13,780 | 1,639 | ||||||||||||||||
Total net surplus (deficit) |
$ |
3,749 |
$ |
(1,683 |
) |
$ | 3,382 | $ | (1,639 | ) | ||||||||||
Effect of asset ceiling |
(20 |
) |
– |
(37 | ) | – | ||||||||||||||
Total net surplus (deficit), net of effect of asset ceiling |
$ |
3,729 |
$ |
(1,683 |
) |
$ | 3,345 | $ | (1,639 | ) | ||||||||||
Amounts recognized in our Consolidated Balance Sheets |
||||||||||||||||||||
Employee benefit assets |
$ |
4,012 |
$ |
– |
$ | 3,630 | $ | – | ||||||||||||
Employee benefit liabilities |
(283 |
) |
(1,683 |
) |
(285 | ) | (1,639 | ) | ||||||||||||
Total net surplus (deficit), net of effect of asset ceiling |
$ |
3,729 |
$ |
(1,683 |
) |
$ | 3,345 | $ | (1,639 | ) | ||||||||||
| As at or for the year ended | ||||||||||||||||||||
October 31, 2025 |
October 31, 2024 | |||||||||||||||||||
(Millions of Canadian dollars) |
Defined benefit pension plans (1) |
Other post- employment benefit plans |
Defined benefit pension plans (1) |
Other post- employment benefit plans |
||||||||||||||||
Fair value of plan assets at beginning of period |
$ |
17,162 |
$ |
– |
$ | 14,368 | $ | – | ||||||||||||
Interest income |
812 |
– |
818 | – | ||||||||||||||||
Remeasurements |
||||||||||||||||||||
Return on plan assets (excluding interest income) |
631 |
– |
1,991 | – | ||||||||||||||||
Change in foreign currency exchange rate |
18 |
– |
46 | – | ||||||||||||||||
Contributions – Employer |
31 |
95 |
29 | 91 | ||||||||||||||||
Contributions – Plan participant |
41 |
27 |
42 | 24 | ||||||||||||||||
Payments |
(716 |
) |
(122 |
) |
(675 | ) | (115 | ) | ||||||||||||
Business combinations/Disposals |
– |
– |
561 | – | ||||||||||||||||
Other |
(22 |
) |
– |
(18 | ) | – | ||||||||||||||
Fair value of plan assets at end of period |
$ |
17,957 |
$ |
– |
$ | 17,162 | $ | – | ||||||||||||
Benefit obligation at beginning of period |
$ |
13,780 |
$ |
1,639 |
$ | 11,727 | $ | 1,417 | ||||||||||||
Current service costs |
210 |
34 |
188 | 34 | ||||||||||||||||
Past service costs |
49 |
– |
– | (6 | ) | |||||||||||||||
Interest expense |
648 |
76 |
668 | 81 | ||||||||||||||||
Remeasurements |
||||||||||||||||||||
Actuarial losses (gains) from demographic assumptions |
7 |
15 |
(167 | ) | (60 | ) | ||||||||||||||
Actuarial losses (gains) from financial assumptions |
142 |
8 |
1,337 | 132 | ||||||||||||||||
Actuarial losses (gains) from experience adjustments |
28 |
5 |
2 | 8 | ||||||||||||||||
Change in foreign currency exchange rate |
19 |
1 |
37 | 3 | ||||||||||||||||
Contributions – Plan participant |
41 |
27 |
42 | 24 | ||||||||||||||||
Payments |
(716 |
) |
(122 |
) |
(675 | ) | (115 | ) | ||||||||||||
Business combinations/Disposals |
– |
– |
621 | 121 | ||||||||||||||||
Benefit obligation at end of period |
$ |
14,208 |
$ |
1,683 |
$ | 13,780 | $ | 1,639 | ||||||||||||
Unfunded obligation |
$ |
84 |
$ |
1,683 |
$ | 83 | $ | 1,639 | ||||||||||||
Wholly or partly funded obligation |
14,124 |
– |
13,697 | – | ||||||||||||||||
Total benefit obligation |
$ |
14,208 |
$ |
1,683 |
$ | 13,780 | $ | 1,639 | ||||||||||||
| (1) | For pension plans with funding deficits, the benefit obligations and fair value of plan assets as at October 31, 2025 were $890 million and $607 million, respectively (October 31, 2024 – $929 million and $665 million, respectively). |
| For the year ended | ||||||||||||||||||
| Pension plans | Other post-employment benefit plans |
|||||||||||||||||
(Millions of Canadian dollars) |
October 31 2025 |
October 31 2024 |
October 31 2025 |
October 31 2024 |
||||||||||||||
Current service costs |
$ |
210 |
$ | 188 | $ |
34 |
$ | 34 | ||||||||||
Past service costs |
49 |
– | – |
(6 | ) | |||||||||||||
Net interest expense (income) |
(164 |
) |
(150 | ) | 76 |
81 | ||||||||||||
Remeasurements of other long-term benefits |
– |
– | 10 |
3 | ||||||||||||||
Administrative expense |
22 |
18 | – |
– | ||||||||||||||
Defined benefit pension expense |
$ |
117 |
$ | 56 | $ |
120 |
$ | 112 | ||||||||||
Defined contribution pension expense |
562 |
426 | – |
– | ||||||||||||||
$ |
679 |
$ | 482 | $ |
120 |
$ | 112 | |||||||||||
| Note 16 Employee benefits – Pension and other post-employment benefits (continued) |
| For the year ended | ||||||||||||||||||||
| Defined benefit pension plans |
Other post-employment benefit plans |
|||||||||||||||||||
(Millions of Canadian dollars) |
October 31 2025 |
October 31 2024 |
October 31 2025 |
October 31 2024 |
||||||||||||||||
| Actuarial (gains) losses: |
||||||||||||||||||||
| Changes in demographic assumptions |
$ |
7 |
$ | (167 | ) | $ |
14 |
$ | (50 | ) | ||||||||||
| Changes in financial assumptions |
142 |
1,337 | 6 |
122 | ||||||||||||||||
| Experience adjustments |
28 |
2 | (2 |
) |
5 | |||||||||||||||
| Return on plan assets (excluding interest based on discount rate) |
(631 |
) |
(1,991 | ) | – |
– | ||||||||||||||
| Change in asset ceiling (excluding interest income) |
(17 |
) |
(4 | ) | – |
– | ||||||||||||||
$ |
(471 |
) |
$ | (823 | ) | $ |
18 |
$ | 77 | |||||||||||
| • | the nature of the underlying benefit obligations, including the duration and term profile of the liabilities; |
| • | the member demographics, including expectations for normal retirements, terminations, and deaths; |
| • | the financial position of the pension plans; |
| • | the diversification benefits obtained by the inclusion of multiple asset classes; and |
| • | expected asset returns, including asset and liability correlations, along with liquidity requirements of the plan. |
As at |
||||||||||||||||||||||||||||
October 31, 2025 |
October 31, 2024 |
|||||||||||||||||||||||||||
(Millions of Canadian dollars, except percentages) |
Fair value |
Percentage of total plan assets |
Quoted in active market (3) |
Fair value | Percentage of total plan assets |
Quoted in active market (3) |
||||||||||||||||||||||
| Equity securities |
||||||||||||||||||||||||||||
| Domestic |
$ |
1,198 |
7 |
% |
100 |
% |
$ | 926 | 5 | % | 100 | % | ||||||||||||||||
| Foreign |
3,227 |
18 |
100 |
2,306 | 13 | 100 | ||||||||||||||||||||||
| Debt securities |
||||||||||||||||||||||||||||
| Domestic government bonds (4) |
5,312 |
30 |
– |
5,608 | 33 | – | ||||||||||||||||||||||
| Foreign government bonds |
84 |
– |
– |
145 | 1 | – | ||||||||||||||||||||||
| Corporate and other bonds |
3,489 |
19 |
– |
3,788 | 22 | – | ||||||||||||||||||||||
| Alternative investments and other |
4,647 |
26 |
7 |
4,389 | 26 | 8 | ||||||||||||||||||||||
$ |
17,957 |
100 |
% |
26 |
% |
$ | 17,162 | 100 | % | 21 | % | |||||||||||||||||
| (1) | The asset allocation is based on the underlying investments held directly and indirectly through the funds as this is how we manage our investment policy and strategies. |
| (2) | Represents the total plan assets held in our Canadian and International pension plans. |
| (3) | If our assessment of whether or not an asset was quoted in an active market was based on direct investments, 30% of our total plan assets would be classified as quoted in an active market (October 31, 2024 – 25%). |
| (4) | Amounts are net of securities sold under repurchase agreements. |
| (Millions of Canadian dollars, except participants and years) | As at October 31, 2025 |
|||||||||||
Canada |
International |
Total |
||||||||||
| Number of plan participants |
68,421 |
5,851 |
74,272 |
|||||||||
| Actual benefit payments 2025 |
$ |
680 |
$ |
36 |
$ |
716 |
||||||
| Benefits expected to be paid 2026 |
740 |
37 |
777 |
|||||||||
| Benefits expected to be paid 2027 |
767 |
36 |
803 |
|||||||||
| Benefits expected to be paid 2028 |
789 |
35 |
824 |
|||||||||
| Benefits expected to be paid 2029 |
807 |
37 |
844 |
|||||||||
| Benefits expected to be paid 2030 |
827 |
39 |
866 |
|||||||||
| Benefits expected to be paid 2031-2035 |
4,348 |
200 |
4,548 |
|||||||||
| Weighted average duration of defined benefit payments |
13.0 years |
13.2 years |
13.0 years |
|||||||||
| Note 16 Employee benefits – Pension and other post-employment benefits (continued) |
| As at | ||||||||||||||||||||
| Defined benefit pension plans |
Other post-employment benefit plans |
|||||||||||||||||||
| October 31 2025 |
October 31 2024 |
October 31 2025 |
October 31 2024 |
|||||||||||||||||
| Discount rate |
4.7% |
4.8% | 4.9% |
4.9% | ||||||||||||||||
| Rate of increase in future compensation |
3.0% |
3.0% | n.a. |
n.a. | ||||||||||||||||
| Healthcare cost trend rates (1) |
||||||||||||||||||||
| – Medical |
n.a. |
n.a. | 3.5% |
3.5% | ||||||||||||||||
| – Dental |
n.a. |
n.a. | 3.5% |
3.5% | ||||||||||||||||
| (1) | For our other post-employment benefit plans, the assumed trend rates used to measure the expected benefit costs of the defined benefit obligations are also the ultimate trend rates. |
| n.a. | not applicable |
| As at | ||||||||||||||||||||||||||||||||||||||||||||
October 31, 2025 |
October 31, 2024 | |||||||||||||||||||||||||||||||||||||||||||
Life expectancy at 65 for a member currently at |
Life expectancy at 65 for a member currently at | |||||||||||||||||||||||||||||||||||||||||||
Age 65 |
Age 45 |
Age 65 | Age 45 | |||||||||||||||||||||||||||||||||||||||||
(In years) |
Male |
Female |
Male |
Female |
Male | Female | Male | Female | ||||||||||||||||||||||||||||||||||||
| Country |
||||||||||||||||||||||||||||||||||||||||||||
| Canada |
23.3 |
24.4 |
24.3 |
25.4 |
23.2 | 24.4 | 24.2 | 25.3 | ||||||||||||||||||||||||||||||||||||
| United Kingdom |
22.3 |
24.5 |
23.6 |
25.8 |
22.1 | 24.4 | 23.4 | 25.7 | ||||||||||||||||||||||||||||||||||||
Increase (decrease) in obligation |
||||||||
(Millions of Canadian dollars) |
Defined benefit pension plans |
Other post- employment benefit plans |
||||||
| Discount rate |
||||||||
| Impact of 100 bps increase in discount rate |
$ |
(1,597 |
) |
$ |
(182 |
) | ||
| Impact of 100 bps decrease in discount rate |
1,967 |
224 |
||||||
| Rate of increase in future compensation |
||||||||
| Impact of 50 bps increase in rate of increase in future compensation |
24 |
– |
||||||
| Impact of 50 bps decrease in rate of increase in future compensation |
(25 |
) |
– |
|||||
| Mortality rate |
||||||||
| Impact of an increase in longevity by one additional year |
380 |
23 |
||||||
| Healthcare cost trend rate |
||||||||
| Impact of 100 bps increase in healthcare cost trend rate |
n.a. |
51 |
||||||
| Impact of 100 bps decrease in healthcare cost trend rate |
n.a. |
(43 |
) | |||||
| n.a. | not applicable |
| Note 17 Other liabilities |
| As at | ||||||||
(Millions of Canadian dollars) |
October 31 2025 |
October 31 2024 |
||||||
| Accounts payable and accrued expenses |
$ |
1,663 |
$ | 1,475 | ||||
| Accrued interest payable |
11,784 |
13,226 | ||||||
| Cash collateral |
22,133 |
19,582 | ||||||
| Commodity liabilities |
17,692 |
13,996 | ||||||
| Deferred income |
4,277 |
4,149 | ||||||
| Deferred income taxes |
484 |
542 | ||||||
| Dividends payable |
2,306 |
2,123 | ||||||
| Employee benefit liabilities |
1,966 |
1,924 | ||||||
| Lease liabilities |
4,586 |
4,673 | ||||||
| Negotiable instruments |
1,609 |
1,702 | ||||||
| Payable to brokers, dealers and clients |
9,487 |
8,270 | ||||||
| Payroll and related compensation |
13,574 |
11,781 | ||||||
| Precious metals liabilities |
3,196 |
743 | ||||||
| Provisions |
782 |
793 | ||||||
| Short-term borrowings of subsidiaries |
2,804 |
– | ||||||
| Taxes payable |
2,852 |
2,398 | ||||||
| Other |
7,396 |
7,335 | ||||||
$ |
108,591 |
$ | 94,712 | |||||
| Note 18 Subordinated debentures |
| (Millions of Canadian dollars, except percentage and foreign currency) | Interest rate |
Denominated in foreign currency (millions) |
As at | |||||||||||||||
Maturity |
Earliest par value redemption date |
October 31 2025 |
October 31 2024 |
|||||||||||||||
| January 27, 2026 (1) |
4.65% | US$ | 1,500 | $ |
2,091 |
$ | 2,026 | |||||||||||
| December 23, 2029 (1) , (2) |
December 23, 2024 | 2.88% | – |
1,495 | ||||||||||||||
| June 30, 2030 (1), (3) |
June 30, 2025 | 2.088% | – |
1,219 | ||||||||||||||
| November 3, 2031 (1 ) |
November 3, 2026 |
2.14% | (4) |
1,628 |
1,708 | |||||||||||||
| May 3, 2032 (1) |
May 3, 2027 | 2.94% | (5) |
984 |
955 | |||||||||||||
| January 28, 2033 (1) |
January 28, 2028 |
1.67% | (6) |
967 |
935 | |||||||||||||
| February 1, 2033 (1) |
February 1, 2028 | 5.01% | (7) |
1,520 |
1,461 | |||||||||||||
| April 3, 2034 (1) |
April 3, 2029 | 5.096% | (8) |
2,038 |
2,020 | |||||||||||||
| August 8, 2034 (1) |
August 8, 2029 | 4.829% | (9) |
1,273 |
1,263 | |||||||||||||
| February 4, 2035 (1) |
February 4, 2030 | 4.279% | (10) |
1,512 |
– | |||||||||||||
| July 3, 2035 (1) |
July 3, 2030 | 4.214% | (11) |
1,250 |
– | |||||||||||||
| July 17, 2035 (1) |
July 17, 2030 | 1.963% | (12) |
¥ | 26,000 | 232 |
– | |||||||||||
| October 1, 2083 |
Any interest payment date | (13) |
224 |
224 | ||||||||||||||
| November 1, 2083 |
Any interest payment date | (14) |
9 |
9 | ||||||||||||||
| June 29, 2085 |
Any interest payment date | (15) |
US$ | 174 | 243 |
241 | ||||||||||||
$ |
13,971 |
$ | 13,556 | |||||||||||||||
| Deferred financing costs |
(10 |
) |
(10 | ) | ||||||||||||||
$ |
13,961 |
$ | 13,546 | |||||||||||||||
| (1) | The notes include non-viability contingent capital (NVCC) provisions, necessary for the notes to qualify as Tier 2 regulatory capital under Basel III. NVCC provisions require the conversion of the instrument into a variable number of common shares in the event that OSFI deems the Bank non-viable or a federal or provincial government in Canada publicly announces that the Bank has accepted or agreed to accept a capital injection. In such an event, each note is convertible into common shares pursuant to an automatic conversion formula with a multiplier of 1.5 and a conversion price based on the greater of: (i) a floor price of $5.00 (subject to adjustment in certain circumstances), and (ii) the current market price of our common shares based on the volume weighted average trading price of our common shares on the Toronto Stock Exchange. The number of shares issued is determined by multiplying the par value of the note (including accrued and unpaid interest on such note) by the multiplier and then dividing the total by the conversion price. |
| (2) | On December 23, 2024, we redeemed all $1,500 million of our outstanding 2.88% subordinated debentures due December 23, 2029 for 100% of their principal amount plus interest accrued to, but excluding, the redemption date. |
| (3) | On June 30, 2025, we redeemed all $1,250 million of our outstanding 2.088% subordinated debentures due June 30, 2030 for 100% of their principal amount plus interest accrued to, but excluding, the redemption date. |
| (4) | Interest at stated interest rate until earliest par value redemption date, and thereafter at a rate of 0.93% above the Daily Compounded CORRA. |
| (5) | Interest at stated interest rate until earliest par value redemption date, and thereafter at a rate of 1.08% above the Daily Compounded CORRA. |
| (6) | Interest at stated interest rate until earliest par value redemption date, and thereafter at a rate of 0.87% above the Daily Compounded CORRA. |
| (7) | Interest at stated interest rate until earliest par value redemption date, and thereafter at a rate of 2.12% above the Daily Compounded CORRA. |
| (8) | Interest at stated interest rate until earliest par value redemption date, and thereafter at a rate of 1.56% above the Daily Compounded CORRA. |
| (9) | Interest at stated interest rate until earliest par value redemption date, and thereafter at a rate of 1.55% above the Daily Compounded CORRA. |
| (10) | Interest at stated interest rate until earliest par value redemption date, and thereafter at a rate of 1.45% above the Daily Compounded CORRA. |
| (11) | Interest at stated interest rate until earliest par value redemption date, and thereafter at a rate of 1.51% above the Daily Compounded CORRA. |
| (12) | Interest at stated interest rate until earliest par value redemption date, and thereafter at a rate of 1.02% above the 5-Year Tokyo Overnight Average Rate mid-swap rate. |
| (13) | Interest at a rate of 0.50% plus the average of mid-market quotations for Government of Canada Treasury Bills maturing in or about 30 days from the date of quotation. |
| (14) | Interest at a rate of 0.75% plus the average of mid-market quotations for Government of Canada Treasury Bills maturing in or about 30 days from the date of quotation. |
| (15) | Interest at a rate of 0.44911% plus compounded SOFR. In the event of a reduction of the annual dividend we declare on our common shares, the interest payable on the debentures is reduced pro rata to the dividend reduction and the interest reduction is payable with the proceeds from the sale of newly issued common shares. |
Note 18 Subordinated debentures (continued) |
| As at | ||||
(Millions of Canadian dollars) |
October 31 2025 |
|||
Within 1 year |
$ |
2,091 |
||
1 to 5 years |
– |
|||
5 to 10 years |
11,404 |
|||
Thereafter |
476 |
|||
$ |
13,971 |
|||
Note 19 Equity |
| As at and for the year ended | ||||||||||||||||||||||||||||
October 31, 2025 |
October 31, 2024 | |||||||||||||||||||||||||||
(Millions of Canadian dollars, except the number of shares and as otherwise noted) |
Number of shares (thousands) |
Amount |
Dividends declared per share |
Number of shares (thousands) |
Amount | Dividends declared per share |
||||||||||||||||||||||
Common shares issued |
||||||||||||||||||||||||||||
Balance at beginning of period |
1,415,080 |
$ |
21,013 |
1,402,373 | $ | 19,398 | ||||||||||||||||||||||
Issued in connection with share-based compensation plans (1) |
796 |
77 |
1,746 | 168 | ||||||||||||||||||||||||
Issued in connection with dividend reinvestment plan |
– |
– |
11,850 | 1,460 | ||||||||||||||||||||||||
Purchased for cancellation (2) |
(15,241 |
) |
(227 |
) |
(889 | ) | (13 | ) | ||||||||||||||||||||
Balance at end of period |
1,400,635 |
$ |
20,863 |
$ |
6.04 |
1,415,080 | $ | 21,013 | $ | 5.60 | ||||||||||||||||||
Treasury – common shares |
||||||||||||||||||||||||||||
Balance at beginning of period (3) |
(576 |
) |
$ |
(61 |
) |
(1,862 | ) | $ | (231 | ) | ||||||||||||||||||
Purchases |
(41,204 |
) |
(5,811 |
) |
(43,995 | ) | (5,302 | ) | ||||||||||||||||||||
Sales |
41,259 |
5,762 |
45,281 | 5,472 | ||||||||||||||||||||||||
Balance at end of period (3) |
(521 |
) |
$ |
(110 |
) |
(576 | ) | $ | (61 | ) | ||||||||||||||||||
Common shares outstanding |
1,400,114 |
$ |
20,753 |
1,414,504 | $ | 20,952 | ||||||||||||||||||||||
Preferred shares and other equity instruments issued |
||||||||||||||||||||||||||||
First preferred (4) |
||||||||||||||||||||||||||||
Non-cumulative, fixed rate |
||||||||||||||||||||||||||||
Series BH |
6,000 |
$ |
150 |
$ |
1.23 |
6,000 | $ | 150 | $ | 1.23 | ||||||||||||||||||
Series BI |
6,000 |
150 |
1.23 |
6,000 | 150 | 1.23 | ||||||||||||||||||||||
Non-cumulative, 5-Year Rate Reset |
||||||||||||||||||||||||||||
Series BD (5) |
– |
– |
0.80 |
24,000 | 600 | 0.80 | ||||||||||||||||||||||
Series BF (6) |
12,000 |
300 |
0.75 |
12,000 | 300 | 0.75 | ||||||||||||||||||||||
Series BO |
14,000 |
350 |
1.47 |
14,000 | 350 | 1.40 | ||||||||||||||||||||||
Series BT (7) |
750 |
750 |
4.20% |
750 | 750 | 4.20% | ||||||||||||||||||||||
Series BU (7) |
750 |
750 |
7.408% |
750 | 750 | 7.408% | ||||||||||||||||||||||
Series BW (7) |
600 |
600 |
6.698% |
600 | 600 | 6.698% | ||||||||||||||||||||||
Other equity instruments |
||||||||||||||||||||||||||||
Limited recourse capital notes (LRCNs) |
||||||||||||||||||||||||||||
Series 1 (8) |
– |
– |
4.50% |
1,750 | 1,750 | 4.50% | ||||||||||||||||||||||
Series 2 (9), (10) |
1,250 |
1,250 |
4.00% |
1,250 | 1,250 | 4.00% | ||||||||||||||||||||||
Series 3 (9), (10) |
1,000 |
1,000 |
3.65% |
1,000 | 1,000 | 3.65% | ||||||||||||||||||||||
Series 4 (9), (10) |
1,000 |
1,370 |
7.50% |
1,000 | 1,370 | 7.50% | ||||||||||||||||||||||
Series 5 (9), (10) |
1,000 |
1,396 |
6.35% |
– | – | – | ||||||||||||||||||||||
Series 6 (9), (10) |
1,250 |
1,708 |
6.75% |
– | – | – | ||||||||||||||||||||||
Series 7 (9), (10) |
1,350 |
1,869 |
6.50% |
– | – | – | ||||||||||||||||||||||
46,950 |
$ |
11,643 |
69,100 | $ | 9,020 | |||||||||||||||||||||||
Treasury – preferred shares and other equity instruments |
||||||||||||||||||||||||||||
Balance at beginning of period (3) |
13 |
$ |
11 |
(9 | ) | $ | (9 | ) | ||||||||||||||||||||
Purchases |
(4,431 |
) |
(4,916 |
) |
(1,921 | ) | (1,225 | ) | ||||||||||||||||||||
Sales |
4,453 |
4,937 |
1,943 | 1,245 | ||||||||||||||||||||||||
Balance at end of period (3) |
35 |
$ |
32 |
13 | $ | 11 | ||||||||||||||||||||||
Preferred shares and other equity instruments outstanding |
46,985 |
$ |
11,675 |
69,113 | $ | 9,031 | ||||||||||||||||||||||
| (1) | Includes fair value adjustments to stock options of $5 million (October 31, 2024 – $10 million). |
| (2) | Our previous NCIB to purchase up to 30 million of our common shares ended June 11, 2025. On June 10, 2025, we announced a new NCIB to purchase up to 35 million of our common shares, commencing on June 12, 2025, and continuing until June 11, 2026, or such earlier date as we complete the repurchase of all shares permitted under the bid. During the year ended October 31, 2025, under the NCIB programs we purchased for cancellation common shares at a total fair value of $2,768 million (average cost of $181.59 per share), with a book value of $227 million (book value of $14.88 per share). During the year ended October 31, 2024, under the previous NCIB we purchased for cancellation common shares at a total fair value of $140 million (average cost of $157.74 per share), with a book value of $13 million (book value of $14.83 per share). |
| (3) | Positive amounts represent a short position and negative amounts represent a long position. |
| (4) | First Preferred Shares were issued at $25 per share with the exception of Non-Cumulative 5-Year Fixed Rate Reset First Preferred Shares Series BT (Series BT), Non-Cumulative 5-Year Fixed Rate Reset First Preferred Shares Series BU (Series BU) and Non-Cumulative 5-Year Fixed Rate Reset First Preferred Shares Series BW (Series BW) which were issued at $1,000 per share. |
| (5) | On May 24, 2025, we redeemed all 24 million of our issued and outstanding Non-Cumulative 5-Year Rate Reset First Preferred Shares Series BD at a redemption price of $25.00 per share. |
| (6) | On November 24, 2025, we redeemed all 12 million of our issued and outstanding Non-Cumulative 5-Year Rate Reset First Preferred Shares Series BF at a redemption price of $25.00 per share . |
| (7) | The dividends declared per share represent the per annum dividend rate applicable to the shares issued as at the reporting date. |
| (8) | On October 24, 2025, we redeemed all 1.75 million of our issued and outstanding Non-Cumulative 5-Year Fixed Rate Reset First Preferred Shares Series BQ at a redemption price of $1,000 per share. As a result of the redemption of the Series BQ Shares, we automatically redeemed all $1.75 billion outstanding Series 1 LRCN on the same date for 100% of their principal amount plus accrued interest to, but excluding, the redemption date. |
| (9) | LRCN Series 2 and 3 were issued at a $1,000 per note. LRCN Series 4, 5, 6 and 7 were issued at US$1,000 per note. The number of shares represent the number of notes issued and the dividends declared per share represent the annual interest rate percentage applicable to the notes issued as at the reporting date. |
| (10) | In connection with the issuance of LRCN Series 2, we issued $1,250 million of Non-Cumulative 5-Year Fixed Rate Reset First Preferred Shares Series BR (Series BR); in connection with the issuance of LRCN Series 3, we issued $1,000 million of Non-Cumulative 5-Year Fixed Rate Reset First Preferred Shares Series BS (Series BS); in connection with the issuance of LRCN Series 4, we issued US$1,000 million of Non-Cumulative 5-Year Fixed Rate Reset First Preferred Shares Series BV (Series BV); in connection with the issuance of LRCN Series 5, we issued US$1,000 million of Non-Cumulative 5-Year Fixed Rate Reset First Preferred Shares Series BX (Series BX); in connection with the issuance of LRCN Series 6, we issued US$1,250 million of Non-Cumulative 5-Year Fixed Rate Reset First Preferred Shares Series BY (Series BY); in connection with the issuance of LRCN Series 7, we issued US$1,350 million of Non-Cumulative 5-Year Fixed Rate Reset First Preferred Shares Series BZ (Series BZ). The Series BR and BS preferred shares were issued at a price of $1,000 per share and the Series BV, BX, BY and BZ preferred shares were issued at a price of US$1,000 per share. These preferred shares were issued to a consolidated trust to be held as trust assets in connection with each respective LRCN Series. |
Note 19 Equity (continued) |
As at October 31, 2025 |
Current annual yield |
Premium |
Current dividend per share |
Earliest redemption date |
Issue date |
Redemption price |
||||||||||||||||||
Preferred shares |
||||||||||||||||||||||||
First preferred |
||||||||||||||||||||||||
Non-cumulative, fixed rate |
||||||||||||||||||||||||
Series BH (4) |
4.90% | $ | 0.30625 | November 24, 2020 | June 5, 2015 | $ | 25.00 | |||||||||||||||||
Series BI (4) |
4.90% | 0.30625 | November 24, 2020 | July 22, 2015 | 25.00 | |||||||||||||||||||
Non-cumulative, 5-Year Rate Reset (5) |
||||||||||||||||||||||||
Series BF (4) |
3.00% | 2.62% | 0.1875 | November 24, 2020 | March 13, 2015 | 25.00 | ||||||||||||||||||
Series BO (4) |
5.885% | 2.38% | 0.3678125 | February 24, 2024 | November 2, 2018 | 25.00 | ||||||||||||||||||
Series BT (4) |
4.20% | 2.71% | 21.00 | January 24, 2027 | November 5, 2021 | 1,000.00 | ||||||||||||||||||
Series BU (4) |
7.408% | 3.90% | 37.04 | January 25, 2029 | January 25, 2024 | 1,000.00 | ||||||||||||||||||
Series BW (4) |
6.698% | 3.40% | 33.49 | October 24, 2029 | July 24, 2024 | 1,000.00 | ||||||||||||||||||
Other equity instruments |
||||||||||||||||||||||||
Limited recourse capital notes (6) |
||||||||||||||||||||||||
Series 2 (7) |
4.00% | 3.617% | n.a. | January 24, 2026 | November 2, 2020 | 1,000.00 | ||||||||||||||||||
Series 3 (8) |
3.65% | 2.665% | n.a. | October 24, 2026 | June 8, 2021 | 1,000.00 | ||||||||||||||||||
Series 4 (9) |
7.50% | 2.887% | n.a. | May 2, 2029 | April 24, 2024 | US$ | 1,000.00 | |||||||||||||||||
Series 5 (10) |
6.35% | 2.257% | n.a. | November 24, 2034 | November 1, 2024 | US$ | 1,000.00 | |||||||||||||||||
Series 6 (11) |
6.75% | 2.815% | n.a. | August 24, 2030 | June 11, 2025 | US$ | 1,000.00 | |||||||||||||||||
Series 7 (12) |
6.50% | 2.462% | n.a. | November 24, 2035 | September 23, 2025 | US$ | 1,000.00 | |||||||||||||||||
| (1) | With the exception of Series BT, BU and BW, non-cumulative preferential dividends of each Series are payable quarterly, as and when declared by the Board of Directors, on or about the 24th day of February, May, August and November. In the case of Series BT, BU and BW, non-cumulative preferential dividends are payable semi-annually, as and when declared by the Board of Directors. |
| (2) | Subject to the consent of OSFI and the requirements of the Bank Act 12-month period thereafter to a price per share of $25 if redeemed four years from the earliest redemption date or thereafter. In the case of Series BT and BW, these may be redeemed for cash at a price of $1,000 if redeemed during the earliest redemption period of January 24, 2027 to February 24, 2027 and October 24, 2029 to November 24, 2029, respectively, and during the same redemption period every fifth year thereafter. In the case of Series BU, these may be redeemed for cash at a price of $1,000 if redeemed during the earliest redemption period from January 25, 2029 to February 24, 2029 and during the period from January 24 to and including February 24 every fifth year thereafter. |
| (3) | Subject to the consent of OSFI and the requirements of the Bank Act |
| (4) | The preferred shares include NVCC provisions, necessary for the shares to qualify as Tier 1 regulatory capital under Basel III. NVCC provisions require the conversion of the instrument into a variable number of common shares in the event that OSFI deems the Bank non-viable or a federal or provincial government in Canada publicly announces that the Bank has accepted or agreed to accept a capital injection. In such an event, each preferred share is convertible into common shares pursuant to an automatic conversion formula with a multiplier of 1 and with a conversion price based on the greater of: (i) a floor price of $5 (subject to adjustment in certain circumstances), and (ii) the current market price of our common shares based on the volume weighted average trading price of our common shares on the Toronto Stock Exchange. The number of shares issued is determined by dividing the preferred share value by the conversion price. |
| (5) | The dividend rate will reset on the earliest redemption date or on the last day of the redemption period, as applicable, and every fifth year thereafter at a rate equal to the 5-Year Government of Canada bond yield plus the premium indicated. The holders of Series BF and BO shares have the option to convert their shares into non-cumulative floating rate First Preferred Shares subject to certain conditions on the earliest redemption date and every fifth year thereafter at a rate equal to the three-month Government of Canada Treasury Bill rate plus the premium indicated. |
| (6) | The current annual yield on each LRCN Series represents the annual interest rate applicable to the notes issued as at the reporting date. The payments of interest and principal in cash on the LRCN Series are made at our discretion, and non-payment of interest and principal in cash does not constitute an event of default. In the event of (i) non-payment of interest on any interest payment date, (ii) non-payment of the redemption price in case of a redemption of a LRCN Series, (iii) non-payment of principal at the maturity of a LRCN Series, or (iv) an event of default on a LRCN Series, holders of such LRCN Series will have recourse only to the assets (Trust Assets) held by a third-party trustee in a consolidated trust in respect of such LRCN Series and each such noteholder will be entitled to receive its pro rata share of the Trust Assets. In such an event, the delivery of the Trust Assets for each LRCN Series will represent the full and complete extinguishment of our obligations under the related LRCN Series. The LRCNs include NVCC provisions, necessary for the shares to qualify as Tier 1 regulatory capital under Basel III. NVCC provisions require the conversion of the instrument into a variable number of common shares in the event that OSFI deems the Bank non-viable or a federal or provincial government in Canada publicly announces that the Bank has accepted or agreed to accept a capital injection. In such an event, each note is automatically redeemed and the redemption price will be satisfied by the delivery of Trust Assets, which will consist of common shares pursuant to an automatic conversion of the series of preferred shares that were issued concurrently with the related LRCN Series. Each series of preferred shares include an automatic conversion formula with a conversion price based on the greater of: (i) a floor price of $5 (subject to adjustment in certain circumstances), and (ii) the current market price of our common shares based on the volume weighted average trading price of our common shares on the Toronto Stock Exchange. The number of common shares issued in respect of each series of preferred shares will be determined by dividing the preferred share value ($1,000 plus declared and unpaid dividends) by the conversion price. The number of common shares delivered to each noteholder will be based on such noteholder’s pro rata interest in the Trust Assets. Subject to the consent of OSFI, we may purchase LRCNs for cancellation at such price or prices and upon such terms and conditions as we in our absolute discretion may determine, subject to any applicable law restricting the purchase of notes. |
| (7) | LRCN Series 2 bear interest at a fixed rate of 4.0% per annum until February 24, 2026, and thereafter at a rate per annum, reset every fifth year, equal to the 5-Year Government of Canada Yield plus 3.617% until maturity on February 24, 2081. The interest is paid semi-annually on or about the 24th day of February and August. LRCN Series 2 is redeemable during the period from January 24 to and including February 24, commencing in 2026 and every fifth year thereafter to the extent we redeem Series BR pursuant to their terms and subject to the consent of OSFI and requirements of the Bank Act |
| (8) | LRCN Series 3 bear interest at a fixed rate of 3.65% per annum until November 24, 2026, and thereafter at a rate per annum, reset every fifth year, equal to the 5-Year Government of Canada Yield plus 2.665% until maturity on November 24, 2081. The interest is paid semi-annually on or about the 24th day of May and November. LRCN Series 3 is redeemable during the period from October 24 to and including November 24, commencing in 2026 and every fifth year thereafter to the extent we redeem Series BS pursuant to their terms and subject to the consent of OSFI and requirements of the Bank Act |
| (9) | LRCN Series 4 bear interest at a fixed rate of 7.5% per annum until May 2, 2029, and thereafter at a rate per annum, reset every fifth year, equal to the 5-Year U.S. Treasury Rate plus 2.887% until maturity on May 2, 2084. The interest is paid quarterly on or about the 2nd day of February, May, August and November. LRCN Series 4 is redeemable on May 2, 2029 and on each 2nd day of February, May, August and November thereafter to the extent we redeem Series BV pursuant to their terms and subject to the consent of OSFI and requirements of the Bank Act |
| (10) | LRCN Series 5 bear interest at a fixed rate of 6.35% per annum until November 24, 2034, and thereafter at a rate per annum, reset every fifth year, equal to the 5-Year U.S. Treasury Rate plus 2.257% until maturity on November 24, 2084. The interest is paid quarterly on or about the 24th day of February, May, August and November. LRCN Series 5 is redeemable on November 24, 2034 and on each 24th day of February, May, August and November thereafter to the extent we redeem Series BX pursuant to their terms and subject to the consent of OSFI and requirements of the Bank Act |
| (11) | LRCN Series 6 bear interest at a fixed rate of 6.75% per annum until August 24, 2030, and thereafter at a rate per annum, reset every fifth year, equal to the 5-Year U.S. Treasury Rate plus 2.815% until maturity on August 24, 2085. The interest is paid quarterly on or about the 24th day of February, May, August and November. LRCN Series 6 is redeemable on August 24, 2030 and on each 24th day of February, May, August and November thereafter to the extent we redeem Series BY pursuant to their terms and subject to the consent of OSFI and requirements of the Bank Act |
| (12) | LRCN Series 7 bear interest at a fixed rate of 6.50% per annum until November 24, 2035, and thereafter at a rate per annum, reset every fifth year, equal to the 5-Year U.S. Treasury Rate plus 2.462% until maturity on November 24, 2085. The interest is paid quarterly on or about the 24th day of February, May, August and November. LRCN Series 7 is redeemable on November 24, 2035 and on each 24th day of February, May, August and November thereafter to the extent we redeem Series BZ pursuant to their terms and subject to the consent of OSFI and requirements of the Bank Act |
| n.a. | not applicable |
Note 20 Share-based compensation | ||
| For the year ended | ||||||||||||||||||||
October 31, 2025 |
October 31, 2024 | |||||||||||||||||||
(Canadian dollars per share except option amounts) |
Number of options (thousands) |
Weighted average exercise price (1) |
Number of options (thousands) |
Weighted average exercise price (1) |
||||||||||||||||
Outstanding at beginning of period |
7,375 |
$ |
113.00 |
7,767 | $ | 106.01 | ||||||||||||||
Granted |
916 |
177.97 |
1,666 | 125.37 | ||||||||||||||||
Exercised (2), (3) |
(796 |
) |
90.31 |
(1,720 | ) | 91.03 | ||||||||||||||
Forfeited |
(5 |
) |
114.04 |
(338 | ) | 124.64 | ||||||||||||||
Outstanding at end of period |
7,490 |
$ |
123.37 |
7,375 | $ | 113.00 | ||||||||||||||
Exercisable at end of period |
3,522 |
$ |
105.02 |
3,212 | $ | 97.02 | ||||||||||||||
| (1) | The weighted average exercise prices reflect the conversion of foreign currency-denominated options at the exchange rates as of October 31, 2025 and October 31, 2024. For foreign currency-denominated options exercised during the year, the weighted average exercise prices are translated using exchange rates as at the settlement date. |
| (2) | Cash received for options exercised during the year was $72 million (October 31, 2024 – $157 million) and the weighted average share price at the date of exercise was $179.45 (October 31, 2024 – $144.69). |
| (3) | New shares were issued for all stock options exercised in 2025 and 2024. |
Options outstanding |
Options exercisable |
|||||||||||||||||||||||
(Canadian dollars per share except option amounts and years) |
Number outstanding (thousands) |
Weighted average exercise price (1) |
Weighted average remaining contractual life (years) |
Number exercisable (thousands) |
Weighted average exercise price (1) |
|||||||||||||||||||
$74.39 – $96.55 |
1,031 |
$ |
93.27 |
2.04 |
1,031 |
$ |
93.27 |
|||||||||||||||||
$102.33 – $104.70 |
1,067 |
103.95 |
3.46 |
1,067 |
103.95 |
|||||||||||||||||||
$106.00 – $106.00 |
930 |
106.00 |
5.12 |
930 |
106.00 |
|||||||||||||||||||
$125.37 – $129.99 |
2,579 |
127.21 |
7.32 |
494 |
129.99 |
|||||||||||||||||||
$131.64 – $177.97 |
1,883 |
154.17 |
8.10 |
– |
– |
|||||||||||||||||||
7,490 |
$ |
123.37 |
5.97 |
3,522 |
$ |
105.02 |
||||||||||||||||||
| (1) | The weighted average exercise prices reflect the conversion of foreign currency-denominated options at the exchange rate as of October 31, 2025. |
| Note 20 Share-based compensation (continued) |
For the year ended |
||||||||
(Canadian dollars per share except percentages and years) |
October 31 2025 |
October 31 2024 |
||||||
| Share price at grant date |
$ |
177.97 |
$ | 128.62 | ||||
| Risk-free interest rate |
3.00% |
3.29% | ||||||
| Expected dividend yield |
3.85% |
4.20% | ||||||
| Expected share price volatility |
17% |
16% | ||||||
| Expected life of option |
6 Years |
6 Years | ||||||
| For the year ended | ||||||||||||||||||
October 31, 2025 |
October 31, 2024 | |||||||||||||||||
(Units and per unit amounts) |
Units granted (thousands) |
Weighted average fair value per unit |
Units granted (thousands) |
Weighted average fair value per unit |
||||||||||||||
| Deferred share unit plans |
438 |
$ |
176.00 |
550 | $ | 134.64 | ||||||||||||
| Capital Markets compensation plan unit awards |
3,147 |
203.17 |
3,053 | 167.79 | ||||||||||||||
| Performance deferred share award plans |
2,202 |
178.57 |
2,848 | 123.83 | ||||||||||||||
| Deferred compensation plans |
85 |
172.35 |
86 | 132.99 | ||||||||||||||
| Other share-based plans |
886 |
177.42 |
1,108 | 129.38 | ||||||||||||||
6,758 |
$ |
189.63 |
7,645 | $ | 143.07 | |||||||||||||
| As at | ||||||||||||||||||
October 31, 2025 |
October 31, 2024 | |||||||||||||||||
(Millions of Canadian dollars except units) |
Units (thousands) |
Carrying amount |
Units (thousands) |
Carrying amount |
||||||||||||||
| Deferred share unit plans |
6,324 |
$ |
1,299 |
6,243 | $ | 1,051 | ||||||||||||
| Capital Markets compensation plan unit awards |
8,762 |
1,788 |
9,593 | 1,603 | ||||||||||||||
| Performance deferred share award plans |
6,170 |
1,267 |
6,068 | 1,022 | ||||||||||||||
| Deferred compensation plans (1) |
1,972 |
405 |
2,109 | 355 | ||||||||||||||
| Other share-based plans |
2,258 |
434 |
2,394 | 363 | ||||||||||||||
25,486 |
$ |
5,193 |
26,407 | $ | 4,394 | |||||||||||||
| (1) | Excludes obligations not determined based on the quoted market price of our common shares. |
| For the year ended | ||||||||
(Millions of Canadian dollars) |
October 31 2025 |
October 31 2024 |
||||||
| Deferred share unit plans |
$ |
292 |
$ | 395 | ||||
| Capital Markets compensation plan unit awards |
519 |
643 | ||||||
| Performance deferred share award plans |
645 |
685 | ||||||
| Deferred compensation plans |
645 |
797 | ||||||
| Other share-based plans |
237 |
276 | ||||||
$ |
2,338 |
$ | 2,796 | |||||
| Note 21 Income taxes |
For the year ended |
||||||||
(Millions of Canadian dollars) |
October 31 2025 |
October 31 2024 |
||||||
| Income taxes (recoveries) in Consolidated Statements of Income |
||||||||
| Current tax |
||||||||
| Tax expense for current year |
$ |
5,534 |
$ | 4,829 | ||||
| Adjustments for prior years |
106 |
298 | ||||||
| Recoveries arising from previously unrecognized tax loss, tax credit or temporary difference of a prior period |
(4 |
) |
(4 | ) | ||||
5,636 |
5,123 | |||||||
| Deferred tax |
||||||||
| Origination and reversal of temporary difference |
(118 |
) |
(1,118 | ) | ||||
| Adjustments for prior years |
(235 |
) |
(383 | ) | ||||
| Recoveries arising from previously unrecognized tax loss, tax credit or temporary difference of a prior period, net |
(1 |
) |
– | |||||
(354 |
) |
(1,501 | ) | |||||
5,282 |
3,622 | |||||||
| Income taxes (recoveries) in Consolidated Statements of Comprehensive Income and Changes in Equity |
||||||||
| Other comprehensive income |
||||||||
| Net unrealized gains (losses) on debt securities and loans at fair value through other comprehensive income |
219 |
302 | ||||||
| Provision for credit losses recognized in income |
(1 |
) |
(3 | ) | ||||
| Reclassification of net losses (gains) on debt securities and loans at fair value through other comprehensive income to income |
(39 |
) |
(39 | ) | ||||
| Unrealized foreign currency translation gains (losses) |
1 |
(11 | ) | |||||
| Net foreign currency translation gains (losses) from hedging activities |
(118 |
) |
(195 | ) | ||||
| Reclassification of losses (gains) on net investment hedging activities to income |
– |
– | ||||||
| Net gains (losses) on derivatives designated as cash flow hedges |
287 |
105 | ||||||
| Reclassification of losses (gains) on derivatives designated as cash flow hedges to income |
(255 |
) |
(309 | ) | ||||
| Remeasurement gains (losses) on employee benefit plans |
124 |
202 | ||||||
| Net gains (losses) from fair value change due to credit risk on financial liabilities designated at fair value through profit or loss |
(342 |
) |
(399 | ) | ||||
| Net gains (losses) on equity securities designated at fair value through other comprehensive income |
39 |
43 | ||||||
| Share-based compensation awards |
(36 |
) |
(12 | ) | ||||
| Distributions on other equity instruments and issuance costs |
(134 |
) |
(69 | ) | ||||
(255 |
) |
(385 | ) | |||||
| Total income taxes |
$ |
5,027 |
$ | 3,237 | ||||
| Note 21 Income taxes (continued) |
For the year ended |
||||||||||||||||
(Millions of Canadian dollars, except for percentage amounts) |
October 31, 2025 |
October 31, 2024 |
||||||||||||||
| Income taxes at Canadian statutory tax rate |
$ |
7,105 |
27.7 |
% |
$ | 5,502 | 27.7 | % | ||||||||
| Increase (decrease) in income taxes resulting from: |
||||||||||||||||
| Lower average tax rate applicable to subsidiaries (1) |
(1,810 |
) |
(7.1 |
) |
(1,971 | ) | (9.9 | ) | ||||||||
| Tax-exempt income from securities |
(34 |
) |
(0.1 |
) |
(52 | ) | (0.3 | ) | ||||||||
| Other |
21 |
0.1 |
143 | 0.7 | ||||||||||||
| Income taxes in Consolidated Statements of Income / effective tax rate |
$ |
5,282 |
20.6 |
% |
$ | 3,622 | 18.2 | % | ||||||||
| (1) | Includes Pillar Two current tax expense. The Organisation for Economic Co-operation and Development’s two-pillar plan to combat tax base erosion and profit sharing includes a 15 % global minimum corporate tax on certain multinational enterprises (Pillar Two). Pillar Two legislation in certain countries in which RBC operates became effective for us beginning November 1, 2024, including under the Global Minimum Tax Act in Canada. Pillar Two current tax expense includes both domestic top up taxes payable in foreign jurisdictions and income taxes payable in Canada under the Income Inclusion Rule. Pillar Two current tax expense increased RBC’s effective tax rate by approximately 1.4 % for the year ended October 31, 2025 (October 31, 2024 – not applicable). |
As at and for the year ended October 31, 2025 |
||||||||||||||||||||||||
(Millions of Canadian dollars) |
Net asset beginning of period |
Change through equity |
Change through profit or loss |
Exchange rate differences |
Acquisitions/ disposals |
Net asset end of period |
||||||||||||||||||
| Net deferred tax asset/(liability) |
||||||||||||||||||||||||
| Allowance for credit losses |
$ |
1,394 |
$ |
– |
$ |
150 |
$ |
2 |
$ |
– |
$ |
1,546 |
||||||||||||
| Deferred compensation |
2,167 |
36 |
243 |
34 |
– |
2,480 |
||||||||||||||||||
| Business realignment charges |
43 |
– |
22 |
1 |
– |
66 |
||||||||||||||||||
| Tax loss and tax credit carryforwards |
331 |
– |
20 |
2 |
– |
353 |
||||||||||||||||||
| Deferred (income) expense |
1,318 |
8 |
(433 |
) |
7 |
– |
900 |
|||||||||||||||||
| Financial instruments measured at fair value through other comprehensive income |
(158 |
) |
(93 |
) |
9 |
15 |
– |
(227 |
) | |||||||||||||||
| Premises and equipment and intangibles |
(1,476 |
) |
– |
182 |
(26 |
) |
– |
(1,320 |
) | |||||||||||||||
| Pension and post-employment related |
(463 |
) |
(127 |
) |
33 |
(1 |
) |
– |
(558 |
) | ||||||||||||||
| Other |
630 |
2 |
128 |
2 |
– |
762 |
||||||||||||||||||
$ |
3,786 |
$ |
(174 |
) |
$ |
354 |
$ |
36 |
$ |
– |
$ |
4,002 |
||||||||||||
| Comprising |
||||||||||||||||||||||||
| Deferred tax assets |
$ |
4,328 |
$ |
4,486 |
||||||||||||||||||||
| Deferred tax liabilities |
(542 |
) |
(484 |
) | ||||||||||||||||||||
$ |
3,786 |
$ |
4,002 |
|||||||||||||||||||||
| As at and for the year ended October 31, 2024 | ||||||||||||||||||||||||
(Millions of Canadian dollars) |
Net asset beginning of period |
Change through equity |
Change through profit or loss |
Exchange rate differences |
Acquisitions/ disposals |
Net asset end of period |
||||||||||||||||||
| Net deferred tax asset/(liability) |
||||||||||||||||||||||||
| Allowance for credit losses |
$ | 1,174 | $ | 4 | $ | 217 | $ | (1 | ) | $ | – | $ | 1,394 | |||||||||||
| Deferred compensation |
1,522 | 12 | 614 | 19 | – | 2,167 | ||||||||||||||||||
| Business realignment charges |
23 | – | 16 | – | 4 | 43 | ||||||||||||||||||
| Tax loss and tax credit carryforwards |
261 | – | 71 | (1 | ) | – | 331 | |||||||||||||||||
| Deferred (income) expense |
651 | 4 | 641 | 2 | 20 | 1,318 | ||||||||||||||||||
| Financial instruments measured at fair value through other comprehensive income |
(321 | ) | 164 | (1 | ) | – | – | (158 | ) | |||||||||||||||
| Premises and equipment and intangibles |
(967 | ) | – | 136 | (22 | ) | (623 | ) | (1,476 | ) | ||||||||||||||
| Pension and post-employment related |
(333 | ) | (206 | ) | 20 | (1 | ) | 57 | (463 | ) | ||||||||||||||
| Other |
680 | – | (213 | ) | – | 163 | 630 | |||||||||||||||||
| $ | 2,690 | $ | (22 | ) | $ | 1,501 | $ | (4 | ) | $ | (379 | ) | $ | 3,786 | ||||||||||
| Comprising |
||||||||||||||||||||||||
| Deferred tax assets |
$ | 3,116 | $ | 4,328 | ||||||||||||||||||||
| Deferred tax liabilities |
(426 | ) | (542 | ) | ||||||||||||||||||||
| $ | 2,690 | $ | 3,786 | |||||||||||||||||||||
| Note 22 Earnings per share |
| For the year ended | ||||||||
(Millions of Canadian dollars, except share and per share amounts) |
October 31 2025 |
October 31 2024 |
||||||
| Basic earnings per share |
||||||||
| Net income |
$ |
20,369 |
$ | 16,240 | ||||
| Dividends on preferred shares and distributions on other equity instruments |
(494 |
) |
(322 | ) | ||||
| Net income attributable to non-controlling interests |
(7 |
) |
(10 | ) | ||||
| Net income available to common shareholders |
$ |
19,868 |
$ | 15,908 | ||||
| Weighted average number of common shares (in thousands) |
1,409,072 |
1,411,903 | ||||||
| Basic earnings per share (in dollars) |
$ |
14.10 |
$ | 11.27 | ||||
| Diluted earnings per share |
||||||||
| Net income available to common shareholders |
$ |
19,868 |
$ | 15,908 | ||||
| Weighted average number of common shares (in thousands) |
1,409,072 |
1,411,903 | ||||||
| Stock options (1) |
2,517 |
1,833 | ||||||
| Issuable under other share-based compensation plans |
– |
19 | ||||||
| Average number of diluted common shares (in thousands) |
1,411,589 |
1,413,755 | ||||||
| Diluted earnings per share (in dollars) |
$ |
14.07 |
$ | 11.25 | ||||
| (1) | The dilutive effect of stock options was calculated using the treasury stock method. When the exercise price of options outstanding is greater than the average market price of our common shares, the options are excluded from the calculation of diluted earnings per share. For the years ended October 31, 2025 and October 31, 2024, no outstanding options were excluded from the calculation of diluted earnings per share. |
Note 23 Guarantees, commitments, pledged assets and contingencies |
Maximum exposure to credit losses |
||||||||
As at |
||||||||
(Millions of Canadian dollars) |
October 31 2025 |
October 31 2024 |
||||||
Financial guarantees |
||||||||
Financial standby letters of credit |
$ |
28,928 |
$ | 27,222 | ||||
Commitments to extend credit |
||||||||
Backstop liquidity facilities |
60,520 |
53,090 | ||||||
Credit enhancements |
3,895 |
3,482 | ||||||
Documentary and commercial letters of credit |
295 |
559 | ||||||
Other commitments to extend credit |
355,213 |
321,836 | ||||||
Other credit-related commitments |
||||||||
Securities lending indemnifications |
86,782 |
81,347 | ||||||
Performance guarantees |
12,691 |
12,283 | ||||||
Sponsored member guarantees |
81,681 |
50,241 | ||||||
Other |
116 |
446 | ||||||
• |
The risks and rewards of the pledged assets reside with the pledgor. |
• |
The pledged asset is returned to the pledgor when the necessary conditions have been satisfied. |
• |
The right of the pledgee to sell or re-pledge the asset is dependent on the specific agreement under which the collateral is pledged. |
• |
If there is no default, the pledgee must return the comparable asset to the pledgor upon satisfaction of the obligation. |
| Note 23 Guarantees, commitments, pledged assets and contingencies (continued) |
As at |
||||||||
(Millions of Canadian dollars) |
October 31 2025 |
October 31 2024 |
||||||
| Sources of pledged assets and collateral |
||||||||
| Bank assets |
||||||||
| Loans |
$ |
96,886 |
$ | 105,577 | ||||
| Securities |
139,671 |
105,061 | ||||||
| Other assets |
40,974 |
31,583 | ||||||
277,531 |
242,221 | |||||||
| Client assets (1) |
||||||||
| Collateral received and available for sale or re-pledging |
539,344 |
539,630 | ||||||
| Less: not sold or re-pledged |
(8,611 |
) |
(30,767 | ) | ||||
530,733 |
508,863 | |||||||
$ |
808,264 |
$ | 751,084 | |||||
| Uses of pledged assets and collateral |
||||||||
| Securities borrowing and lending |
$ |
238,301 |
$ | 198,887 | ||||
| Obligations related to securities sold short |
56,382 |
46,088 | ||||||
| Obligations related to securities loaned or sold under repurchase agreements |
292,335 |
305,788 | ||||||
| Securitization |
36,797 |
39,769 | ||||||
| Covered bonds |
64,926 |
71,307 | ||||||
| Derivative transactions |
73,686 |
50,100 | ||||||
| Foreign governments and central banks |
11,510 |
8,469 | ||||||
| Clearing systems, payment systems and depositories |
12,194 |
11,261 | ||||||
| Other |
22,133 |
19,415 | ||||||
$ |
808,264 |
$ | 751,084 | |||||
| (1) | Primarily relates to Obligations related to securities loaned or sold under repurchase agreements, Securities loaned and Derivative transactions. |
| Note 24 Legal and regulatory matters |
| Note 25 Related party transactions |
For the year ended |
||||||||
(Millions of Canadian dollars) |
October 31 2025 |
October 31 2024 |
||||||
| Salaries and other short-term employee benefits (1) |
$ |
35 |
$ | 31 | ||||
| Post-employment benefits (2) |
4 |
3 | ||||||
| Share-based payments (3) |
70 |
67 | ||||||
$ |
109 |
$ | 101 | |||||
(1) |
Includes the portion of the annual variable short-term incentive bonus that certain executives elected to receive in the form of DSUs. Refer to Note 20 for further details. Directors receive retainers but do not receive salaries and other short-term employee benefits. |
(2) |
Directors do not receive post-employment benefits. |
(3) |
The Bank offers share-based compensation plans to KMP and Directors. Refer to Note 20 for further details. |
| Note 25 Related party transactions (continued) |
| As at or for the year ended | ||||||||
(Millions of Canadian dollars) |
October 31 2025 |
October 31 2024 |
||||||
| Commitments and other contingencies |
$ |
1,207 |
$ | 1,226 | ||||
| Other fees received for services rendered |
105 |
73 | ||||||
| Other fees paid for services received |
121 |
119 | ||||||
| Note 26 Results by business segment |
As at or for the year ended October 31, 2025 |
||||||||||||||||||||||||||||
| (Millions of Canadian dollars) | Personal Banking |
Commercial Banking |
Wealth Management |
Insurance |
Capital Markets |
Corporate Support |
Total |
|||||||||||||||||||||
| Net interest income (3) |
$ |
14,496 |
$ |
7,268 |
$ |
5,459 |
$ |
– |
$ |
4,789 |
$ |
988 |
$ |
33,000 |
||||||||||||||
| Non-interest income |
5,358 |
1,294 |
16,919 |
1,321 |
9,637 |
(924 |
) |
33,605 |
||||||||||||||||||||
| Total revenue |
19,854 |
8,562 |
22,378 |
1,321 |
14,426 |
64 |
66,605 |
|||||||||||||||||||||
| Provision for credit losses |
2,105 |
1,550 |
120 |
– |
587 |
– |
4,362 |
|||||||||||||||||||||
| Non-interest expense |
8,001 |
2,833 |
16,769 |
315 |
7,966 |
708 |
36,592 |
|||||||||||||||||||||
| Net income (loss) before income taxes |
9,748 |
4,179 |
5,489 |
1,006 |
5,873 |
(644 |
) |
25,651 |
||||||||||||||||||||
| Income taxes (recoveries) |
2,643 |
1,159 |
1,200 |
178 |
480 |
(378 |
) |
5,282 |
||||||||||||||||||||
| Net income |
$ |
7,105 |
$ |
3,020 |
$ |
4,289 |
$ |
828 |
$ |
5,393 |
$ |
(266 |
) |
$ |
20,369 |
|||||||||||||
| Non-interest expense includes: |
||||||||||||||||||||||||||||
| Depreciation and amortization |
$ |
1,085 |
$ |
105 |
$ |
1,237 |
$ |
46 |
$ |
570 |
$ |
2 |
$ |
3,045 |
||||||||||||||
| Impairment of other intangibles |
9 |
– |
22 |
1 |
2 |
– |
34 |
|||||||||||||||||||||
| Total assets |
$ |
574,456 |
$ |
196,254 |
$ |
196,129 |
$ |
32,405 |
$ |
1,223,853 |
$ |
101,909 |
$ |
2,325,006 |
||||||||||||||
| Total assets include: |
||||||||||||||||||||||||||||
| Additions to premises and equipment and intangibles |
$ |
476 |
$ |
50 |
$ |
912 |
$ |
8 |
$ |
365 |
$ |
974 |
$ |
2,785 |
||||||||||||||
| Total liabilities |
$ |
574,462 |
$ |
196,252 |
$ |
194,689 |
$ |
32,234 |
$ |
1,223,212 |
$ |
(34,994 |
) |
$ |
2,185,855 |
|||||||||||||
| Note 26 Results by business segment (continued) |
| As at or for the year ended October 31, 2024 | ||||||||||||||||||||||||||||
| (Millions of Canadian dollars) | Personal Banking (1) |
Commercial Banking (1) |
Wealth Management (1) |
Insurance | Capital Markets (1), (2) |
Corporate Support (2) |
Total | |||||||||||||||||||||
| Net interest income (3) |
$ | 12,438 | $ | 6,061 | $ | 4,979 | $ | – | $ | 3,183 | $ | 1,292 | $ | 27,953 | ||||||||||||||
| Non-interest income |
4,904 | 1,321 | 14,647 | 1,224 | 8,829 | (1,534 | ) | 29,391 | ||||||||||||||||||||
| Total revenue |
17,342 | 7,382 | 19,626 | 1,224 | 12,012 | (242 | ) | 57,344 | ||||||||||||||||||||
| Provision for credit losses |
1,802 | 975 | 29 | 2 | 424 | – | 3,232 | |||||||||||||||||||||
| Non-interest expense |
7,485 | 2,512 | 15,312 | 285 | 7,016 | 1,640 | 34,250 | |||||||||||||||||||||
| Net income (loss) before income taxes |
8,055 | 3,895 | 4,285 | 937 | 4,572 | (1,882 | ) | 19,862 | ||||||||||||||||||||
| Income taxes (recoveries) |
2,134 | 1,077 | 863 | 208 | (1 | ) | (659 | ) | 3,622 | |||||||||||||||||||
| Net income |
$ | 5,921 | $ | 2,818 | $ | 3,422 | $ | 729 | $ | 4,573 | $ | (1,223 | ) | $ | 16,240 | |||||||||||||
| Non-interest expense includes: |
||||||||||||||||||||||||||||
| Depreciation and amortization |
$ | 1,105 | $ | 62 | $ | 1,223 | $ | 6 | $ | 528 | $ | (11 | ) | $ | 2,913 | |||||||||||||
| Impairment of other intangibles |
21 | – | 23 | 2 | 22 | – | 68 | |||||||||||||||||||||
| Total assets |
$ | 555,029 | $ | 187,142 | $ | 184,503 | $ | 29,288 | $ | 1,127,661 | $ | 87,959 | $ | 2,171,582 | ||||||||||||||
| Total assets include: |
||||||||||||||||||||||||||||
| Additions to premises and equipment and intangibles |
$ | 2,274 | $ | 740 | $ | 887 | $ | 11 | $ | 494 | $ | 680 | $ | 5,086 | ||||||||||||||
| Total liabilities |
$ | 554,970 | $ | 187,135 | $ | 183,055 | $ | 29,158 | $ | 1,127,564 | $ | (37,492) | $ | 2,044,390 | ||||||||||||||
| (1) | On March 28, 2024, we completed the HSBC Canada transaction. HSBC Canada results have been consolidated from the closing date, and are included in our Personal Banking, Commercial Banking, Wealth Management and Capital Markets segments. For further details, refer to Note 6. |
| (2) | Taxable equivalent basis. |
| (3) | Interest revenue is reported net of interest expense as we rely primarily on net interest income as a performance measure. |
As at or for the year ended |
||||||||||||||||||||||||||||||||
October 31, 2025 |
October 31, 2024 |
|||||||||||||||||||||||||||||||
(Millions of Canadian dollars) |
Canada |
United States |
Other International |
Total |
Canada |
United States |
Other International |
Total |
||||||||||||||||||||||||
| Total revenue |
$ |
41,861 |
$ |
17,200 |
$ |
7,544 |
$ |
66,605 |
$ | 35,847 | $ | 15,034 | $ | 6,463 | $ | 57,344 | ||||||||||||||||
| Net income |
14,537 |
3,804 |
2,028 |
20,369 |
11,266 | 2,880 | 2,094 | 16,240 | ||||||||||||||||||||||||
| Total assets |
1,278,626 |
681,125 |
365,255 |
2,325,006 |
1,205,561 | 615,747 | 350,274 | 2,171,582 | ||||||||||||||||||||||||
| Note 27 Nature and extent of risks arising from financial instruments |
As at October 31, 2025 |
||||||||||||||||||||||||||||||||||||
| (Millions of Canadian dollars, except percentage amounts) |
Canada |
% |
United States |
% |
Europe |
% |
Other International |
% |
Total |
|||||||||||||||||||||||||||
| On-balance sheet assets other than derivatives (1) |
$ |
895,328 |
66% |
$ |
315,466 |
23% |
$ |
92,304 |
7% |
$ |
56,119 |
4% |
$ |
1,359,217 |
||||||||||||||||||||||
| Derivatives before master netting agreements (2), (3) |
20,508 |
11% |
70,345 |
39% |
74,177 |
42% |
15,323 |
8% |
180,353 |
|||||||||||||||||||||||||||
$ |
915,836 |
59% |
$ |
385,811 |
25% |
$ |
166,481 |
11% |
$ |
71,442 |
5% |
$ |
1,539,570 |
|||||||||||||||||||||||
| Off-balance sheet credit instruments (4) |
||||||||||||||||||||||||||||||||||||
| Committed and uncommitted (5) |
$ |
506,219 |
55% |
$ |
318,215 |
35% |
$ |
60,389 |
7% |
$ |
30,923 |
3% |
$ |
915,746 |
||||||||||||||||||||||
| Other |
86,735 |
41% |
100,512 |
48% |
18,665 |
9% |
4,286 |
2% |
210,198 |
|||||||||||||||||||||||||||
$ |
592,954 |
53% |
$ |
418,727 |
37% |
$ |
79,054 |
7% |
$ |
35,209 |
3% |
$ |
1,125,944 |
|||||||||||||||||||||||
| | ||||||||||||||||||||||||||||||||||||
As at October 31, 2024 |
||||||||||||||||||||||||||||||||||||
| (Millions of Canadian dollars, except percentage amounts) |
Canada |
% |
United States |
% |
Europe |
% |
Other International |
% |
Total |
|||||||||||||||||||||||||||
| On-balance sheet assets other than derivatives (1) |
$ | 897,614 | 67% | $ | 297,335 | 22% | $ | 88,394 | 7% | $ | 54,912 | 4% | $ | 1,338,255 | ||||||||||||||||||||||
| Derivatives before master netting agreements (2), (3) |
21,555 | 14% | 47,204 | 31% | 71,198 | 46% | 13,276 | 9% | 153,233 | |||||||||||||||||||||||||||
| $ | 919,169 | 61% | $ | 344,539 | 23% | $ | 159,592 | 11% | $ | 68,188 | 5% | $ | 1,491,488 | |||||||||||||||||||||||
| Off-balance sheet credit instruments (4) |
||||||||||||||||||||||||||||||||||||
| Committed and uncommitted (5) |
$ | 487,142 | 57% | $ | 282,907 | 34% | $ | 51,516 | 6% | $ | 27,615 | 3% | $ | 849,180 | ||||||||||||||||||||||
| Other |
82,910 | 48% | 67,322 | 39% | 18,162 | 11% | 3,145 | 2% | 171,539 | |||||||||||||||||||||||||||
| $ | 570,052 | 56% | $ | 350,229 | 34% | $ | 69,678 | 7% | $ | 30,760 | 3% | $ | 1,020,719 | |||||||||||||||||||||||
| (1) | Includes Assets purchased under reverse repurchase agreements and securities borrowed and Loans. The largest concentrations in Canada are Ontario at 54% (October 31, 2024 – 57%), Alberta, Saskatchewan and Manitoba at 15% (October 31, 2024 – 13%), British Columbia and the territories at 17% (October 31, 2024 – 16%) and Quebec at 10% (October 31, 2024 – 10%). No industry accounts for more than 20% (October 31, 2024 – 20%) of total on-balance sheet credit instruments, with the exception of Banking, which accounted for 22% (October 31, 2024 – 24%), and Government, which accounted for 31% (October 31, 2024 – 28%). The classification of our sectors aligns with our view of credit risk by industry. |
| (2) | A further breakdown of our derivative exposures by risk rating and counterparty type is provided in Note 9. |
| (3) | Excludes valuation adjustments determined on a pooled basis. |
| (4) | Balances presented are contractual amounts representing our maximum exposure to credit risk. |
| (5) | Represents our maximum exposure to credit risk. Retail and wholesale commitments respectively comprise 43% and 57% of our total commitments (October 31, 2024 – 40% and 60%). The largest concentrations in the wholesale portfolio relate to Financial services at 17% (October 31, 2024 – 14%), Real estate and related at 12% (October 31, 2024 – 12%), Investments at 10% (October 31, 2024 – 10%), Utilities at 8% (October 31, 2024 – 10%), and Other services at 9% (October 31, 2024 – 7%). The classification of our sectors aligns with our view of credit risk by industry. |
| Note 28 Capital management |
As at |
||||||||
(Millions of Canadian dollars, except percentage amounts) |
October 31 2025 |
October 31 2024 |
||||||
Capital (1) |
||||||||
CET1 capital |
$ |
98,748 |
$ | 88,936 | ||||
Tier 1 capital |
110,393 |
97,952 | ||||||
Total capital |
122,399 |
110,487 | ||||||
Risk-weighted assets (RWA) used in calculation of capital ratios (1) |
||||||||
Credit risk |
$ |
590,306 |
$ | 548,809 | ||||
Market risk |
41,506 |
33,930 | ||||||
Operational risk |
98,413 |
89,543 | ||||||
Total RWA |
$ |
730,225 |
$ | 672,282 | ||||
Capital ratios and Leverage ratio (1) |
||||||||
CET1 ratio |
13.5% |
13.2% | ||||||
Tier 1 capital ratio |
15.1% |
14.6% | ||||||
Total capital ratio |
16.8% |
16.4% | ||||||
Leverage ratio |
4.4% |
4.2% | ||||||
Leverage ratio exposure |
$ |
2,491,090 |
$ | 2,344,228 | ||||
TLAC available and ratios (2) |
||||||||
TLAC available |
$ |
230,385 |
$ | 196,659 | ||||
TLAC ratio |
31.5% |
29.3% | ||||||
TLAC leverage ratio |
9.2% |
8.4% | ||||||
| (1) | Capital, RWA and capital ratios are calculated using OSFI’s Capital Adequacy Requirements (CAR) guideline and the Leverage ratio is calculated using OSFI’s Leverage Requirements (LR) guideline. Both the CAR guideline and LR guideline are based on the Basel III framework. |
| (2) | TLAC available and TLAC ratios are calculated using OSFI’s TLAC guideline. The TLAC standard is applied at the resolution entity level which for us is deemed to be Royal Bank of Canada and its subsidiaries. A resolution entity and its subsidiaries are collectively called a resolution group. The TLAC ratio and TLAC leverage ratio are calculated using TLAC available as a percentage of total RWA and leverage exposure, respectively. |
Note 29 Offsetting financial assets and financial liabilities |
As at October 31, 2025 |
||||||||||||||||||||||||||||||||
Amounts subject to enforceable netting arrangements |
||||||||||||||||||||||||||||||||
Related amounts not offset on the Consolidated Balance Sheets |
||||||||||||||||||||||||||||||||
(Millions of Canadian dollars) |
Gross amounts of recognized financial instruments |
Gross amounts offset on the Consolidated Balance Sheets |
Net amounts presented in the Consolidated Balance Sheets |
Impact of master netting agreements |
Financial collateral |
Net amounts |
Amounts not subject to enforceable netting arrangements |
Net amounts presented on the Consolidated Balance Sheets |
||||||||||||||||||||||||
Financial assets |
||||||||||||||||||||||||||||||||
Assets purchased under reverse repurchase agreements and securities borrowed |
$ |
467,653 |
$ |
157,970 |
$ |
309,683 |
$ |
101 |
$ |
308,751 |
$ |
831 |
$ |
– |
$ |
309,683 |
||||||||||||||||
Derivative assets |
173,512 |
2,067 |
171,445 |
127,728 |
19,425 |
24,292 |
5,761 |
177,206 |
||||||||||||||||||||||||
Other financial assets |
2,364 |
540 |
1,824 |
30 |
382 |
1,412 |
– |
1,824 |
||||||||||||||||||||||||
$ |
643,529 |
$ |
160,577 |
$ |
482,952 |
$ |
127,859 |
$ |
328,558 |
$ |
26,535 |
$ |
5,761 |
$ |
488,713 |
|||||||||||||||||
Financial liabilities |
||||||||||||||||||||||||||||||||
Obligations related to assets sold under repurchase agreements and securities loaned |
$ |
447,486 |
$ |
157,970 |
$ |
289,516 |
$ |
101 |
$ |
287,612 |
$ |
1,803 |
$ |
– |
$ |
289,516 |
||||||||||||||||
Derivative liabilities |
172,461 |
2,067 |
170,394 |
127,728 |
23,520 |
19,146 |
13,559 |
183,953 |
||||||||||||||||||||||||
Other financial liabilities |
1,457 |
540 |
917 |
30 |
– |
887 |
– |
917 |
||||||||||||||||||||||||
$ |
621,404 |
$ |
160,577 |
$ |
460,827 |
$ |
127,859 |
$ |
311,132 |
$ |
21,836 |
$ |
13,559 |
$ |
474,386 |
|||||||||||||||||
| As at October 31, 2024 | ||||||||||||||||||||||||||||||||
| Amounts subject to enforceable netting arrangements | ||||||||||||||||||||||||||||||||
Related amounts not offset on the Consolidated Balance Sheets (1) |
||||||||||||||||||||||||||||||||
| (Millions of Canadian dollars) | Gross amounts of recognized financial instruments |
Gross amounts offset on the Consolidated Balance Sheets |
Net amounts presented in the Consolidated Balance Sheets |
Impact of master netting agreements |
Financial collateral (2) |
Net amounts | Amounts not subject to enforceable netting arrangements |
Net amounts presented on the Consolidated Balance Sheets |
||||||||||||||||||||||||
Financial assets |
||||||||||||||||||||||||||||||||
Assets purchased under reverse repurchase agreements and securities borrowed |
$ | 495,881 | $ | 145,078 | $ | 350,803 | $ | 112 | $ | 349,044 | $ | 1,647 | $ | – | $ | 350,803 | ||||||||||||||||
Derivative assets |
145,420 | 1,568 | 143,852 | 105,433 | 16,806 | 21,613 | 6,760 | 150,612 | ||||||||||||||||||||||||
Other financial assets |
2,940 | 527 | 2,413 | 58 | 288 | 2,067 | – | 2,413 | ||||||||||||||||||||||||
| $ | 644,241 | $ | 147,173 | $ | 497,068 | $ | 105,603 | $ | 366,138 | $ | 25,327 | $ | 6,760 | $ | 503,828 | |||||||||||||||||
Financial liabilities |
||||||||||||||||||||||||||||||||
Obligations related to assets sold under repurchase agreements and securities loaned |
$ | 450,399 | $ | 145,078 | $ | 305,321 | $ | 112 | $ | 302,779 | $ | 2,430 | $ | – | $ | 305,321 | ||||||||||||||||
Derivative liabilities |
151,564 | 1,568 | 149,996 | 105,433 | 17,727 | 26,836 | 13,767 | 163,763 | ||||||||||||||||||||||||
Other financial liabilities |
1,941 | 527 | 1,414 | 58 | – | 1,356 | – | 1,414 | ||||||||||||||||||||||||
| $ | 603,904 | $ | 147,173 | $ | 456,731 | $ | 105,603 | $ | 320,506 | $ | 30,622 | $ | 13,767 | $ | 470,498 | |||||||||||||||||
| (1) | Financial collateral is reflected at fair value. The financial instrument amounts and financial collateral disclosed are limited to the net balance sheet exposure, and any over-collateralization is excluded from the table. |
(2) |
Includes cash collateral of $16 billion (October 31, 2024 – $14 billion) and non-cash collateral of $312 billion (October 31, 2024 – $352 billion) received for financial assets and cash collateral of $19 billion (October 31, 2024 – $14 billion) and non-cash collateral of $292 billion (October 31, 2024 – $307 billion) pledged for financial liabilities. |
| Note 30 Recovery and settlement of on-balance sheet assets and liabilities |
As at |
||||||||||||||||||||||||||
October 31, 2025 |
October 31, 2024 |
|||||||||||||||||||||||||
(Millions of Canadian dollars) |
Within one year |
After one year |
Total |
Within one year |
After one year |
Total |
||||||||||||||||||||
| Assets |
||||||||||||||||||||||||||
| Cash and due from banks (1) |
$ |
35,136 |
$ |
1,888 |
$ |
37,024 |
$ | 55,003 | $ | 1,720 | $ | 56,723 | ||||||||||||||
| Interest-bearing deposits with banks |
50,364 |
– |
50,364 |
66,020 | – | 66,020 | ||||||||||||||||||||
| Securities |
||||||||||||||||||||||||||
| Trading (2) |
204,063 |
15,004 |
219,067 |
170,460 | 12,840 | 183,300 | ||||||||||||||||||||
| Investment, net of applicable allowance |
70,438 |
272,283 |
342,721 |
45,418 | 211,200 | 256,618 | ||||||||||||||||||||
| Assets purchased under reverse repurchase and securities borrowed |
309,632 |
51 |
309,683 |
350,622 | 181 | 350,803 | ||||||||||||||||||||
| Loans |
||||||||||||||||||||||||||
| Retail |
200,928 |
451,416 |
652,344 |
174,761 | 452,217 | 626,978 | ||||||||||||||||||||
| Wholesale |
98,494 |
298,677 |
397,171 |
89,492 | 270,947 | 360,439 | ||||||||||||||||||||
| Allowance for loan losses |
(7,093 |
) |
(6,037 | ) | ||||||||||||||||||||||
| Other |
||||||||||||||||||||||||||
| Derivatives (2) |
174,943 |
2,263 |
177,206 |
148,605 | 2,007 | 150,612 | ||||||||||||||||||||
| Premises and equipment |
109 |
6,710 |
6,819 |
156 | 6,696 | 6,852 | ||||||||||||||||||||
| Goodwill |
– |
19,405 |
19,405 |
– | 19,286 | 19,286 | ||||||||||||||||||||
| Other intangibles |
– |
7,402 |
7,402 |
– | 7,798 | 7,798 | ||||||||||||||||||||
| Other assets |
90,520 |
22,373 |
112,893 |
69,287 | 22,903 | 92,190 | ||||||||||||||||||||
$ |
1,234,627 |
$ |
1,097,472 |
$ |
2,325,006 |
$ | 1,169,824 | $ | 1,007,795 | $ | 2,171,582 | |||||||||||||||
| Liabilities |
||||||||||||||||||||||||||
| Deposits (3) |
$ |
1,244,662 |
$ |
270,954 |
$ |
1,515,616 |
$ | 1,144,860 | $ | 264,671 | $ | 1,409,531 | ||||||||||||||
| Other |
||||||||||||||||||||||||||
| Obligations related to securities sold short |
49,241 |
650 |
49,891 |
32,824 | 2,462 | 35,286 | ||||||||||||||||||||
| Obligations related to assets sold under repurchase agreements and securities loaned |
287,844 |
1,672 |
289,516 |
304,855 | 466 | 305,321 | ||||||||||||||||||||
| Derivatives (2) |
182,415 |
1,538 |
183,953 |
158,622 | 5,141 | 163,763 | ||||||||||||||||||||
| Insurance contract liabilities (4) |
382 |
23,945 |
24,327 |
459 | 21,772 | 22,231 | ||||||||||||||||||||
| Other liabilities |
73,000 |
35,591 |
108,591 |
70,499 | 24,213 | 94,712 | ||||||||||||||||||||
| Subordinated debentures |
2,091 |
11,870 |
13,961 |
– | 13,546 | 13,546 | ||||||||||||||||||||
$ |
1,839,635 |
$ |
346,220 |
$ |
2,185,855 |
$ | 1,712,119 | $ | 332,271 | $ | 2,044,390 | |||||||||||||||
| (1) | Cash and due from banks are assumed to be recovered within one year, except for cash balances not available for use by the Bank beyond one year. |
| (2) | Trading securities classified as FVTPL and trading derivatives are presented as within one year as this best represents in most instances the short-term nature of our trading activities, except for debt securities relating to the Insurance segment which are presented based on contractual maturity. Trading securities designated as FVTPL are generally presented based on contractual maturity. Non-trading derivatives are presented according to the recovery or settlement of the hedging transaction. |
| (3) | Demand deposits of $673 billion (October 31, 2024 – $585 billion) are presented as within one year due to their being repayable on demand or at short notice on a contractual basis. In practice, these deposits relate to a broad range of individuals and customer-types which form a stable base for our operations and liquidity needs. |
| (4) | Insurance contract liabilities reflect the estimated timing of when settlement of those amounts are expected to occur. The amounts payable on demand relating to policyholders’ cash and/or account values for insurance contract liabilities, including segregated fund insurance contract liabilities, is $8 billion (October 31, 2024 – $8 billion). |
| Note 31 Parent company information |
| As at | ||||||||
(Millions of Canadian dollars) |
October 31 2025 |
October 31 2024 |
||||||
| Assets |
||||||||
| Cash and due from banks |
$ |
24,132 |
$ | 40,944 | ||||
| Interest-bearing deposits with banks |
40,455 |
54,009 | ||||||
| Securities |
311,972 |
233,376 | ||||||
| Investments in bank subsidiaries and associated companies (1) |
67,055 |
57,926 | ||||||
| Investments in other subsidiaries and associated companies |
122,842 |
117,362 | ||||||
| Assets purchased under reverse repurchase agreements and securities borrowed |
155,843 |
174,131 | ||||||
| Loans, net of allowance for loan losses |
887,465 |
839,424 | ||||||
| Net balances due from bank subsidiaries (1) |
– |
97 | ||||||
| Other assets |
259,121 |
216,003 | ||||||
$ |
1,868,885 |
$ | 1,733,272 | |||||
| Liabilities and shareholders’ equity |
||||||||
| Deposits |
$ |
1,261,032 |
$ | 1,168,765 | ||||
| Net balances due to bank subsidiaries (1) |
16,320 |
– | ||||||
| Net balances due to other subsidiaries |
15,050 |
17,840 | ||||||
| Other liabilities |
423,430 |
406,032 | ||||||
1,715,832 |
1,592,637 | |||||||
| Subordinated debentures |
13,961 |
13,546 | ||||||
| Shareholders’ equity |
139,092 |
127,089 | ||||||
$ |
1,868,885 |
$ | 1,733,272 | |||||
| (1) | Bank refers primarily to regulated deposit-taking institutions and securities firms. |
| For the year ended | ||||||||
(Millions of Canadian dollars) |
October 31 2025 |
October 31 2024 |
||||||
| Interest and dividend income (1) |
$ |
70,321 |
$ | 70,603 | ||||
| Interest expense |
53,966 |
57,094 | ||||||
| Net interest income |
16,355 |
13,509 | ||||||
| Non-interest income (2) |
8,916 |
5,080 | ||||||
| Total revenue |
25,271 |
18,589 | ||||||
| Provision for credit losses |
4,039 |
2,964 | ||||||
| Non-interest expense |
14,234 |
13,543 | ||||||
| Income before income taxes |
6,998 |
2,082 | ||||||
| Income taxes |
2,526 |
1,031 | ||||||
| Net income before equity in undistributed income of subsidiaries |
4,472 |
1,051 | ||||||
| Equity in undistributed income of subsidiaries |
15,890 |
15,179 | ||||||
| Net income |
$ |
20,362 |
$ | 16,230 | ||||
| Other comprehensive income (loss), net of taxes |
772 |
597 | ||||||
| Total comprehensive income |
$ |
21,134 |
$ | 16,827 | ||||
| (1) | Includes dividend income from investments in subsidiaries and associated companies of $1 million (October 31, 2024 – $9 million). |
| (2) | Includes a nominal share of income (loss) from associated companies (October 31, 2024 – nominal). |
| Note 31 Parent company information (continued) |
| For the year ended |
||||||||
(Millions of Canadian dollars) |
October 31 2025 |
October 31 2024 |
||||||
| Cash flows from operating activities |
||||||||
| Net income |
$ |
20,362 |
$ | 16,230 | ||||
| Adjustments to determine net cash from operating activities: |
||||||||
| Change in undistributed earnings of subsidiaries |
(15,890 |
) |
(15,179 | ) | ||||
| Change in deposits |
92,267 |
77,327 | ||||||
| Change in loans |
(49,013 |
) |
(56,572 | ) | ||||
| Change in trading securities |
(26,471 |
) |
3,162 | |||||
| Change in obligations related to assets sold under repurchase agreements and securities loaned |
(26,361 |
) |
(2,860 | ) | ||||
| Change in assets purchased under reverse repurchase agreements and securities borrowed |
18,288 |
(24,203 | ) | |||||
| Change in obligations related to securities sold short |
14,955 |
(1,721 | ) | |||||
| Other operating activities, net |
(9,112 |
) |
(2,565 | ) | ||||
| Net cash from (used in) operating activities |
19,025 |
(6,381 | ) | |||||
| Cash flows from investing activities |
||||||||
| Change in interest-bearing deposits with banks |
13,554 |
7,247 | ||||||
| Proceeds from sales and maturities of investment securities |
150,541 |
167,772 | ||||||
| Purchases of investment securities |
(202,133 |
) |
(152,935 | ) | ||||
| Net acquisitions of premises and equipment and other intangibles |
(1,842 |
) |
(1,277 | ) | ||||
| Cash used in an acquisition, net of cash acquired |
– |
(12,872 | ) | |||||
| Change in cash invested in subsidiaries |
(643 |
) |
1,252 | |||||
| Change in net funding provided to subsidiaries |
13,627 |
(166 | ) | |||||
| Net cash from (used in) investing activities |
(26,896 |
) |
9,021 | |||||
| Cash flows from financing activities |
||||||||
| Issuance of subordinated debentures |
2,991 |
3,239 | ||||||
| Repayment of subordinated debentures |
(2,750 |
) |
(1,500 | ) | ||||
| Issue of common shares, net of issuance costs |
72 |
159 | ||||||
| Common shares purchased for cancellation |
(2,768 |
) |
(140 | ) | ||||
| Issue of preferred shares and other equity instruments, net of issuance costs |
4,945 |
2,702 | ||||||
| Redemption of preferred shares and other equity instruments |
(2,350 |
) |
(1,021 | ) | ||||
| Dividends paid on shares and distributions paid on other equity instruments |
(8,800 |
) |
(6,637 | ) | ||||
| Repayment of lease liabilities |
(281 |
) |
(268 | ) | ||||
| Net cash from (used in) financing activities |
(8,941 |
) |
(3,466 | ) | ||||
| Net change in cash and due from banks |
(16,812 |
) |
(826 | ) | ||||
| Cash and due from banks at beginning of year |
40,944 |
41,770 | ||||||
| Cash and due from banks at end of year |
$ |
24,132 |
$ | 40,944 | ||||
| Supplemental disclosure of cash flow information |
||||||||
| Amount of interest paid |
$ |
53,560 |
$ | 55,119 | ||||
| Amount of interest received |
65,880 |
67,857 | ||||||
| Amount of dividends received |
3,388 |
2,869 | ||||||
| Amount of income taxes paid |
2,599 |
504 | ||||||
| Note 32 Principal subsidiaries |
(Millions of Canadian dollars) |
As at October 31, 2025 |
|||||
| Principal subsidiaries (1) |
Principal office address (2) |
Carrying value of voting shares owned by the Bank (3) |
||||
Royal Bank Holding Inc. |
Toronto, Ontario, Canada | $ |
103,027 |
|||
RBC Direct Investing Inc. |
Toronto, Ontario, Canada | |||||
RBC Insurance Holdings Inc. |
Mississauga, Ontario, Canada | |||||
RBC Life Insurance Company |
Mississauga, Ontario, Canada | |||||
Investment Holdings (Cayman) Limited |
George Town, Grand Cayman, Cayman Islands | |||||
RBC (Cayman) Funding Ltd. |
George Town, Grand Cayman, Cayman Islands | |||||
Capital Funding Alberta Limited |
Calgary, Alberta, Canada | |||||
RBC Global Asset Management Inc. |
Toronto, Ontario, Canada | |||||
RBC Investor Services Trust |
Toronto, Ontario, Canada | |||||
RBC (Barbados) Trading Bank Corporation |
St. James, Barbados | |||||
| RBC US Group Holdings LLC (2) |
Toronto, Ontario, Canada | 38,425 |
||||
| RBC USA Holdco Corporation |
New York, New York, U.S. | |||||
| RBC Capital Markets, LLC |
New York, New York, U.S. | |||||
| City National Bank |
Los Angeles, California, U.S. | |||||
| RBC Dominion Securities Limited |
Toronto, Ontario, Canada | 19,306 |
||||
| RBC Dominion Securities Inc. |
Toronto, Ontario, Canada | |||||
| Royal Bank Mortgage Corporation |
Toronto, Ontario, Canada | 7,420 |
||||
| RBC Europe Limited |
London, England | 5,822 |
||||
| The Royal Trust Company |
Montreal, Quebec, Canada | 1,782 |
||||
| Royal Trust Corporation of Canada |
Toronto, Ontario, Canada | 785 |
||||
(1) |
The Bank directly or indirectly controls each subsidiary. |
(2) |
Each subsidiary is incorporated or organized under the laws of the state, province or country in which the principal office is situated, except for RBC US Group Holdings LLC and RBC USA Holdco Corporation, which are incorporated under the laws of the State of Delaware, U.S.; RBC Capital Markets, LLC, which is organized under the laws of the State of Minnesota, U.S.; and City National Bank, which is a national bank, chartered under the laws of the United States of America. |
(3) |
The carrying value of voting shares is stated as the Bank’s equity in such investments. |
Exhibit 5
Return on Equity and Assets Ratios
| |
For the Year-Ended October 2025 |
|
|
For the Year-Ended October 2024 |
|
|
For the Year-Ended October 2023(1) |
| ||||
| Return on Assets |
0.85 | % | 0.77 | % | 0.73 | % | ||||||
| Return on Equity |
16.3 | % | 14.4 | % | 14.3 | % | ||||||
| Dividend Payout Ratio |
43 | % | 50 | % | 52 | % | ||||||
|
|
|
|
|
|
|
(1) Amounts have been restated from those previously presented as part of the adoption of IFRS 17, effective November 1, 2023.